

 PDF
PDF ePub
ePub Citation
 Print
Print


INTRODUCTION
Angiomyolipoma (AML), the most commonly occurring benign renal tumor has a unique histologic composition of adipose tissue, thick-walled blood vessels and smooth muscle (1). The classical ultrasonography (US) appearance of renal AML is that of a strong hyperechoic lesion against the backdrop of a hypoechoic renal cortex, due to fat tissue and 341the multiple tissue interfaces between fatty and non-fatty components within the tumor (2). However, the relative amounts of each tissue varies with a minimal fat component in the AML subset leading to hypoechoic lesion with rich intratumoral blood flow on US imaging. This can cause a significant diagnostic dilemma with clear cell renal cell carcinoma (ccRCC) due to its similar appearance on imaging (3). Epithelioid AML, a rare subtype of AML characterized by the epithelioid cellular portion, also belongs to minimal fat AML, so called according to radiological findings instead of histopathologic results. Despite its malignant potential and the need of partial nephrectomy, it can be treated conservatively in some cases, e.g., elderly and frail patients, similar to treatment of conventional minimal fat AML (4, 5). Thus, definitive distinction between minimal fat AML, both epithelioid and conventional AML, and ccRCC is essential. Contrast-enhanced ultrasonography (CEUS) is applied in the diagnosis of renal minimal fat AMLs and some imaging features are reportedly helpful in their differentiation from other renal tumors, such as slow centripetal enhancement (3), homogeneous enhancement and prolonged hyperenhancement (6). However, these reports are qualitative analyses of a small number of cases and thus subjective with low reproducibility. Quantitative analysis on the other hand, affords a more objective, reliable method to compare time-related and enhancement-degree-related parameters between different lesions, but has not been comprehensively studied. We retrospectively reviewed the imaging features and undertook software-based quantitative analysis of hypoechoic AMLs and ccRCCs to evaluate the distinguishing features between these 2 entities.
MATERIALS AND METHODS
Patients
Over a 3-year period, from January 2011 to December 2013, 578 consecutive patients underwent partial or radical nephrectomy in our institution, including 457 ccRCCs, 58 AMLs, 22 papillary renal cell carcinomas (pRCCs), 18 chromphobe renal cell carcinomas (cRCCs), 9 oncocytomas, 3 inflammatory lesions and 11 cysts. Medical records of these patients were available. Inclusion criteria of our study were as follows: lesions that appeared hypoechoic in comparison with the adjacent renal cortex, and solid on conventional US; both preoperative conventional US and CEUS performed on each lesion. Thus, 197 patients met the inclusion criteria, including 149 ccRCCs, 35 AMLs, 5 pRCCs, 4 cRCCs, and 4 oncocytomas. Due to the small number of pRCC, cRCC and oncocytoma, they were excluded from the study. Exclusion criteria for quantitative analysis based on CEUS were as follows: too short contrast enhanced video (< 60 seconds from arrival of contrast agent to end of video) or too late recording (no "black screen" before contrast arrival) (n = 3); technical problems, e.g., wiggly recording, fragile breath-hold, imaging plane without adjacent renal cortex (n = 3); artifacts/corrupted video quality, e.g., out-of-plane movements, US absorption and dispersion of tumors in depth (n = 4). Thus 32 AMLs (male = 13, female = 19; age range, 19-63 years; mean age, 40.3 ± 16.4 years) (5 epithelioid AMLs and 27 conventional AMLs) and 142 ccRCCs (male = 93, female = 49; age range, 28-74 years; mean age, 48.7 ± 20.1 years) were included in the study. All patients were with normal renal function. The Ethics Committee of our institution approved the study that conformed to the World Medical Association Declaration of Helsinki: Ethical principles for medical research involving human subjects, as revised in 2008.
Imaging Technique
A sonologist with > 10 years experience with CEUS of kidney performed the conventional US and CEUS scan using Logic E9 (GE Healthcare, England; C1-5, 1-5 MHz). Each lesion was scanned first using unenhanced gray-scale US with noise- and speckle-reducing modes. The system was then switched to a contrast-specific mode for the CEUS study. The dual mode of the scanner enabled simultaneous visualization of the conventional baseline image and the dark, tissue-suppressed contrast-enhanced image. To ensure good, artifact-free video sequences, certain standard criteria during the study phase were established: initial images with no visible contrast agent ("black screen"), renal lesion-centered recording, normal renal parenchyma on the same depth as the tumor throughout the recording, stable image with no undesired excursions or transducer movements. The technical parameters were as follows: mechanical index < 0.1, dynamic range of 65-70 dB, temporal resolution between 10-13 frames per second, echo-signal gain below noise visibility, signal persistence turned off, and one focus below the level of the lesion. The same operator administered an intravenous bolus (1.2 mL) of contrast agent, Sonovue (Bracco, Italy), followed by a 5-mL saline flush.
The patient was asked to half-fill the lungs by continuous slight breathing and the probe was held steadily to avoid strong motion of the lesions. The duration of CEUS from arrival of contrast agent in the renal artery to end of video was required to be no less than 60 seconds. Video clips of real-time CEUS were recorded on hard disc for off-line analysis. The transfer materials were DICOM-files.
Imaging Interpretation and Quantitative Analysis
Imaging interpretation and quantitative analysis were independently performed by 2 senior radiologists who were blinded to the histopathology. Qualitative interpretations were analyzed in consensus and the quantitative parameters were the average from the 2 observers. The lesion size was assessed on conventional US. Furthermore, the lesions were classified as exophytic when they caused renal contour deformity in the renal margin, otherwise, as nonexophytic. On CEUS, the enhancement patterns and features were categorized as follows: 1) Centripetal enhancement referred to tumor enhancement from the lesion periphery to the center; entire enhancement occurred when both, the tumor periphery and central areas, were enhanced synchronously. 2) For homogeneity at peak enhancement, homogeneous enhancement was defined as the appearance of a lesion occupied by a full enhancement, regardless of various enhancement echo levels. Heterogeneous enhancement was defined as a lesion with enhancement defects. 3) Pseudocapsule sign was defined as an enhanced rim of peritumoral tissue during CEUS (7, 8).
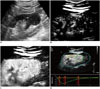
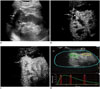
Quantitative analysis was done with SonoLiver (Bracco Research SA, Geneva, Switzerland and TomTec Imaging Systems GmbH, Unterschleissheim, Germany) to derive quantitative parameters that included 3 consecutive steps. The first step involved the exclusion of unwanted images from processing, such as out-of-plane images and images preceding contrast arrival. The second step involved selection of a representative image that serves as a reference position for the motion compensation algorithm where the renal lesion is well delineated, generally at peak enhancement. The last step involved manual drawing of 2 regions of interest (ROIs). Analysis ROI, representing the area in which quantitative parameter analysis are computed and displayed, encompass the major enhanced solid portion of the lesions, regardless of shape. Reference ROI, was drawn in the adjacent renal cortex with homogeneous enhancement. Both ROIs were drawn on the reference frame (on the contrast-enhanced images) at approximately the same depth, avoiding blood vessels, artifacts and strong echogenecity of calcification and the renal capsule (Figs. 1D, 2D).
The quantitative parameters included: 1) maximum intensity (Imax), defined as the intensity at peak enhancement; 2) rise time (RT), defined as the time that the agent reaches the lesion, associated with the blood supply; 3) time to peak (TTP), defined as the time the lesions reach the Imax, related to the enhancement speed. The 2 time-related parameters, RT and TTP, show good stability at different depths, however, Imax varies with depth (9), hence the Imax of renal lesions are normalized by using tumor-to-cortex enhancement ratio (TOC ratio) (Imax of lesions/Imax of cortex) to ensure that the peak intensity is independent of technical or individual variability.
Statistical Analysis
Statistical analyses were performed using Statistical Package for the Social Sciences (SPSS) version 17.0 (SPSS Inc., Chicago, IL, USA). Continuous data were expressed as mean ± standard deviation. The χ2 test was used to compare enhancement pattern and peak enhancement homogeneity between 2 entities. An independent-sample t test was applied to compare the difference of quantitative parameters, including RT, TTP, and TOC ratio. The sensitivity and specificity of parameters that played a statistically significant role in differentiation were calculated and the cut-offs were calculated with the receiver operating characteristic curve. A two-tailed p value of < 0.05 was considered statistically significant.
RESULTS
Lesion Pathology
The maximal diameters of AMLs ranged from 1.8 cm to 7.5 cm (mean, 3.9 ± 2.0 cm) on histological examination, while the ccRCCs ranged from 1.0 cm to 6.5 cm (mean, 3.5 ± 1.9 cm). At pathologic examination, all the AML lesions contained ≤ 15% fat scattered throughout with no single fat focus > 5 mm, which was in accordance with the diagnosis of minimal fat AML. Five were epithelioid AMLs and 27 were conventional AMLs with predominantly epithelioid cells and spindle cells, respectively. Necrosis, hemorrhage or cystic change was detected in 108 (76.1%) of the 142 ccRCCs on histological examination, while in none of the AMLs.
Features with Conventional US and CEUS
All the lesions appeared as solid hypoechoic without any inner anechoic areas on conventional US (Figs. 1A, 2A). Twenty-seven of 32 (84.4%) AMLs and 102/142 (71.8%) ccRCCs were exophytic, while others were nonexophytic (p = 0.182).
All lesions were enhanced by contrast agent on CEUS. Comparison of CEUS enhancement features between AMLs and ccRCCs were summarized in Table 1. Centripetal enhancement pattern was significantly more common in AML cases than in ccRCC cases (Fig. 1B), while entire enhancement appeared in majority of ccRCC cases (p < 0.001) (Fig. 2B). At peak enhancement, all AMLs showed homogeneous enhancement (Fig. 1C), which was present in only 27.5% (39/142) ccRCCs (p < 0.001). Heterogeneous peak enhancement was more common in ccRCCs (72.5%, 103/142) (Fig. 2C).
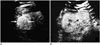
Pseudocapsule sign was detected in 38.0% (54/142) of ccRCCs and 15.6% (5/32) of AMLs (p = 0.041) (Fig. 3). AMLs with pseudocapsule sign were pathologically proven epithelioid AMLs.
Quantitative Analysis
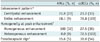
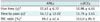
The comparison of quantitative parameters of CEUS between AMLs and ccRCCs was summarized in Table 2. The RT and TTP had no significant difference between AMLs and ccRCCs, while the TOC ratio was higher in ccRCCs than AMLs. With the criteria of TOC ratio < 91.0% as the cut-off points to differentiate AMLs from ccRCCs, the sensitivity and specificity were 78.0% and 83.4%, respectively.
With centripetal enhancement and homogeneous peak enhancement as the criteria to differentiate AML from ccRCC, the sensitivity and specificity were 71.9% and 83.1%, respectively. When combining them with TOC ratio < 91.0% as criteria to differentiate the 2 different renal tumors, the sensitivity and specificity were 68.9% and 95.8%, respectively.
DISCUSSION
According to the fat proportion, AML is divided into minimal fat AML and fat-rich AML (1); the former can cause a significant diagnostic dilemma due to similar hypoechogenicity as in ccRCC, on US (10). Much effort has been made thus far in distinguishing between minimal fat AML and ccRCC with different modalities, such as contrast-enhanced computed tomography (CECT) and magnetic resonance image (MRI). Though some imaging features are valuable in the diagnosis of minimal fat AML, such as homogeneous and prolonged enhancement on CECT (11), high T1-signal intensity ratio, low T2-signal intensity ratio and high arterial-to-delayed enhancement ratio on MRI (12), their application is limited by nephrotoxicity, high cost, and material implant. CEUS, is rarely used as a safe diagnostic modality to differentiate renal tumors, especially with quantitative analysis that is more objective, reliable and reproducible (13, 14, 15). We used both qualitative and quantitative analyses with CEUS to explore the features of hypoechoic/minimal fat AMLs.
Homogeneous enhancement at peak was one of the main CEUS features of AMLs, which corroborated our previous study (3). Moreover, CECT also demonstrated homogeneous contrast enhancement as a feature commonly seen in minimal fat AMLs (16). This is probably a result of the uniform solid component of these lesions, without displaying any hemorrhage, cystic change or necrosis. Heterogeneous enhancement was most commonly seen in ccRCCs, corresponding to the pathologically proven cystic change, necrosis or both; though all appeared as solid lesions on conventional US (17). However, ccRCC enhancement homogeneity was associated with tumor size (18). Small ccRCC may also show homogeneous enhancement without any intratumoral cystic change or necrosis on pathology, similar to that of AML. There is still a considerable overlap in the enhancement homogeneity. We observed that 71.9% of AMLs had centripetal enhancement, while 76.8% of ccRCCs had entire enhancement. While not a pathognomonic imaging feature of AMLs, this may be helpful in differentiation, though the enhancement pattern could not be explained in the current study and needs further examination with an emphasis on pathological structure. Dong et al. (19) reported that 17% (7/42) of ccRCCs showed this enhancement pattern. With centripetal enhancement and homogeneous peak enhancement as the criteria to differentiate AML from ccRCC, the sensitivity and specificity were 71.9% and 83.1%, respectively.
Generally, pseudocapsule is a useful sign in the differential diagnosis of ccRCC. It is a pathologic feature frequently seen in early-stage, low-grade ccRCC and is composed of fibrous tissue and compressed renal parenchyma (20, 21). However, pseudocapsule sign is also observed in renal AMLs according to previous studies (6, 8). Five of 32 AMLs demonstrated pseudocapsule sign and were all epithelioid AMLs. We assumed that the pseudocapsule sign in epithelioid AML may result from a similar growth pattern with low-grade ccRCC. This hypothesis needs to be further tested.
There are many discrepancies concerning the time of enhancement of different renal tumor subtypes. We visually observed that 83.3% (15/18) of minimal-fat renal AMLs showed late enhancement compared with renal cortex (vs. 12.4%, 13/105 in RCCs) in our previous study (3). Gerst et al. (20) reported that RT and TTP were much shorter in ccRCCs than in other subtypes of RCCs with CEUS. However, Xu et al. (6) found that there was no significant difference between the enhancement time of ccRCCs and renal AMLs (12.1 ± 3.0 seconds vs. 12.5 ± 3.3 seconds) and the percentages of lesions that showed early, simultaneous and late enhancement were 0.0%, 84.8%, and 15.2% for 33 renal AMLs and 2.2%, 84.9%, and 12.9% for 93 ccRCCs (p > 0.05). The differences may be partly explained by the different proportions of fat and vessels in AMLs between the different studies. However, CEUS interpretation is observer-dependent and subjective. Using software-based quantitative analysis to compare RT and TTP between minimal fat AMLs and ccRCCs, we found that there was no significant difference. Our results were convincing and reproducible.
Comparison of the enhancement degree in different subtypes of renal lesions has also been previously studied with different modalities. The results indicate that the degree of enhancement is the most valuable parameter for differentiation (22, 23). AML with atypical pattern on conventional US reportedly reveals intense contrast enhancement, while AML with typical pattern reveals low degree of contrast enhancement (24). Solid ccRCCs also have a higher degree of contrast enhancement than hypervascular AML with CECT (25). Thus in our study, the TOC ratio was significantly lower in AMLs than that in ccRCCs, which was in accordance with previous studies (24, 26). With the cutoff points of 91.0% to differentiate minimal fat AMLs from ccRCCs, the sensitivity and specificity were 78.0% and 83.4%, respectively. The rich vascular network and alveolar architecture on histology renders stronger enhancement of ccRCCs than AMLs (27). However, Xu et al. (6) found that during the cortical phase, there was no significant difference in the enhancement degree between AMLs and ccRCCs (p > 0.05). This result differed from ours, because 88.0% (29/33) AMLs in their study were hyperchoic AML in which the fat proportion was obvious, whereas, all AMLs in our study were minimal-fat hypoechoic. The hyperechogenicity of the lesion may have influenced the interpretation of the enhancement degree in Xu's study (6).
Our study had a few limitations. First, it had a potential selection bias. The qualitative and quantitative features of hypoechoic AMLs were compared only with ccRCCs, while the pRCCs and cRCCs were not included. The comparison between AMLs and these subtypes is required in future study. Second, the comparison between typical hyperechoic AMLs and hypoechoic AMLs and between epithelioid AML and conventional hypoehoic AML were not conducted because of the small number of epithelioid AML cases. Lastly, some time-related parameters reflecting washout features were not analyzed. Quantitative analysis needs qualified CEUS without out-of-plane images, however, it was difficult for patients to control their breathing for a long time, and the late phases of CEUS were incomplete.
In conclusion, centripetal enhancement and homogeneous peak enhancement were the main features of hypoechoic AMLs on CEUS, with lower enhancement degree than ccRCCs on quantitative analysis. These characteristics may be helpful in their differentiation and should be validated by further study.
 XML Download