

 PDF
PDF ePub
ePub Citation
 Print
Print


INTRODUCTION
Biliary atresia (BA) is a progressive fibro-obliterative process of the bile duct (1) that leads to early biliary cirrhosis. An early and accurate preoperative diagnosis of BA is required because the Kasai operation has been shown to be more successful when performed within 90 days of birth (2). Therefore, it is important to differentiate BA from other medically treatable causes of cholestatic jaundice. However, making a definitive diagnosis preoperatively is challenging owing to the considerable clinical, histopathologic, and radiologic overlap that exists between BA and other cause of cholestatic jaundice (1345).
Ultrasound (US) has been playing an important role in screening for infantile cholestasis. A number of US findings have been described as useful predictors of BA (46789101112). Atretic gallbladder (6) and triangular cord sign (4789) have been shown to be useful indicators with variable diagnostic performances. In addition, other US findings such as visualization of extrahepatic bile duct (11), diameter of the hepatic artery (12), and presence of hepatic subcapsular flow (1314) have been evaluated. However, in clinical situations, we usually make the US diagnosis of BA considering all of these findings rather than depending on a single US finding. Moreover, it is sometimes difficult to decide which US findings we should prioritize, especially in the conflicting cases. Therefore, a more staged approach using a decision-making tree-based on the assessments of priorities on the aforementioned US findings-is necessary for evaluating infants with cholestatic jaundice. Thus, a conditional inference tree analysis was adapted to generate a decision-making tree. Conditional inference trees, a predictive modeling approach, evaluate a regression relationship by binary recursive partitioning in a conditional inference framework. This statistics-based approach automatically selects the input variable with strongest association with the outcome and performs a binary split in the selected input variable. These two steps are recursively repeated, thereby creating a decision tree-a flow-chart -like structure-that predicts outcomes (15).
The present study aimed to assess the diagnostic value of various US findings and to establish a US decision-making tree model for the differential diagnosis of BA from other causes of cholestasis.
MATERIALS AND METHODS
Patients
Our Institutional Review Board approved the present study and waived the requirements for informed consent. This retrospective study was based on data collected from March 2008 to January 2014. US was performed in 171 consecutive neonates and infants with persistent jaundice. Seventy-one of the 171 patients were excluded from the study owing to unconjugated jaundice related to breast milk feeding or prematurity (n = 43), choledochal cyst (n = 4), and loss to follow-up (n = 24). Data on the total serum bilirubin (normal: 0.2-1.2 mg/dL), direct bilirubin (normal: 0-0.5 mg/dL), and γ-glutamyl transferase (normal: 8-35 IU/L) levels at the time of admission were obtained by reviewing medical charts. The diagnosis of BA was confirmed by means of Kasai surgery and the intraoperative cholangiographic findings, as well as histologic findings of the specimen that revealed the fibrotic obstruction of the extrahepatic biliary duct. The absence of BA was determined based on clinical improvement during the follow-up period (evidenced by clinical improvement of jaundice and normalization of laboratory results) (n = 46), pathologic findings of a liver biopsy specimen (n = 21), radioisotope biliary excretion scan (n = 25), normal intraoperative cholangiographic findings (showing a patent biliary system) (n = 3), or a genetic study (n = 6). Finally, 100 patients (male-to-female ratio, 51:49; mean age, 55 days; age range, 3-129 days) with or without diagnosed BA were enrolled in our study.
US Image Analysis
All 100 patients were scanned by one of the 3 pediatric radiologists (with 25, 16, and 10 years of experience with pediatric US, respectively) on an iU22 (Philips, Bothell, WA, USA) with 4-9 MHz convex and 5-12 MHz linear transducers, a Sequoia 512 (Acuson, Mountain View, CA, USA) with 2-6 MHz convex and 8-15 MHz linear transducers, or an Aplio XG (Toshiba, Tokyo, Japan) with 3.6-9.2 MHz convex and 8-14 MHz linear transducers. The patients were fasted for ≥ 4 hours before the examination and not sedated. The US findings were retrospectively reviewed in consensus by 2 radiologists (with 10 and 6 years of experience, respectively) at the picture archiving and communication system workstation (Maroview; Marotech, Seoul, Korea). High-frequency transducers (> 10 MHz) were used to evaluate the gallbladders. Gallbladder length was measured along the long axis. Gallbladder morphology was classified into two types (161718). Abnormal gallbladder was defined as follows: 1) nonvisualization of gallbladder; 2) gallbladder detected with atretic lumen and lumen length equal or less than 15 mm; 3) gallbladder detected with distended lumen and lumen length more than 15 mm but lack of complete mucosal lining or uneven echogenic outer wall thickness with irregular shape. Normal gallbladder was defined as follows: 1) gallbladder detected with fully distended lumen and lumen length more than 15 mm and smooth and complete mucosal lining with uniformly thin wall; or 2) gallbladder detected with collapsed or partially filled lumen but smooth and complete mucosal lining and uniformly thickened wall seen as a hypoechoic layer between the inner and outer walls. Triangular cord was defined as a thick tubular or triangular echogenic density along the anterior aspect of the portal vein (9). The thickness of the triangular cord was measured at the porta hepatis on the oblique longitudinal or transverse scans. The diameter of the hepatic artery was measured at the level of the right proximal hepatic artery, which runs parallel to the right portal vein, and the diameter of the portal vein was measured at the right proximal portal vein, just proximal to the division of the anterior and posterior branches. The measurement was made by using an electronic caliper from the mid-portion of the anterior wall to the mid-portion of the posterior wall of the hepatic artery and portal vein. Moreover, we also assessed whether the common bile duct (CBD) was visible. When required, color Doppler scan was used to help identify the CBD. Hepatic subcapsular flow was not included in the US image analysis because it was not evaluated in most of our cases.
Statistical Analysis
The t test was used to compare the age and laboratory findings between the BA and non-BA groups. The Pearson's χ2 test was used to compare the male-to-female ratios between the two groups. Receiver operating characteristic (ROC) curves were constructed to evaluate the diagnostic performance of the laboratory findings. Univariate logistic regression analysis was performed to identify the US findings that could predict BA. Multivariate logistic regression analysis using the backward elimination method was subsequently performed to identify the significant independent predictors of BA. The significant US findings with a p value of < 0.1 in the univariate analysis were included in the multivariate analysis. A p value of < 0.05 was considered statistically significant, and the data analyses were performed with commercially available statistical software (SPSS, version 12; SPSS Inc., Chicago, IL, USA). Conditional inference tree analysis was performed to determine the US findings with the strongest associations with BA and to generate a decision-making tree for classifying patients into the BA or non-BA groups using the statistical software package R (R for Windows, version 2.10.0; R development Core Team, Vienna, Austria, http://www.R-project.org) (Appendix E1 in the online-only Data Supplement for further description of the conditional inference tree analysis).
RESULTS
Clinical Findings
Biliary atresia was surgically confirmed in 46 patients (mean age, 60 days; range, 11-124 days; male-to-female ratio, 21:25). The remaining 54 patients (mean age, 51 days; range, 3-129 days; male-to-female ratio, 30:24) were assigned to the non-BA group: idiopathic neonatal hepatitis (n = 38), progressive familial intrahepatic cholestasis (PFIC) (n = 4), total parenteral nutrition associated cholestasis (n = 3), Alagille syndrome (n = 4), cytomegalovirus hepatitis (n = 2), fetal alcoholic syndrome (n = 1) and neonatal intrahepatic cholestasis caused by citrin deficiency (NICCD) (n = 2). Neonatal hepatitis was confirmed with clinical improvement (n = 31) or percutaneous needle biopsy (n = 7). PFIC was confirmed with ABCB11 mutation (n = 1) or immunohistochemical staining and electron microscopy of liver specimen (n = 3). Alagille syndrome was confirmed with clinical criteria and percutaneous liver biopsy (n = 1) or mutation in the JAG 1 gene (n = 3). NICCD was confirmed with mutation in the SLC25A13 gene.
Clinical characteristics between the BA and non-BA groups showed no significant differences in age (p = 0.106), male-to-female ratio (p = 0.323), or total serum bilirubin between the groups (p = 0.193); however, a statistically significant difference was observed in the direct bilirubin levels (p = 0.028), and γ-glutamyl transferase levels (p < 0.001) (Table 1). According to ROC curve analysis, the optimal cutoff values of direct bilirubin and γ-glutamyl transferase levels were 5 mg/dL and 200 IU/L, respectively. Area under the ROC curve, sensitivity, specificity, positive predictive value, and negative predictive value of direct bilirubin and γ-glutamyl transferase levels in the identification of BA are listed in Table 2.
Analysis of the US Imaging
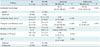
In the univariate analysis, BA was significantly associated with the following US findings: abnormal gallbladder morphology (p < 0.001), shorter gallbladder length (p < 0.001), higher triangular cord thickness (p < 0.001), greater hepatic artery diameter (p < 0.001), greater portal vein diameter (p = 0.012), and non-visualization of the CBD (p = 0.001). The multivariate logistic analysis showed that abnormal gallbladder morphology (odds ratio = 345.63, p = 0.003) and greater triangular cord thickness (odds ratio = 65.64, p = 0.001) were the only 2 findings that were independently associated with BA. The summary of the US findings in the BA and non-BA groups and the results of the logistic regression analysis to identify predictors of BA are presented in Table 3.
Conditional Inference Tree Analysis
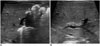
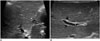
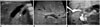
In the conditional inference tree analysis, the two US findings (gallbladder morphology and triangular cord thickness) were identified as significant predictors of the presence or absence of BA (p < 0.001) (Fig. 1). The first split of the tree was made according to the gallbladder morphology. Abnormal gallbladder morphology-regardless of triangular cord thickness-led to node 5, which had 39 (92.9%) patients with BA and 3 (7.1%) patients without BA (Figs. 2, 3). In the other branch, which showed normal gallbladder morphology, the next division was based on the triangular cord thickness. The optimal cutoff value of triangular cord thickness for a diagnosis of BA was automatically selected as 3.4 mm by the statistical method. Normal gallbladder morphology with triangular cord thickness > 3.4 mm led to node 4. All 7 cases in node 4 had BA (Fig. 4). The remaining 51 cases with normal gallbladder morphology and triangular cord thickness ≤ 3.4 mm reached node 3, in which no patients had BA.
Diagnostic Performance of US Findings
When these criteria-abnormal gallbladder morphology regardless of triangular cord thickness (node 5) or triangular cord thickness > 3.4 mm despite normal gallbladder morphology (node 4)-were applied according to the results of the conditional inference tree in the diagnosis of BA, the following results were obtained: a sensitivity of 100% (46 of 46), a specificity of 94.4% (51 of 54), a positive predictive value of 93.9% (46 of 49), a negative predictive value of 100% (51 of 51), and an overall accuracy of 97% (97 of 100). There were no false-negatives and 3 false-positive cases. These 3 patients showed abnormal gallbladder morphology and were assigned to node 5, one patient with Alagille syndrome and 2 patients with neonatal hepatitis. They had triangular cord thickness < 3.4 mm (range, 1.9-3.2 mm) (Fig. 3). Meanwhile, of the 39 BA patients with abnormal gallbladder morphology (node 5), 29 patients (74%) had triangular cord thickness > 3.4 mm.
Among the 7 BA patients with normal gallbladder morphology and triangular cord thickness > 3.4 mm in node 4, 5 patients were found to have the morphologic type IIIa-in which the hepatic ducts are obliterated and the cystic duct and CBD are patent-whereas the other 2 patients were found to have type IIIb, in which the CBD is fibrotic (Fig. 4) (19).
DISCUSSION
In this study, the diagnostic value of various US findings was evaluated. Although many US features showed a significant association with BA in the univariate analysis, only 2 findings-abnormal gallbladder morphology and greater triangular cord thickness-were selected as independent predictors of BA in the multivariate analysis. Moreover, the conditional inference tree analysis selected these 2 findings as discriminators.
Similar to previous reports (61718), our results showed that abnormal gallbladder morphology was the most significant predictor of BA in the multivariate and conditional inference tree analyses. Abnormal gallbladder morphology alone had been shown to have a sensitivity, specificity, and accuracy of 84.8% (39/46), 94.4% (51/54), and 90% (90/100), respectively, in the diagnosis of BA. However, abnormal gallbladder morphology may be seen in patients without BA but with severe intrahepatic cholestasis (2021). In the present study, abnormal gallbladder morphology was seen in 1 patient who was diagnosed with Alagille syndrome and 2 patients with neonatal hepatitis. Moreover, 7 patients with BA (15%, type IIIa, n = 5; type IIIb, n = 2) had normal gallbladder morphology (node 4). A number of studies have reported that normal morphology and gallbladder length have been seen in patients with type IIIa, in which gallbladder and distal CBD appear to be less affected by the atretic process (10222324), or even IIIb BA (222425). BA is a dynamic process that leads to the obliteration of the bile ducts with progression of the US findings (346924). Therefore, a normal gallbladder may be seen even in patients with type IIIb BA, in which the CBD is fibrotic.
The triangular cord sign has been reported to be a highly specific finding for the diagnosis of BA in many studies (467891213222325262728). However, variable sensitivities for this sign have been reported (range, 23-93%). A number of studies have used a triangular cord thickness of 4 mm as the objective criterion for triangular cord sign in BA (7121328), whereas other studies have used 3 mm (2225). In the present study, 3.4 mm for the triangular cord thickness was selected as a cutoff value for the triangular cord sign in the conditional inference tree analysis. The positive triangular cord sign (triangular cord thickness > 3.4 mm) alone resulted in a sensitivity of 78.2% (36/46), a specificity of 100% (54/54), and a diagnostic accuracy of 90% (90/100). Lee et al. (7) proposed that identifying the triangular cord sign using US relies on the pattern and size of the fibrous ductal remnant in the porta hepatis and that false negative results can occur in BA cases with relatively thin fibrous masses in the porta hepatis. Other studies have mentioned that the triangular cord sign may be inconspicuous in the early stage of some BA cases and may evolve with age (49232428). Therefore, we concluded that the absence of the triangular cord sign cannot exclude the possibility of BA and that the presence of other predictive US findings-such as abnormal gallbladder morphology-should be more carefully evaluated.
Regarding visualization of the CBD, our data showed no statistical significance, even though Humphrey and Stringer (27) reported a high diagnostic value of CBD visibility. We believe that we found no significance because of the limited reliability of this finding in our study because no patients were sedated during their US examinations. Furthermore, as mentioned by Azuma et al. (11), subtype <a> (BA with a patent CBD) in the morphologic BA classification system (19) can result in a false-negative finding. In the present study, CBD was visible in 3 patients with BA (7%), and these infants were found at surgery to have fibrotic ducts without patent CBD. Therefore, we postulate that CBD can be visible on high-resolution US in subtype <b> as well as in subtype <a>.
Hepatic subcapsular flow, which was not evaluated in the present study, has been reported to be highly sensitive for the diagnosis of BA (1314). Lee et al. (13) reported that hepatic subcapsular flow on color Doppler US images had sensitivity and specificity of 100% and 86%, respectively, and subcapsular telangiectasia was revealed in all patients with BA. Those authors postulated that hepatic arteriopathy in BA might be related to hepatic fibrosis, and this concept is supported by El-Guindi et al. (14); hepatic subcapsular flow had both sensitivity and specificity of 96.3% and grade of fibrosis in liver biopsies was significantly different between the BA and non-BA groups. However, hepatic subcapsular flow was not assessed in most of our cases, for which US had been performed before this sign became generally known.
For the above-mentioned reasons, the diagnosis of BA cannot be made solely by a single US finding. In this context, we attempted to develop a decision-making tree model. The model had very high sensitivity (100%, 46 of 46) and acceptable specificity (94.4%, 51 of 54). We believe that the high sensitivity in this model is important because not missing patients with BA is more important considering poor prognosis associated with a delayed diagnosis.
As mentioned above, US is useful for excluding BA, but it is limited by the operator's experience. The feasibility of MR cholangiography has been studied for reliable diagnosis of BA. However, the diagnostic value of MR cholangiography for BA, in particular specificity, is still under debate (sensitivity, 90-100%; specificity, 36-96%; diagnostic accuracy, 71-98%) (293031). We think that MR cholangiography can play a role in supplementary screening because of its high sensitivity when the utility of US is limited.
There were a number of limitations in the present study. First, the study was based on retrospective data collection. Second, gallbladder morphology was subjectively assessed; that is, the interpretation of the US findings might have depended on the operator's experience. Third, the small (submillimeters) sizes of the structures, such as the triangular cord thickness, hepatic artery, and CBD, could have resulted in measurement errors. Fourth, CBD detection had limited reliability based on the patients' cooperation because the infants were not sedated during the US examinations, as mentioned above. Fifth, another important sign of hepatic subcapsular flow was not evaluated in most of our cases because this sign had been reported only recently.
In conclusion, the present study revealed that abnormal gallbladder morphology and greater triangular cord thickness (> 3.4 mm) were the most significant predictors of BA on US. If patients show normal gallbladder morphology and triangular cord thickness ≤ 3.4 mm, the possibility of BA could be safely excluded. We suggest that gallbladder morphology should be evaluated first and then triangular cord thickness in cases with normal-looking gallbladders. Following the conditional inference tree model, 97 of the 100 patients were correctly classified into the BA or non-BA groups. This decision tree could enable a more staged approach in clinical practice for the diagnosis of BA using US.


 XML Download