

 PDF
PDF ePub
ePub Citation
 Print
Print


INTRODUCTION
Cervical spondylotic myelopathy (CSM) is the most common spinal cord disorder in patients older than 55 years (1). Although CSM is diagnosed primarily based on clinical manifestations, magnetic resonance imaging (MRI) has been a useful diagnostic tool with which CSM can be detected as increased signal intensity on T2-weighted images (T2WI). However, this finding is not seen in every patient with clinical signs of CSM (2345). Additionally, tolerance for a compressed spinal cord may vary among patients (6); hence, MRI findings can be confusing owing to the frequent disconnect between the degree of central canal stenosis and clinical symptoms (789).
Thus, another MRI approach using diffusion tensor imaging (DTI) has been proposed to assess CSM (1011121314151617181920). The DTI parameters that have been investigated for assessing CSM are mean diffusivity (MD), longitudinal diffusivity (LD), radial diffusivity (RD), and fractional anisotropy (FA). Previous studies have reported that MD values increase and FA values decrease in the compressed cord (11151618). Additionally, LD (corresponding to the largest eigenvalue) and RD (corresponding to the average of the two smallest eigenvalues) are believed to reflect the degree of damage to axons and myelin, respectively (21222324). The available evidence suggests that a diminished FA value is a more sensitive measure of a cord injury than hyperintensity depicted on T2WI (25) because there are patients whose spinal cords are sufficiently compressed to cause CSM but do not show definite signal changes on conventional MRI. However, no study has been conducted to assess the performance of DTI parameters and their combinations in determining the presence of CSM in a patient group with deformed spinal cords but with no signal changes on conventional MRI. These patients would not be confidently interpreted as having CSM based on conventional MRI (526). Therefore, under the hypothesis that DTI would be beneficial for this purpose, we intended to assess the diagnostic performance of DTI parameters and their combinations in diagnosing CSM in patients showing spinal cord compression but lacking a signal change on conventional MRI.
MATERIALS AND METHODS
Patients
The Institutional Review Board approved this orgretrospective study based on the HIPAA standard, and written informed consent was waived. Nevertheless, all patients signed informed consent forms as part of their visits to this research hospital. After signing comprehensive informed consent forms for this study, 76 consecutive patients who underwent cervical spine MRI using conventional and diffusion-weighted sequences to assess cervical spondylosis were recruited as study subjects from February 2013 to September 2014. The exclusion criteria were: 1) prior cervical spine surgery (n = 6), and/or 2) absence of accurate medical records on the presence of CSM (n = 3), and/or 3) cases in which the most stenotic level was observed at two or more spinal levels based on the criteria stated below (n = 3). Ultimately, 64 patients (36 males and 28 females; mean age, 53.6 ± 12.8 years; range, 25-80 years) were included.
Patients with at least one CSM symptom and at least two physical examinations for CSM were considered to have CSM (27). The CSM symptoms included gait disturbance, lower extremity weakness, and bladder/bowel impairment. The CSM physical examinations included evaluations of spastic gait, the finger-escape sign, the grip-and-release test, and the Hoffmann and Babinski signs.
MRI Protocol
Imaging was performed on a 1.5T MR scanner (MAGNETOM Avanto, Siemens Healthcare, Erlangen, Germany). Conventional MRI pulse sequences included sagittal T2-, sagittal T1-, and axial T2-weighted fast spin-echo (FSE) sequences. The parameters for sagittal T2-weighted FSE imaging were as follows: repetition time (TR) = 4000 ms, echo time (TE) = 106 ms, receiver bandwidth = 150 Hz/pixel, echo train length = 17, flip angle = 17°, number of slices = 17, section thickness = 3 mm, imaging matrix = 358 × 512, and field of view = 500 × 500 mm. Additionally, DTI was performed in the sagittal plane using two-dimensional (2D) single-shot interleaved multi-section inner volume diffusion-weighted echo-planar imaging (ss-IMIV-DWEPI) (28). The 2D ss-IMIV-DWEPI sequence allows for effective interleaved multi-section DTI with less susceptibility to magnetic distortion, which improves image quality by restricting the field of view (14). The 2D ss-IMIV-DWEPI imaging parameters were: TR = 3200 ms, TE = 74 ms, imaging matrix = 128 × 40, voxel size = 1.5 × 1.5 × 2.0 mm3, section thickness = 2 mm, b value = 0, 500 s/mm2, echo train length = 20, receiver bandwidth = 1562 Hz/pixel, and number of interleaved sections = 10. Diffusion-weighted gradients were applied in 12 noncollinear directions. The total scanning time for the DTI acquisition was 5 minutes 36 seconds.
Image and Data Analysis
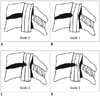
The degree of central canal stenosis on conventional sagittal T2WI MRI was graded by a musculoskeletal radiologist with 23 years of experience in spinal imaging interpretation based on the following criteria proposed by Kang et al. (29): grade 0, normal; grade 1, obliteration of > 50% of the subarachnoid space with no sign of cord deformity; grade 2, central canal stenosis with a spinal cord deformity but without a spinal cord signal change; and grade 3, spinal cord hyperintensity at the compressed level (Fig. 1). Only grade 3 is generally regarded as CSM on MRI in clinical practice (26). The most stenotic level and the grade were recorded for all patients. The most stenotic level was also recorded for patients in whom all levels were grade 0. To designate the most stenotic level for patients with grades of 0, two musculoskeletal radiologists (with 23 and 6 years of experience in spinal imaging interpretation, respectively) reviewed images in consensus during a separate review session after comprehensively assessing the obliteration of the subarachnoid space and the thickness of the ligamentum flavum. The number of patients with each grade, the sex composition and mean age ± standard deviation were recorded.
The acquired DTI dataset was processed pixel by pixel using custom-made DTI processing software written in Interactive Data Language ver. 8.3 (ITT Visual Information Solutions, Boulder, CO, USA). First, three eigenvalues (λ1, λ2, and λ3) and the eigenvectors were calculated. Longitudinal diffusivity and RD were defined in equations from the directional diffusivity values obtained:
LD = λ1
RD = (λ2 + λ3) / 2
Mean diffusivity was calculated as:
MD = (λ1 + λ2 + λ3) / 3 = (ADCx + ADCy + ADCz) / 3
The MD value was considered analogous to the apparent diffusion coefficient (ADC) value (30).
The degree of anisotropy was determined by FA (31),
which was calculated with the following equation:

Fractional anisotropy values from 0 (completely isotropic) to 1 (completely anisotropic) indicate the degree of structural anisotropy (14).
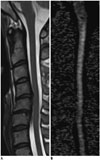
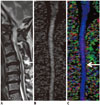
Pixel-based FA map images and principal eigenvector red-green-blue map images were produced automatically by the software. Blue coloring represents the principal eigenvector aligned in the head-foot direction. The MD, LD, RD, and FA values were measured at the most stenotic level, which was recorded in the stenosis grading session described above in the following manner: oval regions of interest (ROIs) as large as possible were drawn on the FA map images twice in consensus by a third-year resident trainee and a musculoskeletal radiologist with 11 years of experience with spinal imaging interpretation, using the customized program described above (Fig. 2). ROIs (mean, 29.71 ± 0.67 mm2; range, 28.69-30.78 mm2) with their mean area ± standard deviations (SDs) were drawn on the FA map, excluding regions outside of the spinal cord, such as adjacent anatomical structures, and cord morphology was compared with that of the T2WI reference. FA values and eigenvalues were presented automatically for each ROI in the software. FA, LD (× 10-3 mm2/sec), and RD (× 10-3 mm2/sec) values were recorded as presented. MD (× 10-3 mm2/sec) values were calculated using the eigenvalues with the aforementioned equation.
Statistical Analysis
All continuous values are presented as mean ± SDs with ranges. Spearman's rank correlation coefficient analysis was used to assess the correlations between the DTI parameters and the degree of stenosis using a conventional MRI grading system. Student's t test was used to compare the spinal cord DTI parameter values between patients with and without CSM. Furthermore, to assess the CSM diagnostic performance in the subgroup of patients who showed spinal cord compression without signal changes on T2WI, we obtained the cut-off value by performing receiver operating characteristic (ROC) curve analysis of the DTI parameters using the maximum value of the Youden index to evaluate how many patients in this category could be correctly diagnosed. The sensitivity, specificity, positive predictive value (PPV), and negative predictive value (NPV) were calculated for MD and FA based on the ideal cut-off values obtained from the ROC curve analysis. We additionally adopted parameter combinations of MD∩FA, LD∩FA, and RD∩FA to determine whether the overall diagnostic performance of FA would increase when FA was combined with a non-directional parameter of MD or the directional eigenvalues of LD and RD, which are components of the FA calculation. MD∩FA, LD∩FA, and RD∩FA were considered positive when both the MD and FA, both the LD and FA, and both the RD and FA results were positive respectively based on the ideal cut-off values for FA, MD, LD, and RD. The sensitivity, specificity, PPV, and NPV of MD∩FA, LD∩FA and RD∩FA were also obtained. SPSS ver. 20.0 (SPSS Inc., Chicago, IL, USA) was used for the statistical analyses, including Student's t test, Spearman's rank correlation and ROC curve analyses. The sensitivity, specificity, PPV, and NPV were compared among MD, FA, MD∩FA, LD∩FA, and RD∩FA using multiple-comparison and post-hoc analyses with least square means. The multiple comparisons with least square means were performed using SAS ver. 9.2 (SAS Institute, Cary, NC, USA). P values < 0.05 were considered significant.
RESULTS
Among the 64 patients who were enrolled (36 males and 28 females; mean age, 53.6 ± 12.8 years; range, 25-80 years), 14 had CSM according to their symptoms and physical examinations. The most stenotic levels were C3-4 in seven patients, C4-5 in 21 patients, C5-6 in 24 patients, and C6-7 in 12 patients on sagittal T2WI.
Based on the conventional MRI grading criteria, the degree of central canal stenosis was designated as grade 0 in four patients (one male and three females; mean age, 40 ± 15.1 years; range, 25-54 years), grade 1 in 16 patients (eight males and eight females; mean age, 49.8 ± 11.5 years; range, 38-74 years), grade 2 in 33 patients (16 males and 17 females; mean age, 56.5 ± 13.5 years; range, 34-80 years), and grade 3 in 11 patients (11 males; mean age, 55.4 ± 7.5 years; range, 43-70 years).
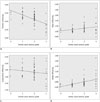
In the correlation assessment between the DTI parameters and the degree of stenosis, the FA values were negatively correlated with the degree of central canal stenosis (rho = -0.545, p < 0.001). RD was positively correlated with the degree of central canal stenosis (rho = 0.399, p < 0.001). However, MD (rho = 0.156, p < 0.217) and LD (rho = -0.149, p < 0.238) were not significantly correlated with the degree of central canal stenosis (Fig. 3).
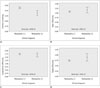
Mean FA values differed significantly (p < 0.001) between patients with CSM (0.36 ± 0.08; range, 0.23-0.50) and those without it (0.46 ± 0.06; range, 0.30-0.57). The mean MD, LD, and RD values in patients with CSM were 1.16 ± 0.27 (range, 0.79-1.85), 1.68 ± 0.26 (range, 1.23-2.15), and 0.90 ± 0.30 (range, 0.56-1.70), respectively, in units of 10-3 mm2/sec. The mean MD, LD, and RD values in patients without CSM were 1.09 ± 0.12 (range, 0.93-1.53), 1.76 ± 0.19 (range, 1.32-2.17), and 0.74 ± 0.12 (range, 0.60-1.26), respectively, in units of 10-3 mm2/sec. No differences were observed among mean MD (p = 0.318), LD (p = 0.227), and RD (p = 0.082) values between patients with and without CSM (Fig. 4).
Thirty-three patients who showed compressed spinal cords without signal changes on T2WI were included in a subgroup to assess the diagnostic performance of the DTI parameters and their combinations. Among them, four patients had CSM (Fig. 5), and the remaining 29 patients did not. The ideal MD, LD, RD, and FA cut-off values in this subgroup were: > 1.079 × 10⁻³ mm2/sec, > 1.719 × 10⁻³ mm2/sec, > 0.749 × 10⁻³ mm2/sec and ≤ 0.475, respectively. The sensitivity, specificity, PPV, and NPV of MD, FA, MD∩FA, LD∩FA, and RD∩FA are summarized in Table 1. Specificity was significantly different (p < 0.001) among the DTI parameters and their combinations in multiple comparisons, indicating that at least one of the comparisons was significant, whereas sensitivity (p = 0.317), PPV (p = 0.328), and NPV (p = 0.210) were not significantly different. Significant differences were observed between FA and MD∩FA (p = 0.003), FA and LD∩FA (p < 0.001), FA and RD∩FA (p < 0.001), MD and LD∩FA (p = 0.024), and MD and RD∩FA (p = 0.024) in a post-hoc analysis of specificity between the parameters and their combinations. No significant differences were observed in the other comparisons.
DISCUSSION
Our study focused on the diagnostic performance of DTI parameters in clinically distinguishing between patients with and without CSM in a subgroup of patients who showed compressed spinal cords but no definite signal changes on conventional MRI. We were inspired by studies in which the ADC and FA values of patients without spinal cord signal changes on conventional MRI differed between CSM and non-CSM groups (121316). Although four studies have reported the variable performance of DTI parameters in distinguishing among various symptom groups that were different from those in our study, no study has used an approach similar to ours (101118). Among these studies, two used the sagittal plane for DTI (1011). One of the studies differed from ours in that the investigators enrolled patients with central canal stenosis observed on radiography, computed tomography, or MRI (10). In another study that used sagittal DTI, the sensitivity and specificity were 76.3% and 100% in FA and 13.4% and 80% in ADC, respectively, in distinguishing between symptomatic and asymptomatic patients (11). The remaining two studies used DTI in the axial rather than the sagittal planes (1820). One of the two studies that used DTI in the axial planes assessed the performance of DTI parameters other than FA and MD. The sensitivity and specificity for the mean FA values measured at the most severely compressed levels were 72% and 75% in distinguishing between symptomatic and asymptomatic patients in this study. Although the study also assessed RD performance, the sensitivity and specificity of RD were not reported (20). In all of the aforementioned studies, the investigators included patients with spinal cord signal changes on conventional MRI, or they were uncertain whether the patient group included such patients. Additionally, LD and RD were not considered in the assessment of DTI performance. Although direct sensitivity and specificity comparisons of these studies with ours would be difficult because of the differences stated above, the FA and MD (which was considered as ADC) values in our study showed relatively higher sensitivity than did those of previous investigations. However, the specificities in our study were lower than those in previous studies. We speculate that the lower FA and MD specificity could be attributed to the subgroup we used to assess diagnostic performance, which did not include patients with spinal cord signal changes on conventional MRI. In contrast, when we combined the FA results with those of MD, LD, and RD, the specificity was comparable with those of the previous studies. Among the parameter combinations, LD∩FA showed the best specificity and the best sensitivity, but no significant difference in specificity was detected among the combinations MD∩FA, LD∩FA, and RD∩FA. However, we believe that the combination of MD, LD, or RD with FA would enhance the specificity of FA in patients with spinal cord compression that is not associated with signal changes on conventional MRI based on our data. Although the reason that the combination of FA with the aforementioned parameters showed enhanced specificity compared with FA and MD alone needs to be assessed further with a histological correlation using an animal model, we assume that the specificity might increase if parameters were combined; for instance, the combination of MD and FA might increase the diagnostic performance by combining information from non-directional and directional parameters. Additionally, we assume that enhanced specificities of LD∩FA, and RD∩FA compared with that of FA, which is a scaled representation of LD and RD (14), might be attributable to the consideration of diffusivity in the directions both longitudinal (LD) and perpendicular (RD) to the spinal cord. A small number of recent investigations partly supported our assumption by addressing various changes in the LD and RD in spinal cord with CSM resulting in comprehensive changes in FA (1419).
In the present study, the FA values were negatively correlated, and the RD values were positively correlated with the degree of central canal stenosis assessed at the most stenotic levels. We speculate that injury to a compressed cord in its directionally oriented axonal structures and myelin likely leads to a relative increase in water diffusion perpendicular to its long axis compared with that in an intact spinal cord. A diminished spinal cord FA value may reflect loss of directionally oriented membrane structures, increased extracellular edema, or both (25). An experimental rat spinal cord study demonstrated that mechanical disruption, tearing of fibers and myelin sheaths, Wallerian degeneration, and demyelination diminish FA values (32). Previous studies using the brains and optic nerves of mice demonstrated that demyelination increases RD (2122). Although one study revealed a correlation between ADC (MD in our study) and diffusivity on conventional MRI or patient symptomatology (19), no significant correlation of MD and LD with the degree of stenosis was found. One explanation could be the greater inter-individual variability in MD, which is partly affected by age. Another study reported a negative correlation between age and MD values, but the association between age and FA (p = 0.234) was insignificant (33). Our study included a wide age range of patients (25-80 years). The LD value (corresponding to the largest eigenvalue) is the most critical factor for MD, which represents the mean of three eigenvalues (20). Therefore, LD is expected to have large inter-individual variability.
The mean FA value in patients with CSM was significantly lower than that in patients without it, in agreement with previous studies (14151617). However, in our study, the mean MD, LD, and RD values in patients with CSM did not differ from those in patients without it, suggesting that there is large inter-individual variability depending on the age of the patient. Reduced FA values are not always consistent with elevated MD values given that FA values decrease but MD values may not increase when there are damaged fibers in the neural tissue if the damage is stabilized by gliosis in the surrounding tissue (343536).
A number of limitations need to be addressed in our study. First, the ROI that was used covered the entire spinal cord and did not distinguish white matter from gray matter because differentiating between them on sagittal plane images is difficult, particularly when the spinal cord is compressed, and this may have caused some bias. Van Hecke et al. (37) performed a thresholding procedure (FA = 0.2) to distinguish white matter from gray matter on axial plane images. However, the procedure caused a loss of information about severely degenerated white matter (15). After we balanced the advantages and disadvantages of different approaches, we used sagittal plane images to define a ROI that covered the entire spinal cord and focused on excluding the cerebrospinal fluid space as much as possible. Second, although many conditions, including cystic necrosis, syrinx, myelomalacia, and atrophy of a compressed spinal cord have been speculated to influence DTI values (3839), the exact causes for changes in each DTI parameter remain unclear because a pathological correlation was not possible in our study. Third, the 100% sensitivity of the parameters and parameter combinations can be attributed to the small number of subjects, particularly given that only four patients had symptom of CSM without signal changes on T2WI. Therefore, we believe that further study should be conducted with a larger number of patients than those in our study. Finally, we could not evaluate the correlation between patient symptom severity and DTI parameters because of the limited medical records that were available as a result of the retrospective nature of this study.
In conclusion, spinal cord FA values were negatively correlated with the degree of central canal stenosis, whereas RD was positively correlated with the same degree. FA values were statistically significantly reduced in clinically diagnosed CSM patients. Among the DTI parameters and their combinations, FA combined with MD, RD, or LD is expected to be more useful than FA and MD alone for identifying patients with CSM among patients who show spinal cord compression but otherwise unremarkable conventional MRI findings, although further validation is needed with a larger study group.
 XML Download