

 PDF
PDF ePub
ePub Citation
 Print
Print


INTRODUCTION
With the continued publication of primary scientific research studies and the recognition of their importance, the value of systematic reviews and meta-analyses for summarizing results is also being increasingly acknowledged. According to the Cochrane Collaboration, a systematic review uses systematic methods to identify, select, and critically appraise relevant research and to analyze data from the primary studies included in the review (1). As a research synthesis methodology, systematic review can evaluate a body of evidence in the literature both qualitatively and quantitatively. A meta-analysis is part of the systematic review and uses statistical methods to integrate the results of multiple primary research studies (2). The use of systematic reviews and meta-analyses in combination is also increasing in the field of diagnostic test accuracy (DTA), with three main objectives: 1) to obtain more valid, generalizable summary estimates of the diagnostic accuracy of a test; 2) to identify and provide information on factors (covariates) that affect a test's diagnostic accuracy; and 3) to identify areas for further research. These objectives may relate to a single test or to a comparison of multiple tests (3).
The successful conduct of a systematic review and meta-analysis requires a sound understanding of the process and methodologies involved (2). Part I of this two-part article is intended to provide a practical guide as well as tips regarding how to conduct, report, and critically appraise studies of DTA for clinical practitioners and researchers who read and plan to conduct a systematic review. In reviewing the overall process for the systematic review and meta-analysis methodology of DTA studies, we will focus on conceptual explanations and practical issues and avoid the extensive use of statistical or mathematical theories or formulas. Our goal is to present the most current concepts and methodological suggestions on this topic (14). Part II (to be published separately) will present a conceptual review of the statistical methods currently recommended for meta-analyses of DTA studies (5).
Go to : 
Overall Process
The systematic review process has been developed to minimize bias and ensure transparency when one is collecting and summarizing information found in the literature. Several guidelines and checklists are available for conducting a qualified systematic review and meta-analysis, such as the Quality of Reporting of Meta-Analyses (QUOROM) statement for clinical trials (6), the Meta-analysis of Observational Studies in Epidemiology statement for observational studies (7), the Preferred Reporting Items of Systematic Reviews and Meta-Analyses (PRISMA) for general purposes (8), the Assessing the Methodological Quality of Systematic Reviews tool for assessing the quality of systematic reviews (9), and the Cochrane Handbook for Diagnostic Test Accuracy Reviews published by the Cochrane Collaboration (1). The key processes of a systematic review and meta-analysis can be broken down into six steps, which are described in detail below and summarized in Table 1.
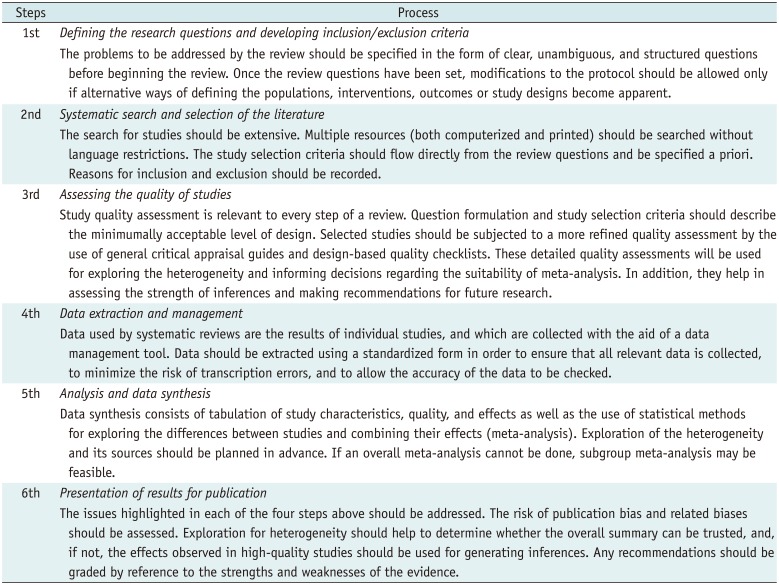
Table 1
Six Steps for Systematic Review and Meta-Analysis
![]()
Systematic reviews should be carried out according to a predefined protocol. This protocol should include the rationale for the systematic review, key questions based on a structured framework known as PICO (patient or population/intervention/comparator/outcomes) or PICOS (PICO + study design), inclusion/exclusion criteria, the method of literature searches employed for published/unpublished literature, data abstraction/data management, assessment of the methodological quality of individual studies, data synthesis, and grading the evidence for each key question. In addition, these processes should be adequately documented so that they can be replicated.
Step 1: Defining Research Questions and Developing Inclusion/Exclusion Criteria
Defining Research Questions
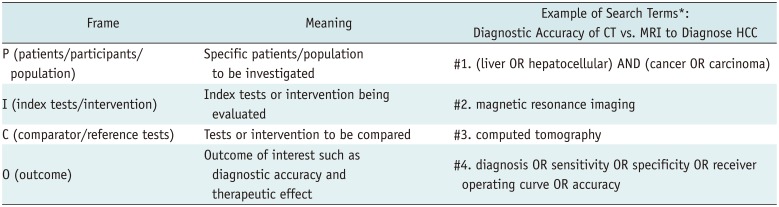
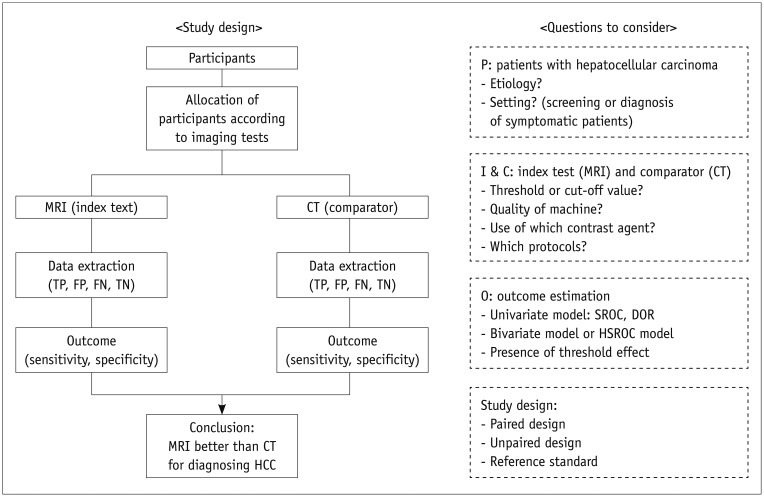
Clarifying the key research questions for the systematic review is the most important step in the entire review process. Each question should be clinically meaningful and based on a solid rationale and background. It is highly recommended that the questions be framed according to a structured framework (the so-called PICO format) (Table 2). For example, as illustrated in a recent study (7), if we want to explore whether or not magnetic resonance imaging (MRI) is superior to computed tomography (CT) for diagnosing hepatocellular carcinoma (HCC), we can frame the question within a structured form, as shown in Figure 1.
 | Fig. 1Diagram of study process and frame of research questions.DOR = diagnostic odds ratio, FN = false negative, FP = false positive, HCC = hepatocellular carcinoma, HSROC = hierarchical summary receiver operating characteristic, SROC = summary receiver operating characteristic, TN = true negative, TP = true positive
|
Table 2
PICO Format Structured Research Question
![]()
In the systematic review and meta-analysis of DTA studies in which the diagnostic performance of an index test is evaluated against a reference standard for the disease of interest, it should be clearly stated that the index test is being evaluated and how the reference standard is defined (3). Because the diagnostic accuracy of a test may differ depending on the clinical setting, it is crucial to state as clearly as possible the clinical circumstances or setting in which the diagnostic test is used. For example, the diagnostic accuracy CT or MRI to evaluate focal liver lesions may be poorer in detecting HCC in a primary care setting, in which incidental non-HCC lesions are predominant, than in a tertiary care facility, where patients have already been selected because of symptoms or previous screening results (3).
When defining research questions, reviewers should predict all possible research steps and specify the questions accordingly. Drawing a diagram of the study process and the frame of research questions might be helpful, as illustrated in Figure 1. Some preliminary pilot work assessing several articles before establishing the main study flow can be quite helpful for improving the research questions. The inclusion/exclusion criteria for the literature search and selection can then be determined based on the refined research questions. In general, the process of defining research questions and developing inclusion/exclusion criteria can be performed at the same time.
Developing Inclusion/Exclusion Criteria
The development of inclusion/exclusion criteria to determine whether or not articles in the literature are appropriate for a systematic review and meta-analysis should focus on two issues: relevance to the research questions and methodological quality (2). Relevance to the research questions is the most important factor for defining the inclusion criteria, whereas exclusion criteria are mainly based on methodological quality. Therefore, the inclusion criteria are usually expressed in the PICO question format as used to define research questions. Exclusion criteria usually contain factors that may cause bias owing to an inappropriate study design or inferior quality of a paper. Regarding bias, we mean any process introduced at any phase of the study conduct that produces a systematically different inference for the true value.
Step 2: Systematic Search and Selection of Literature
Systematic Search for Relevant Studies
A systematic search of the literature is one of the main differences between a traditional narrative review and a systematic review. The purpose of a systematic search is to identify as many studies on the topic of interest as possible. To achieve this, a comprehensive search strategy should be developed and documented in the review protocol prior to conducting a literature search. The final search strategy should be reported in sufficient detail so that anyone can reproduce the search results if he/she wants to update the systematic review.
The general process of the searching strategy includes three phases:
Phase 1. Develop search terms: 1) explore the major databases, such as MEDLINE and EMBASE (Excerpta Medica database), and other specific databases relevant to the research questions by using appropriately broad search terms; 2) identify key search terms that will find studies relevant to the research questions; 3) determine which databases should be searched; and 4) develop and document the search terms for each database.
Phase 2. Conduct search: 1) search all databases using the identified search terms; and 2) use inclusion criteria to determine which research should be retrieved.
Phase 3. Extend search: 1) search the reference lists and bibliographies of all included studies for additional studies; 2) search for "gray" literature, such as dissertations, reports, conference abstracts, or governmental or private sector research, if available; and 3) consult experts in the disease of interest.
The specific literature databases to be searched will depend on the topic of the systematic review and meta-analysis. There is no single official rule regarding how many databases one should search. For a systematic review and meta-analysis of DTA studies, MEDLINE and EMBASE are the two most important databases and would usually cover most relevant studies. MEDLINE is compiled by the National Library of Medicine and is available through PubMed, the National Institutes of Health Internet portal. MEDLINE indexes more than 2 million articles from the biomedical literature, and approximately 400000 new articles are added each year. Nevertheless, MEDLINE indexes only about 30% of the total number of medical articles published (2). EMBASE, produced by Elsevier, contains over 28 million records covering the biomedical and pharmacological literature found in more than 8400 journals published since 1947. The content of EMBASE is steadily increasing at a rate of over 900000 new records each year (10). The LILACS database for literature in the Latin American and Caribbean health sciences is also useful. For the abstracts and citations of peer-reviewed literature as well as conference papers, we recommend using the bibliographic database Scopus.
The development of search terms to identify relevant studies should also be based on the PICO question format. Table 2 offers an example of search terms for reviewing the diagnostic accuracy of CT compared with MRI for diagnosing HCC. However, depending on the research questions, we recommend using PIC without the O format to cast a wider net. Within each of the PICO categories, all the search terms are linked by a Boolean operator of 'OR' to identify all possible studies that correspond to the category. Between the categories of the PICO format, linking should be made using the 'AND' operator to retrieve relevant studies corresponding to the research questions (11). These search terms should be specifically modified for each of the databases. We recommend extending the search to all the reference lists from the original research articles initially captured as well as related review articles because they might contain relevant studies that were missed during the initial electronic search.
Literature Selection
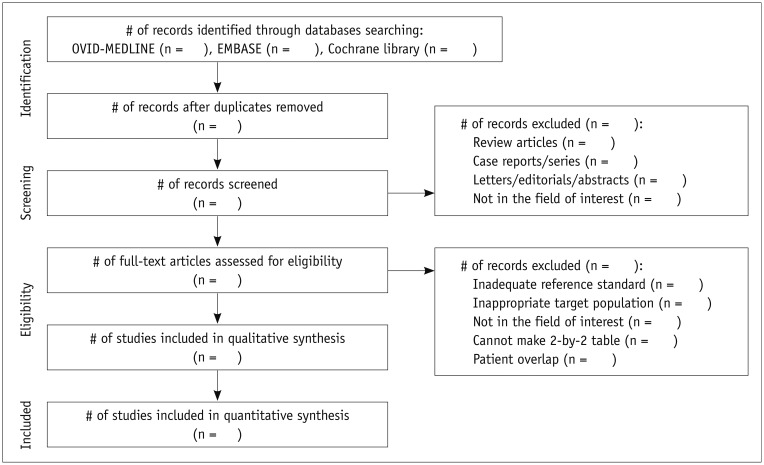
The screening and literature selection should be done independently by at least two researchers, and any disagreement should be settled by reaching a consensus between the two reviewers or by discussion with a third person to avoid the erroneous exclusion of eligible articles. The PRISMA statement (http://www.prisma-statement.org/), which replaces the QUOROM guideline, provides an exemplary format to guide the selection process (12). First, many papers that obviously do not fulfill the predefined eligibility criteria can be removed by simply screening the title and abstract. Then, in case of any uncertainties, the full text should be carefully reviewed. It is very important to keep a record of why any article was excluded, and this information should be inserted in the PRISMA flow chart (Fig. 2). In this chart, "qualitative synthesis" refers to a systematic review used to provide the descriptive statistics without statistical pooling, whereas "quantitative synthesis" refers to a meta-analysis performed to generate summary estimates of a test's diagnostic accuracy. Since the PRISMA checklist was designed for a systematic review and meta-analysis in general, it may need to be modified for a DTA review. However, a modified version of PRISMA (PRISMA-P) currently offers the best prospect of achieving good quality reporting of a systematic review of DTA (8).
Reference management software programs (e.g., EndNote, Reference Manager, and Mendeley) are very helpful in managing searched articles. This software provides functions to import the searched articles directly from multiple databases, to organize and manage them, to find duplicate articles, and to format bibliographies and manuscripts. These programs also allow one to export selected lists of articles as a Microsoft Excel file for more efficient handling and editing.
Step 3: Assessing the Quality of Studies
Bias and Variations in DTA Studies
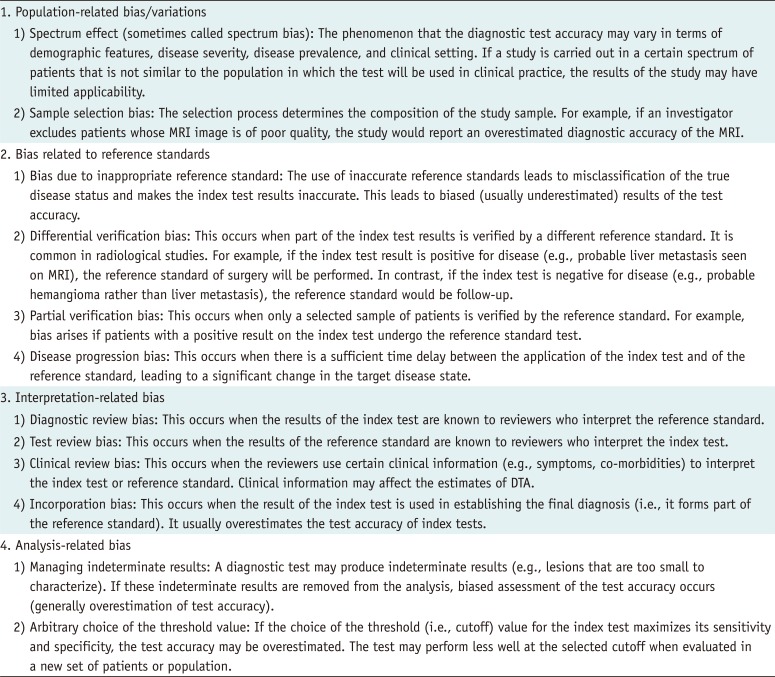
Studies to evaluate DTA would compare an index test against a reference standard test in a consecutive or randomly selected series of patients suspected of having a target disease. DTA studies are often subject to variation and bias (13). Although it is often difficult to distinguish between variation and bias, the former generally refers to variability among the studies in terms of study population, clinical setting, test protocol, and target disease that could limit the applicability or generalizability of the study results (14). On the other hand, bias is a systematic deviation of the study results from the true diagnostic accuracy that typically occurs owing to flawed study design or inappropriate execution of the study. A meta-analysis of study results that contain numerous variations or biases would be of little value (15). Therefore, it is important to detect possible variations and biases in the research studies included in a meta-analysis and to assess the methodological quality of the studies. The major biases in diagnostic research studies are summarized in Table 3 and the Supplementary Material (in the online-only Data Supplement) (14). Further details on typical biases encountered in DTA studies are well explained elsewhere (1617).
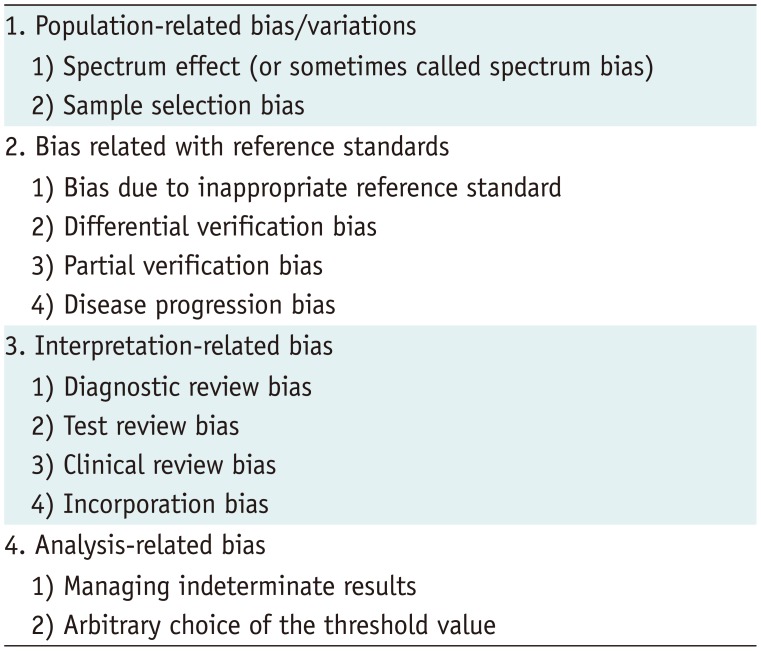
Table 3
Sources of Bias and Variations in Studies Evaluating Diagnostic Test Accuracy
Detailed explanations are provided in Supplementary Material (in the online-only Data Supplement).
![]()
Appraisal Method
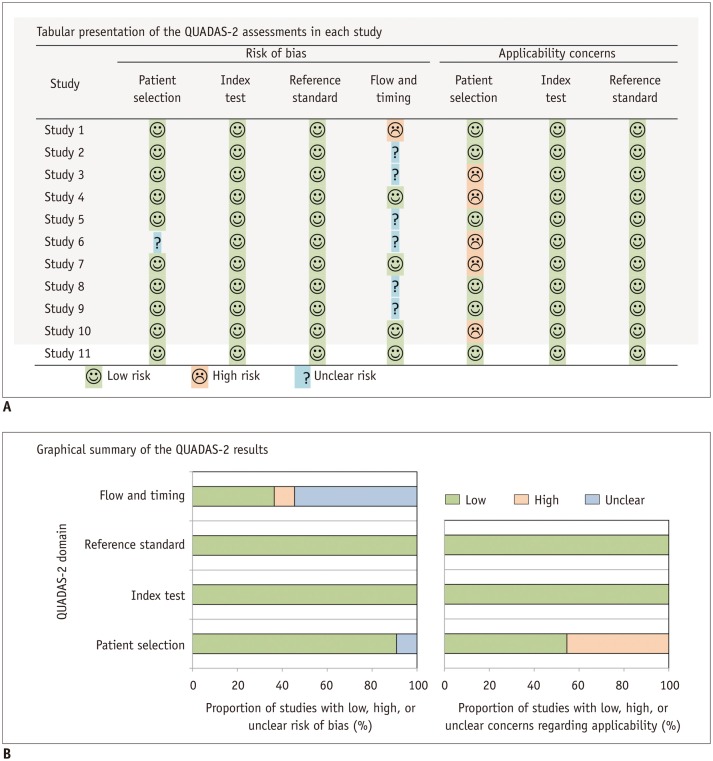
A structured method to appraise the methodological quality of DTA studies, known as the Quality Assessment of Diagnostic Accuracy Studies (QUADAS), was first developed in 2003 as an appraisal tool for evaluating the quality of the DTA studies included in its systematic review (18). In 2011, it was refined and updated to QUADAS-2, which incorporated additional accumulated evidence, clinical experience, and anecdotal reports and feedback from researchers (19). It is currently recommended for the quality assessment of articles included in the systematic review of DTA studies. If a study is found to be of poor quality upon QUADAS-2 evaluation, one can consider excluding it from the meta-analysis or further analyze the effect of the article quality on the outcome.
The QUADAS-2 tool assesses study quality in four domains: patient selection, index test, reference standard, and flow and timing. Each domain is assessed in terms of the risk of bias and the applicability (i.e., generalizability) of the study results for the first three domains. Signaling questions are used to categorize the risk of bias as low, high, or unclear (19) and should be tailored to the questions for each systematic review because the eligible population, clinical setting, test protocol, and target disease may differ in each review. Although QUADAS-2 is the only validated tool for assessing the quality of studies, it does not include specific criteria for assessing comparative DTA studies, so this tool must be modified accordingly (20). Further details regarding QUADAS-2 can be found on its official website (http://www.bris.ac.uk/quadas/), which contains the QUADAS-2 tool and related documents, information about how to apply this tool, and examples of completed QUADAS-2 assessments. It also provides downloadable resources, including a Microsoft Access database for data extraction, an Excel spreadsheet to produce graphic displays of results, and templates for Word tables to summarize results (Fig. 3).
Step 4: Data Extraction and Management
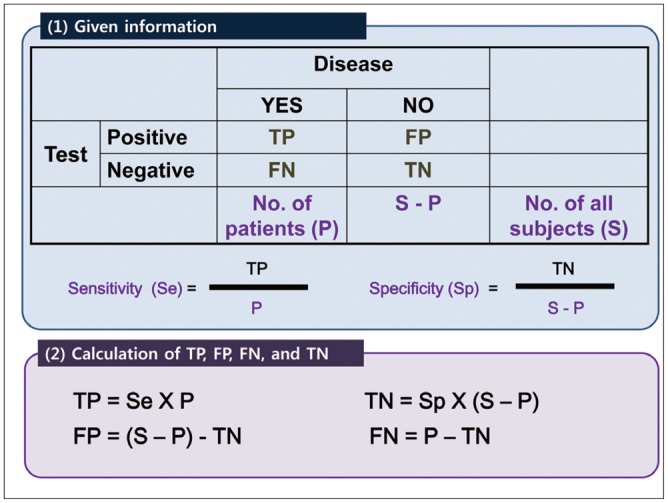
Once the relevant studies have been selected, the information required for systematic review and meta-analysis should be extracted independently by at least two reviewers. Any disagreements should be settled by consensus or by discussion with a third person, similar to the literature selection process. At this stage, it is necessary to keep each reviewer's extraction records to provide a degree of inter-rater reliability, such as a kappa statistic, in a review paper. To extract data systematically, we also recommend use of a structured data extraction form that generally includes the following information: 1) study characteristics, such as authors, year of publication, hospital or medical school, years of patient recruitment, sample size used, types of study design, and diagnostic criteria for the target disease (reference standard); 2) demographic characteristics of study patients, such as their age and sex; 3) imaging characteristics, such as type of imaging machines or techniques and test protocols; and 4) outcomes to estimate the test accuracy in the form of a diagnostic 2-by-2 table that includes the number of true positives (TPs), false positives (FPs), false negatives (FNs), and true negatives (TNs). If a diagnostic cutoff value was used, the rationale for the choice of this value should be recorded. Published studies often present only the final test accuracy parameters, such as sensitivity and specificity, without providing the number of TPs, FPs, FNs, and TNs. In these cases, reviewers need to reconstruct the diagnostic 2-by-2 table from any available information, such as the total numbers of diseased or non-diseased patients, as described in Figure 4.
Step 5: Analysis and Data Synthesis
It is important to note the difference in meta-analytic data synthesis between DTA studies and therapeutic/interventional studies (21). The main difference is that a meta-analysis of DTA studies must simultaneously deal with a pair of outcome measures, sensitivity and specificity, whereas a therapeutic/interventional meta-analysis usually deals with a single outcome measure. Therefore, a meta-analysis of DTA study has to account for the correlation between the sensitivity and the specificity of a study. In addition, the effect of the threshold used to define positive versus negative test results, which may vary across individual primary studies, must be incorporated into the data synthesis. Addressing these issues in the meta-analysis requires the use of sophisticated statistical methods/models, such as a bivariate model or a hierarchical model (22). These statistical methods will be discussed in greater detail in Part II of this two-part review (5).
Phase 1. Descriptive Statistics and Plots
The first step in data synthesis involves calculating the descriptive statistics in each primary study. These statistics include sensitivity, specificity, positive likelihood ratio (LR), negative LR, and/or the diagnostic odds ratio (DOR) from the diagnostic 2-by-2 tables of individual studies.
The positive LR describes how many times more likely the index test results were positive in the diseased group versus the non-diseased group and is defined as follows:
The negative LR describes how many times less likely the index test results were negative in the diseased group versus the non-diseased group and is defined as follows:
An LR(+) that is greater than 10 and an LR(-) that is less than 0.1 provide "convincing" diagnostic evidence; an LR(+) that is greater than 5 and an LR(-) that is less than 0.2 provide "strong" diagnostic evidence (623).
The DOR is defined as follows:
It describes how many times higher the odds are of obtaining a positive test result in a diseased person than in a non-diseased person. Meanwhile, although the diagnostic accuracy obtained by (TP + TN) / (TP + FP + FN + TN) provides a single overall measure of test accuracy, it is not often used and is not pooled across studies.
Using the calculated descriptive statistics of each of the primary studies, one can derive a descriptive forest plot (Fig. 5A) and a summary receiver operating characteristic (SROC) plot (Fig. 5B). A forest plot is a chart in which the x-axis can be any calculated descriptive statistic with its 95% confidence interval (CI) and the y-axis is the study identifier. The generic inverse variance method for calculating weights is commonly used to calculate the 95% CI of descriptive statistics (24). The plot is often rendered so that the size of the data points reflects the sample size of each study, which results in a monotonic increasing or decreasing pattern (21). An SROC plot should be distinguished from an SROC curve. The SROC plot is a descriptive plot that merely displays a summary point of individual primary studies (i.e., a plot of sensitivity against the false-positive rate and its 95% confidence region in the ROC space), whereas the SROC curve is a statistically estimated meta-analytic summary line in the ROC space (Fig. 5C).
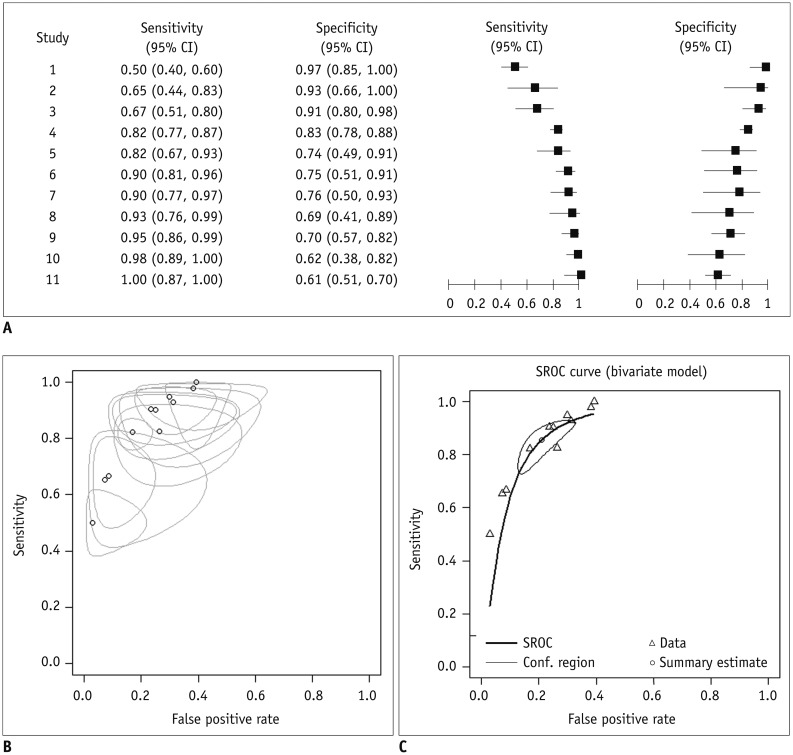 | Fig. 5Graphs used in meta-analysis of diagnostic test accuracy studies.
A. Coupled forest plots. B. Summary receiver operating curve (SROC) plot. Open circle (o) represents false positive rate (x-coordinate) and sensitivity (y-coordinate) of individual studies. Size of bubbles reflects precision of estimate. C. SROC curve. CI = confidence interval
|
Phase 2. Assessment of Heterogeneity
Heterogeneity refers to the variability across studies. Heterogeneity can result from random chance; errors in analytical methodology; and/or differences in study design, protocol, inclusion and exclusion criteria, and diagnostic thresholds (13). When the heterogeneity among studies is marked, the use of meta-analytic pooling of studies is no longer meaningful and is therefore not recommended. In such cases, the systematic review should be limited to qualitative descriptive analysis of the selected literature.
One of the most important sources of heterogeneity between DTA studies is a threshold effect. For defining positive test results, studies evaluating test accuracy may use the same test but a different threshold (e.g., a diagnostic cut-off value or positivity criterion). Therefore, the accuracy of a diagnostic test relies on the threshold used in the study for classifying the test result as positive or negative. Changing the threshold in order to increase the sensitivity decreases the specificity, and vice versa. The correlation observed between sensitivity and specificity by varying the threshold for a positive test result is termed a threshold effect. Therefore, it is necessary to consider the sensitivity and specificity jointly when assessing a study's DTA. From a meta-analytic viewpoint, if studies use different criteria to define test results, their summary data will vary depending on the threshold used, and this could contribute to the observed heterogeneity among study results.
Whether the threshold effect is or is not introduced, reviewed studies can be assessed in several ways. First, we can check the coupled forest plot. A coupled forest plot of sensitivity and specificity (Fig. 5A) is a side-by-side display of two forest plots showing sensitivity and specificity in which the order of individual studies is sorted according to one of the parameters (e.g., in descending order of the sensitivity values). If there is a threshold effect, the sensitivity and specificity will change in an inverse manner. Therefore, the overall arrangement of the coupled forest plot will have a V or an inverted-V shape (22). Statistically speaking, by assessing a linear correlation between the sensitivity and false-positive rate (i.e., 1-specificity, using Spearman's correlation analysis), the threshold effect being presented in the review can be regarded as substantial if a significant correlation exists, with a correlation coefficient of 0.6 or higher (25). Drawing an SROC plot is another way to explore a threshold effect. When a threshold effect exists, the points in the plot will show an overall curvilinear distribution of the individual studies in the ROC space (from the left lower corner to the right upper corner), which is also convex to the left upper corner of the plot (Fig. 5B). If a threshold effect is presented (and if the correlation is positive), use of an SROC curve to summarize the diagnostic accuracy is appropriate (26). The SROC curve can be obtained using a bivariate model or a hierarchical summary ROC (HSROC) model, which will be explained in more detail in Part II of this review (5).
In the meta-analysis of therapeutic/interventional studies, heterogeneity is usually assessed using Cochran's Q test as well as Higgins' I2 statistic (27). A p value less than 0.10 or 0.20 on the Q test or an I2 statistic greater than 50% are traditionally considered to indicate substantial heterogeneity among study results. These statistics can also be used to demonstrate the presence and extent of heterogeneity among sensitivities or specificities of DTA studies. However, because the Cochran's Q and Higgins' I2 statistics were developed to evaluate the heterogeneity of a single outcome variable, they may not be informative or meaningful by themselves in analyzing DTA studies, unlike the case in therapeutic/interventional studies, and should therefore be interpreted with caution because they do not consider a threshold effect.
Phase 3. Quantitative (Meta-Analysis) or Qualitative Data Synthesis
In general, a meta-analysis of DTA studies implies statistical pooling of the results of primary studies in order to generate summary points, such as the summary sensitivity, specificity, DOR, or a summary line (e.g., an SROC curve). We request that readers refer to Part II of this two-part review regarding statistical methods for a discussion of meta-analytic pooling of individual study results (5). Here, we will just mention the fact that DTA studies often show greater heterogeneity than therapeutic/interventional studies do owing to the existence of a threshold effect. Many studies evaluating DTA are retrospective observational studies that usually have relatively low-level evidence and a potentially high risk of bias. Therefore, in contrast to clinical trials in the field of therapeutic/intervention studies, it is often difficult to strictly control biases in DTA studies. If heterogeneity is great among DTA studies, a mere statistical pooling of the individual study results may provide a meaningless pooled estimate. In order not to achieve seriously inaccurate review results, the indiscriminate use of meta-analytic pooling of studies should be avoided. Instead, possible causes of study heterogeneity should be explored and clarified using either a subgroup analysis or a meta-regression analysis. If there is substantial heterogeneity among the primary studies that is difficult to explain or adjust, one should not perform pooling of study results using a meta-analysis but should simply limit the systematic review to a qualitative descriptive synthesis.
Phase 4. Assessment of Publication Bias
Like the meta-analyses of therapeutic/interventional studies, the pooling of DTA study results may be subject to several sources of bias (28). In addition, some forms of bias are specific for diagnostic test studies (29), such as spectrum bias (30), differential or partial verification bias (31), and/or a bias resulting from the choice of cut-off points (3233) (Detailed explanations of these biases are summarized in the Supplementary Material [in the online-only Data Supplement] for this review).
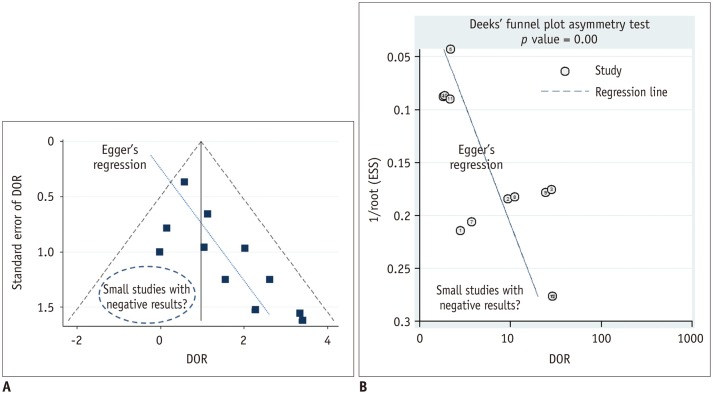
Like most other meta-analyses that are not free from publication bias, a bias that is generally presumed to occur because statistically non-significant results tend not to be published, thus leading to a possibly exaggerated pooled estimate in a systematic review (34), it is important to assess publication bias in any meta-analyses of DTA studies as well. In a meta-analysis of therapeutic/interventional studies, publication bias is generally assessed using a funnel plot, the Begg test, or the Egger test. The funnel plot is a graphic visualization of the summary data in a funnel-shaped chart in which the value of the study results is used for the x-axis, while its precision or size is plotted on the y-axis (Fig. 6A). The Begg and Egger tests are statistical tests used to assess asymmetry of the funnel plot. In a meta-analysis of DTA studies, DOR as a single indicator of the diagnostic accuracy, rather than the paired sensitivity and specificity, is preferred in order to assess possible publication bias. As a funnel plot, Deeks plot (Fig. 6B) and its test can be used where a natural logarithm of the DOR and a reciprocal of the square root of the effective sample size are used for the x-axis and y-axis, respectively (35).
 | Fig. 6Funnel plot to assess publication bias.
A. Funnel plot with Egger's regression line. Each dot represents primary study. X-axis shows study result (i.e., diagnostic odds ratio [DOR]) and y-axis represents study size (i.e., standard error of study result). Empty region, to be filled with results of relatively small studies with negative results or small effect size, makes plot asymmetrical. Asymmetry of plot would indicate that such studies may not ever have been published, thus raising possibility of publication bias being presented as review result. B. Deeks funnel plot. In Deeks funnel plot, x-axis is natural logarithm of DOR and y-axis is 1/√ effective sample size (ESS). According to Deeks et al. (35), it is preferred method for meta-analysis of diagnostic test accuracy studies owing to its high statistical power.
|
Step 6: Presentation of Results for Publication
Proper reporting of the results of a systematic review and meta-analysis is an important issue. As mentioned earlier, the PRISMA statement or a modified version of it (PRISMA-P) is available to guide researchers as to how to present their reviews. Recently, Tunis et al. (2) investigated the completeness of reporting and the quality of systematic reviews and meta-analyses in major radiology journals and revealed that there has been modest improvement in the completeness of reporting assessed by PRISMA since its publication in 2009. Radiology researchers who conduct a systematic review and meta-analysis should follow the PRISMA guidelines.
The process of selecting relevant literature should be presented as a flow chart, which is usually the first figure presented in any systematic review and meta-analysis (Fig. 2). The characteristics of included studies should be described in detail and summarized in a table that includes information regarding the index tests, participants, study design, and reference standards for each of the studies. The quality assessment results obtained using the QUADAS-2 tool should also be provided (Fig. 3). Next, because the presentation of the meta-analysis results will depend on the methods used, a clear description of the decision process that led to the selection of the appropriate methodology should be provided. Forest plots accompanied by summary points offer useful visual summaries that are easy to interpret. Providing the TP, FP, FN, and TN of individual studies in the form of a table or in a forest plot is also helpful for readers and reviewers in interpreting the study results. If an SROC analysis is performed, the relevant SROC curve should be presented according to a statistical model used in the meta-analysis. Whenever possible, all the estimated parameter values should be given along with their corresponding confidence or credible intervals. Results of heterogeneity assessments should also be presented. The interpretation of these results should be clear, and the potential effect caused by bias or heterogeneity should be taken into account. The interpretation should also consider the consequences of false-negative or false-positive results. Finally, potential limitations of the review in terms of the methodological and interpretational perspectives should be clearly stated.
Go to :
CONCLUSIONS
Systematic review and meta-analysis are research methodologies for summarizing the results of primary research studies to generate a more evidence-based summary estimate. The methodology used in DTA studies is quite different from that of therapeutic/interventional studies and has been developed substantially in recent decades. Here we have reviewed some of the key issues regarding the overall process of systematic review and meta-analysis of DTA studies from a practical standpoint while highlighting how this process differs from that used for therapeutic/interventional studies.
Go to :
 XML Download