

 PDF
PDF ePub
ePub Citation
 Print
Print


INTRODUCTION
Classic method for measuring regional uptake in positron emission tomography (PET) images is based on manually drawn volume of interest (VOI) on PET images with or without a reference to magnetic resonance (MR) images overlaid on PET image. Although it is simple and easy, PET requires a great deal of manual work that can be complicated by inter- and intra-operator variability (1, 2). Therefore, most recent PET studies have utilized template VOI-based or exploratory voxel-based methods to avoid variability. Both VOI-based and exploratory voxel-based PET require a spatial normalization step to fit PET images to template space by using non-linear transformation algorithm (3). To accomplish spatial normalization, PET images can be directly normalized to ligand-specific PET template or indirectly normalized by applying transformation parameter with high resolution MR images to the MR template. Although spatial normalization using PET template is straightforward and robust, it is susceptible to local changes of uptake. In contrast, spatial normalization based on higher resolution structural MR images is more accurate. In addition, it works independently of uptake patterns in PET images (3, 4).
During the last decade, PET scanners with computed tomography (PET/CT) have become widely available. As CT and PET images are acquired sequentially in the same space, CT image can be used as a map for attenuation correction as well as a structural image to support PET image. Therefore, if we can use CT image for spatial normalization of PET images, additional structural brain imaging may not be necessary.
Two previous studies have reported spatial normalization of brain CT image by using skull-stripped or intensity-transformed CT images (5, 6). Since there is a great difference of Hounsfield unit between the skull, brain tissue, and air, spatial normalization may be greatly influenced by skull in CT images. In addition, the skull and surrounding soft tissue may affect the result of spatial normalization of MR images (5, 7, 8, 9). Therefore, extracting brain tissue from the entire CT volume may be an important step to achieve optimal spatial normalization results. In the present study, we developed a modified technique for CT-based spatial normalization by using skull-stripped CT template and applied it for spatial normalization of [18F] fluorodeoxyglucose (FDG) PET images using healthy controls. The objective of this study was to demonstrate its usefulness in spatial normalization of PET images by comparing it to conventional PET and MR-based spatial normalization methods.
MATERIALS AND METHODS
Subjects
From January to June 2010, we enrolled healthy controls (age > 40 years) without history or signs of neurological illness for the establishment of image database of healthy controls. The Korean version of mini-mental state examination (MMSE) score (10) was used. Subjects with MMSE score less than 24 or those with subjective symptoms of cognitive dysfunction were excluded. Subjects with unexpected lesion in brain MR images were also excluded. Finally, a total of 70 subjects were included in this study (31 males and 39 females, age 59.7 ± 10.3 years, MMSE score 29.3 ± 1.1). Written-informed consents were acquired from all included subjects. This study was approved by the Institutional Review Board of our institution.
Acquisition of PET/CT and MR Images
In all subjects, axial T1-weighted brain MR images were obtained with three dimensional-spoiled gradient-recalled sequences at repetition time = 6.8 ms, echo time = 1.6 to 11.0 ms, flip angle = 20°, 256 × 256 matrix, and slice thickness = 1 mm in a 3.0 Tesla scanner (Signa EXCITE, GE Medical Systems, Milwaukee, WI, USA).
Brain CT and [18F] FDG PET scans were performed with a Biograph 40 TruePoint PET/CT scanner (Siemens Medical Solutions; Malvern, PA, USA). Fifty minutes after intravenous injection of 375.0 ± 89.5 MBq of [18F] FDG, PET/CT was performed. A head holder was applied to minimize the head motion during the scan. After brain CT scan for attenuation correction, structural imaging (120 KeV, 180 mAs, and 3 mm of slice thickness), and 10 minutes of emission scan, 3D CT and PET images were reconstructed in 512 × 512 × 110 matrix with 0.668 × 0.668 × 2 mm voxel size. The ordered-subsets expectation maximization algorithm (iteration = 6 and subset = 16) was used for the reconstruction of PET images.
Image Processing Steps
Creation of Skull-Stripped CT Template
All image processing steps were performed using Statistical Parametric Mapping 8 (SPM8; Wellcome Trust Centre for Neuroimaging, London, UK) implemented in MATLAB 7.1 (MathWorks, Natick, MA, USA). T1-weighted MR images corrected for inhomogeneity were segmented into gray matter, white matter, and cerebrospinal fluid (CSF). The segments of these three tissue types were binarized with a threshold of 0.5 to create mask images. Whole brain mask was created by merging gray and white matter masks. Skull-stripped whole brain MR images were obtained by overlaying the whole brain mask images. To minimize the effect of skull and surrounding soft tissue on spatial normalization (7, 8, 9), we normalized skull-stripped whole brain MR images to skull-stripped Montreal Neurological Institute (MNI) 152 MR template using normalization parameters to the whole brain and CSF masks. The whole brain and CSF masks of the 70 healthy subjects were averaged to create tissue probability maps for segmentation of CT images.
Native CT image has voxel values in Hounsfield unit which includes large amount of voxels of air with negative values that can disrupt spatial normalization of CT image in SPM8 (5). We adjusted the voxel values of CT images by adding a minimal voxel value to the entire volume to remove negative voxels prior to CT image processing. The CT images were coregistered to individual inhomogeneity-corrected MR images. Mask images for the skull were created by binarization of voxels with a Z-score threshold of 1.5 calculated within the entire volume of each coregistered CT image. The coregistered CT images and skull masks were spatially normalized by applying the same parameters normalized MR images. Spatially normalized CT images and skull masks of all 70 healthy controls were averaged to create a skull-unstripped CT template image and tissue probability map for the skull.
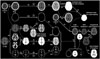
For proper extraction of whole brain with SPM segmentation tool, scalp tissue should be removed to reduce the number of tissue types. A template mask image which included skull, whole brain and soft tissues below eyebrow and occiput was designed by manually removing the scalp from skull-unstripped CT template. We inversely normalized this mask image to individual CT images by using inverse normalization parameters derived from spatial normalization of original CT images to skull-unstripped CT template. Scalp-stripped CT images were created and segmented with SPM segmentation tool by using tissue probability maps for skull, whole brain, and CSF without bias correction. Segments for the whole brain were binarized with a threshold of 0.5 to create whole brain mask. Skull-stripped CT images were extracted by using whole brain mask. Skull-stripped CT images were coregistered to individual MR images by using transformation parameters coregistering original CT to MR images. CT images were spatially normalized with parameters normalizing MR images. By averaging the skull-stripped and spatially normalized CT images of the 70 healthy controls, we created a skull-stripped CT template for spatial normalization. The image processing steps for acquiring skull-stripped CT template is summarized in Figure 1.
Spatial Normalization of PET Images
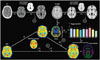
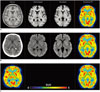
We normalized [18F] FDG PET images in the following three different methods: MR-, CT-, and PET-based. For CT-based method, individual CT images were scalp- and skull-stripped as described above. These skull-stripped CT images were spatially normalized to skull-stripped CT template. Since PET images were already coregistered to CT images, we applied this normalization parameter directly to PET images for spatial normalization. For MR- and PET-based spatial normalization, we used skull-stripped MNI MR template and MNI perfusion PET template, respectively. Individual PET images were coregistered to MR images and spatially normalized by using the same parameters used to normalize skull-stripped MR images to MR template as described above. The image processing steps for spatial normalization of PET image were illustrated in Figure 2. One example of spatial normalization was demonstrated in Figure 3.
Creation of Individual Specific VOI
We used individual specific VOI derived from FreeSurfer 5.1 (Massachusetts General Hospital, Harvard Medical School; http://surfer.nmr.mgh.harvard.edu) as gold standard method to compare regional standardized uptake value (SUV) of each spatial normalization method. The T1-weighted MR images were resliced to 1 mm isovoxel space within 256 × 256 × 256 matrix. They were corrected for inhomogeneity, processed for skull-stripping, and segmented into gray and white matter. Cortical gray matter was parcellated with a probabilistic labelling algorithm by inflating the boundary between the gray and the white matter with overlaying curvature information on the inflated surface (11, 12). Subcortical structures were segmented and labeled by probabilistic registration technique (13). We obtained whole brain mask images with 112 parcellated regions after merging anatomically related regions to create VOI mask (FreeSurfer-generated VOI; FSVOI) which contained 7 cortical (frontal, parietal, occipital, temporal, medial temporal, cingulate, and insula cortices) and 4 subcortical regions (thalamus, caudate, putamen, and cerebellar cortex). Steps for applying FSVOI were illustrated in Figure 2.
Measuring Regional SUV Values and Statistical Analysis
By using PMOD 3.1 (PMOD Technologies Ltd., Zurich, Switzerland), regional SUV values were measured by overlaying a modified automated anatomical labeling (AAL) template on PET images spatially normalized by three different methods. Individual FSVOI mask images were coregistered to PET images by applying the parameters used to coregister the resliced MR images created by FreeSurfer to individual CT images. Coregistered FSVOI masks were then overlaid on individual PET images to measure regional SUV values.
In Prism 5 (GraphPad Software, Inc., La Jolla, CA, USA), we used correlation analysis between SUV values measured with FSVOI and modified AAL VOI template on PET images spatially normalized by each normalization method. The variability of regional SUV values was estimated with coefficient of variation (COV).
RESULTS
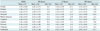
Regional SUV values calculated by three different normalization methods are summarized in Table 1. The regional SUV values derived from all three spatial normalization methods were underestimated when compared to those measured with FSVOI, the gold standard. The underestimation bias was slightly greater in the CT-based method (MR-based, -1.7% to -15.8%; CT-based, -0.3% to -20.5%; PET-based method, -0.4% to -18.1%). The greatest difference in SUV value was found in cingulate cortex (-15.8% to 18.1%). Regional variability estimated with COV was similar in FSVOI for all three normalization methods (FSVOI: 15.8% to 19.5%; MR-based: 15.9% to 21.3%; CT-based: 15.7% to 19.0%; PET-based: 15.7% to 18.3%).
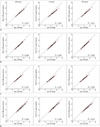
Correlation analysis of regional SUV values measured with FSVOI and those measured with three different normalization methods are summarized in Table 2 and Figure 4, respectivley. The SUV values for the three methods of spatial normalization correlated significantly (p < 0.0001) with those measured with FSVOI. The MR-based method showed the best correlation in the temporal cortex and cerebellum. The PET-based method showed the best correlation in the frontal, parietal, medial temporal, cingulate cortices, caudate, putamen, and thalamus. The CT-based method showed the best correlation in the occipital cortex, with intermediate correlation in the caudate, putamen, thalamus, and cerebellum. However, there was no significant difference in regression coefficients among the three different methods, with each method showing very high regression coefficients in all regions. In addition, regional SUV values derived from MR- and CT-based methods and those measured with FSVOI were well correlated with those derived from conventional PET-based method (Supplement Fig. 1 in the online-only Data Supplement).
DISCUSSION
We found that the CT-based spatial normalization method was almost comparable to the conventional MR- and PET-based methods in analyzing [18F] FDG PET images. Although all three methods of spatial normalization underestimated the regional SUV values compared to those measured with FSVOI, a little higher underestimation bias was observed in CT-based method. The regional SUV values derived from the three spatial normalization methods showed good correlation with those measured with FSVOI. Therefore, the CT-based spatial normalization can be an alternative method for spatial normalization of [18F] FDG PET based on structural imaging when MR imaging is unavailable.
Well-designed CT-based spatial normalization method was first proposed by Rorden et al. (5). They transformed voxel values of native CT images encoded in Hounsfield unit into three predefined levels by classifying CSF, brain tissue and skull. Thereby, spatial normalization was driven by density of brain tissue as well as skull. This method is simple with good results. However, as individual variation of skull and surrounding soft tissue may introduce a small amount of error during the spatial normalization. In addition, that method included non-brain tissue for spatial normalization. Furthermore, the intensity transformation using that method is rather artificial. It has been reported that the removing of voxels of non-brain tissues can increase the accuracy of spatial normalization (7, 8, 9). Therefore, we decided to develop a new CT-based spatial normalization method using skull-stripped CT template. Instead of transforming voxel values into different proportional levels, we transformed voxel values linearly by adding minimal values in the entire volume to remove negative voxels mostly representing air corrupting spatial normalization in SPM (5). Our CT-based spatial normalization method included two key steps for image processing. First, tissue probabilistic templates for the skull, whole brain, and CSF were created. Second, tissues from scalp-stripped CT image with probabilistic templates were classified. Since classic brain extraction tool and region-growing technique were unsuccessful for skull-stripping of CT images, we used segmentation tool included in the SPM software. Since CT image did not show clear difference of intensity between gray and white matter, we classified tissues into three compartments (skull, whole brain, and CSF) by using tissue probabilistic templates for each tissue type from the tissue masks derived from MR segments. However, this procedure failed to segment CT images of approximately 30% of subjects whose scalp tissues were prominent. By removing scalp tissue with a mask inversely normalized to CT image, we were able to obtain skull-stripped CT images for all subjects.
The regional SUV values derived from all three spatial normalization methods were underestimated by 0.3% to 20.5% when compared to those derived from FSVOI. The underestimation bias was the smallest in the thalamus and medial temporal cortex, but was the greatest in the cingulate cortex. In this study, we used FSVOI as the gold standard for measuring regional SUV values. FreeSurfer is a validated tool for segmenting brain into gray and white matter. It is also useful for parcellating cortical and subcortical structures within gray matter. The FreeSurfer-generated VOI and FSVOI coregistered to individual PET images covered as many gray matter voxels as possible by excluding non-gray matter voxels. The regional SUV values measured with FSVOI could be approximated to the real values when partial volume effect is disregarded. Therefore, FSVOI can be the best choice for measuring regional gray matter activity which has been used in previous studies (14, 15). In contrast, the modified AAL template VOI overlaid on spatially normalized PET images cannot prevent the inclusion of neighboring voxels of white matter and CSF. Thus, regional SUV values measured with template VOI were inevitably underestimated. This underestimation bias was higher in the regions with greater spatial mismatch (e.g., cingulate cortex) or with higher probability for including non-gray matter tissues within template VOI (e.g., frontal and temporal cortices). Although the underestimation bias and the regression coefficients were greater in the CT-based method than in the conventional MR- or PET-based methods, the differences of bias were less than 5%. All three spatial normalization methods gave similarly high regression coefficient values in all regions.
There are several limitations in this study. Firstly, the image processing steps required the creation of skull-stripped CT template, which was much more complicated than other methods, thus requiring greater time. Secondly, despite greater effort, the CT-based method was still inferior to conventional methods in healthy subjects. Thirdly, only [18F] FDG PET images of healthy subjects were analyzed in this study. Therefore, this CT-based method still needs to be validated for subjects in various disease groups using different radiotracers. Nonetheless, the CT-based method provided reliable results similar to the other two methods.
One greatest advantage of this CT-based spatial normalization technique is that this technique enables structure-based spatial normalization for brain PET studies of specific subjects for whom structural MR image is unavailable due to certain contraindications (e.g., cardiac pacemaker, deep brain stimulator implanted state, or claustrophobia). Another advantage of this CT-based method over PET-based spatial normalization is that we can avoid structural distortions that might occur in some specific tracers whose uptake is limited to very small areas of the brain. In addition, as SPM software was used for most of the image processing steps required for the creation of CT template and spatial normalization, additional specialized software is not required. Therefore, this CT-based spatial normalization method will be cost-effective and useful for PET/CT studies by avoiding additional MR scan required for the acquisition of structural image for spatial normalization.
In summary, the CT-based spatial normalization method was almost comparable to the conventional MR- and PET-based spatial normalization methods in [18F] FDG PET studies in healthy controls. The regional SUV values derived from all three spatial normalization methods correlated significantly with those measured with FSVOI. Therefore, this CT-based spatial normalization method could be used as a reasonable alternative spatial normalization method based on structure. It could be useful for PET/CT studies with various radiotracers whose uptake is expected to be limited to specific brain regions or highly variable in study population. Further study is necessary for the validation of this CT-based method in patients with specific diseases and in PET studies using various radiotracers.

 XML Download