

 PDF
PDF ePub
ePub Citation
 Print
Print


INTRODUCTION
For physicians, one of the most commonly encountered scenarios during interpretation of conventional magnetic resonance (MR) imaging of the spine is differentiating neoplastic marrow infiltration from red marrow deposition (1). Several methods can be used for this differentiation, such as diffusion-weighted imaging, chemical-shift imaging, dynamic contrast-enhanced imaging, and MR spectroscopy (2, 3). In this study, we focused on chemical-shift imaging.
Normal marrow is an intermixture of hematopoietically active (red) marrow and inactive (yellow) marrow supported by varying proportions of structural trabecular bone. Red and yellow marrow possess a substantial fat component (2, 3, 4, 5). Hence, benign red marrow deposition generally shows higher signal intensity (SI) on T1-weighted images as compared to sound muscle and the intervertebral disc (2, 3). On the other hand, the SIs of pathologic bone marrow lesions are generally similar to or lower than those of the muscle and disc because the fat-containing bone marrow of the spine is replaced by tumor cells (5, 6, 7). However, similar to pathologic bone marrow lesions, benign hypercellular red marrow may show an unexpectedly low SI on T1-weighted imaging (T1WI) (3). Many studies have tested in- and opposed-phase imaging for marrow lesion differentiation which is based on the expectation that the presence of fat in red marrow can cause the SI to drop on opposed-phase imaging (1, 5, 6, 8, 9). We thought that lesions without fat, which can be seen in marrow replacing conditions, could theoretically show no or less signal drop in the opposed phase. Hence, we commenced this study with the expectation that measurement of the fat-signal fraction (FF), considering T2* decay bias correction (10, 11), could be feasible and may be more reasonable than an indirect measurement, with opposed-phase imaging, of fat within a lesion. To the best of our knowledge, the utility of FF quantification to differentiate between malignant and benign marrow lesions has not been addressed.
Hence, the purpose of this study was to evaluate the feasibility of T2*-corrected FF quantification by using three-echo gradient echo imaging with T2* correction and Dixon water/fat separation to differentiate malignant marrow-replacing lesions from benign red marrow deposition of vertebrae.
MATERIALS AND METHODS
Patients
The Institutional Review Board reviewed our study and issued a waiver. All patients signed an informed consent as part of their research hospital visits. From March 2012 to February 2013, 46 consecutive patients, who were referred for MR imaging to evaluate a suspected spinal malignancy (n = 32) or presented with an incidentally found marrow signal abnormality (defined as low or similar signal intensity to non-degenerated intervertebral disc on T1WI) during MR imaging, were assessed for the etiology of back or neck pain (n = 14). These patients underwent an MR protocol, including a FF mapping sequence, as described below. Patients, who received radiotherapy on the marrow lesions (n = 5) or systemic chemotherapy (n = 8) prior to MR imaging, were excluded because these treatments are known to cause unpredictable signal alterations that might affect FF (6). One patient was excluded because of an uncorrectable calculation error; this error, which was found during image analysis, presumably occurred during image acquisition of the FF mapping sequence. Therefore, our study included 32 patients (17 women, 15 men; mean age, 59.9 ± 14.2 years; age range, 36-94 years) who underwent MR examination for naïve marrow lesions.
The subjects were divided into two groups; the division was based on the pathologic examination result or on the clinical and diagnostic imaging results, which were interpreted by two experienced musculoskeletal radiologists with 23 and 11 years of experience in spine imaging interpretation, respectively.
Group 1 consisted of 21 subjects whose marrow lesions were malignant marrow-replacing lesions (9 women and 12 men; mean age, 58 ± 12.8 years; age range, 36-94 years). These subjects were included in this group because of hot uptake of the lesion in 18F-fludeoxyglucose positron emission tomographic (PET)-computed tomography (CT) (n = 9), newly developed radiopharmaceutic uptake on follow-up bone scintigraphy (n = 2), a pathologic result from CT-guided biopsy (n = 8), and from bone marrow aspiration for patients with a suspected hematologic malignancy (n = 2). The malignant marrow-replacing lesions of the subjects were as follows: lung cancer (n = 4); pancreatic cancer (n = 1); colorectal cancer (n = 4); multiple myeloma (n = 2); thyroid carcinoma (n = 2); nasopharyngeal cancer (n = 1); gall bladder adenocarcinoma (n = 1); gastric adenocarcinoma (n = 1); breast cancer (n = 2); prostate cancer (n = 2); and hepatocellular carcinoma (n = 1).
Group 2 consisted of 11 subjects with benign red marrow depositions (3 women and 8 men; mean age, 63.6 ± 16.5 years; age range, 38-90 years). These patients were included in this group based on histology (hypercellular red marrow, n = 4) and imaging assessment results (n = 7). The imaging criteria included no size progression and morphologic change at 2-month and 6-month follow-up MRI (12, 13), no pathologic uptake with bone scan (n = 2) or PET/CT (n = 5). Other benign lesions were excluded, through CT, for all patients as follows: no coarse trabeculation to exclude hemangioma and no sclerosis to rule out lesion mineralization, which can be seen in benign notochordal cell tumor (14).
MR Imaging Protocol
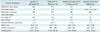
MR imaging was performed on a 1.5-T MR imaging scanner (MAGNETOM Avanto, Siemens Healthcare, Erlangen, Germany) with spine matrix coils. In addition to routine sequences including sagittal T1-weigthed turbo spin echo (TSE) imaging, fat-suppressed (FS) T1-weighted TSE images in the axial plane and pre- and post-gadolinium (Gd)-enhanced FS T1-weighted TSE images (contrast material, 0.1 mmol of gadoterate meglumine [Dotarem; Guerbet, Roissy, France] per kilogram of body weight) in the sagittal plane were included. For T2*-corrected FF quantification, a three-echo volume interpolated breath-hold gradient-echo sequence (VIBE-Dixon, work-in-progress 432.rev.1, Siemens Healthcare, Erlangen, Germany) was used. It enables one to sample one opposed-phase echo and two in-phase echoes. A T2* map is estimated from the latter two echoes; the opposed-phase and first in-phase echoes are then corrected for T2* effects, and they are processed by the two-point Dixon water/fat separation algorithm. This sequence automatically reconstructs FF images. The imaging parameters of the pulse sequences used for analysis are summarized in Table 1.
Image Analysis
We obtained three parameters for one representative lesion (the largest lesion on the images), if multiple lesions were present, in each subject by using the images. The parameters were the FF, lesion-disc ratio (LDR), and contrast-enhancement ratio (CER). The FF was directly obtained by drawing a region of interest (ROI) of the lesion on the automatically reconstructed FF image obtained from the three-echo VIBE-Dixon sequence. The LDR was obtained from the following equation: LDR = (SI of marrow lesion/SI of disc) × 100, where SI was measured from the images obtained from sagittal T1WI. In a prior report, Zhao et al. (15) described that non-degenerative disc and muscle showed similar accuracy as an internal standard to assess bone marrow pathologies in 1.5-T scanner images whereas muscle showed superior accuracy, as compared to non-degenerative disc, for the purpose in 3-T scanner images. Thus, in our study, the non-degenerative disc SI was adopted as the internal reference standard to assess marrow lesions because we used a 1.5-T MR imaging scanner. Additionally, on sagittal images, a non-degenerative disc was easier to select than non-fatty muscles. The degeneration of disc was evaluated by using Pfirrmann's grading system (16). The CER was calculated by dividing the difference between the LDR values of post- and pre-Gd-enhanced FS T1WI by the LDR value of pre-Gd-enhanced FS T1WI and according to the following equation: CER = (LDRpost Gd-enhanced FS T1WI - LDRpre Gd-enhanced FS T1WI) × 100/LDRpre Gd-enhanced FS T1WI, where LDRpost Gd-enhanced FS T1WI and LDRpre Gd-enhanced FS T1WI are the LDR of the lesion on enhanced and unenhanced images, respectively. The SI of a tissue on an MR image is not an absolute value because it is determined by coil loading, the receiver setting at the MR console, and image reconstruction parameters; thus, the SI value must be related to an internal standard (17). We set the intervertebral disc, which does not generally enhance with Gd, as the internal standard to measure the enhancement degree on pre- and post-Gd-enhanced FS T1WI.
To test whether the disc was enhanced, the signal-to-noise ratio (SNR) of each reference disc was estimated by dividing the SI of the disc by the standard deviation of the background SI. For this calculation, a third-year resident trainee drew the ROIs both for pre- and post-Gd-enhanced FS T1WI at the identical location of the images by copying and pasting the ROIs on an MR imaging work station, as described below. The mean SNRs of the discs were compared between the sequences. We presumed that the disc was an appropriate internal standard. All three parameters were recorded as percentages.
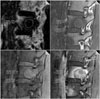
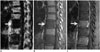
A round ROI was drawn on an MR imaging workstation by using syngo MR software (VB17, Siemens Healthcare, Erlangen, Germany). The ROI for the representative lesion was drawn as large as possible without violating the adjacent marrow. The ROI for the non-degenerative disc (selected on the sagittal T2-weighted image) was drawn at the center of the nucleus pulposus, at the same image slice of the representative lesion; the ROI was drawn as large as possible and without violating the adjacent endplate. For the LDR and CER parameters, the ROI was drawn on the images from T1WI, and the ROI was copied and pasted on the corresponding images taken from pre- and post-Gd-enhanced FS T1WI in order to obtain the measurement from the identical position for each lesion. However, the ROI for the FF was drawn at the most completely matched images and with reference to the T1WI because, given the different matrix and geometry parameters, it was impossible to copy and paste the ROI (Fig. 1).
The average values of three consecutive slices in each target lesion were calculated and recorded. A third-year resident trainee and a radiologist with 11 years of experience in musculoskeletal radiology independently drew the ROIs after the subject order was randomized.
Statistical Analysis
The interobserver agreement for measuring parameter values was assessed by using the intraclass correlation coefficient (ICC). The mean values of the parameters were used for further analyses.
By using the paired Student's t test, the mean SNRs of the reference discs were compared between the pre- and post-Gd-enhanced FS T1WI. In order to see if FF, LDR, and CER were affected by age and sex as previously reported (18), Spearman correlation coefficient and Mann-Whitney U test were conducted.
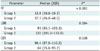
The median values and interquartile range of each group in each parameter were calculated for group 1 and 2. Since normality assumption was violated when we used the Shapiro-Wilk test (p < 0.05), we used nonparametric Mann-Whitney U test to compare the median values of the three parameters between the two groups.
Receiver operating characteristic (ROC) curves were obtained in order to evaluate the diagnostic performance of the three parameters while the sensitivities and specificities, at the most ideal cut-off values, were determined by the ROC curve. Confidence intervals for the area under the curve (AUC), sensitivity, and specificity were computed to account for sampling variation in the data. False-positive (erroneously defined as malignancy) and false-negative (erroneously defined as benign) results were counted for each parameter and were analyzed by two investigators in consensus regarding explanatory factors. For false-negative results, the pathology of the lesion was recorded. The usefulness of low signal intensity of the marrow lesions on T1WI as a tool for the differentiation between malignant and benign marrow lesions has well been validated in prior studies (19, 20), and we aimed to assess whether the FF quantification can be an additional tool for the differentiation by comparing it with CER. To compare the diagnostic performance of FF and CER, their AUCs were compared by using the DeLong test. The sensitivities and specificities of the two parameters were also compared by using McNemar's test.
All statistical analyses were performed by using SAS software (V 9.2, SAS Institute, Cary, NC, USA). P values < 0.05 were considered statistically significant.
RESULTS
All overall interobserver agreements between the two readers for measuring parameter values indicated perfect agreement. The ICC values for FF, LDR, and CER were 0.991, 0.997, and 0.965, respectively. The mean ROI size of the readers was 90.0 ± 58.6 mm2 (range, 17.2-236.5 mm2) for lesions and 22.1 ± 19.7 mm2 (range, 5.7-53.2 mm2) for discs.
The Spearman correlation coefficient for the three paramaters and age were all below 0.3 with non-significant p value (> 0.05), indicating no correlation between age and the parameters. Also, the result of the Mann-Whitney U test showed that the median values of the three parameters were not significantly different between male and female. These results advocate that age and sex would not affect our analysis.
In the reference disc SNR enhancement assessment, the mean disc SNR of pre-Gd-enhanced FS T1WI was 44.6 ± 15.4 (range, 15.5-72.0) and that of post-Gd-enhanced FS T1WI was 43.4 ± 16.0 (range, 15.1-72.2). No difference in the SNR was observed between pre- and post-Gd-enhanced FS T1WI (p = 0.168), indicating that the means discs were not enhanced and could be used as an internal standard.
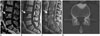
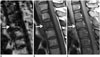
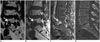
The median values of each parameter in each group are summarized in Table 2. All three parameters showed a median difference between group 1 and 2 with statistical significance (Table 2). The AUC of each parameter, the optimal cut-off values obtained from the ROC curve, and the resultant sensitivity and specificity of each parameter are summarized in Table 3. In the analyses of false-positive and false-negative results, FF showed three false-negative results (metastases from prostate [n = 1], colon [n = 1], and breast cancer [n = 1]) (Fig. 2). LDR showed four false-positive results (one from pathologically proven hypercellular red marrow; three clinically categorized as red marrow deposition) (Fig. 3). CER showed two false-positive (both categorized as red marrow deposition clinically) (Fig. 4) and seven false-negative results (metastases from rectal [n = 2], thyroid [n = 1], nasopharyngeal [n = 1], lung [n = 1], prostate cancer [n = 1], and plasma cell myeloma [n = 1]) (Fig. 5).
In the comparison of AUCs between FF and CER, the AUC of FF was significantly higher as compared to that of CER (p = 0.030). In the McNemar's test for the comparison of sensitivity and specificity between FF and CER, the difference of the sensitivity (p = 0.157), specificity (p = 0.157) was not significant.
DISCUSSION
We assessed whether FF obtained from vertebral body lesions is feasible in differentiating malignant marrow-replacing lesions from benign red marrow deposition. We focused on red marrow deposition as the benign lesion. Although we used the chemical-shift imaging method utilized in the previous studies (4, 5, 6, 7, 9, 21), we attempted to measure the FF itself, unlike these previous studies, as we thought this approach is more reasonable, as stated above. Regarding the use of marrow fat to differentiate between malignant versus benign bone marrow lesions, previous investigators focused on "signal drop" on opposed-phase imaging because they postulated the coexistence of fat and water in marrow (4, 5, 6, 7, 9, 21), which is possible when bone marrow is not completely replaced by space-occupying lesions, would cause a signal drop in opposed-phase imaging. These investigators measured the signal drop of opposed-phase imaging and suggested variable cut-off values to differentiate between various benign and malignant vertebral lesions (Table 4). With these parameters, the sensitivity and specificity of differentiating between benign and malignant lesion were 88.8-95% and 80.4-100%, respectively (4, 5, 6, 7, 9, 21). The sensitivity (85.7%) and specificity (100%) of FF in our study were comparable to those of previous studies that utilized chemical-shift imaging, indicating that our study did not show improvement in diagnostic performance of chemical-shift imaging as compared with previous studies. However, we believe our results unveiled the feasibility of FF as a tool for differentiation between benign and malignant focal bone marrow lesions, and further investigation with a larger study population is needed.
A high FF erroneously indicated that three lesions were benign: two sclerotic metastases from prostate or breast cancer and one from metastatic colon cancer. Zajick et al. (4) reported that some metastatic lesions showed a large signal drop on opposed-phase imaging, mimicking benign bone lesions. They attributed the variability of metastatic lesions from lytic to sclerotic states, with sclerotic lesions having lower SIs (4). Although Zajick et al. did not completely explain the reason for this observation, we believe that the two sclerotic lesions showing false-negative results in our study are consistent with it. We adopted three-echo Dixon integrated into the VIBE sequence. The Dixon technique is a well-established imaging sequence for discrimination between water and fat protons and is based on their resonant frequency difference (22). Three-echo Dixon technique has been developed to correct T2* decay due to intra-voxel static field inhomogeneity, which depends on tissue structure and chemical properties. Three-echo Dixon has been proven to provide highly reproducible and accurate results in fat quantification (23) as compared with two-echo Dixon without T2* correction.
Even with correction of T2* effects, FF quantification may be confounded by other effects, like the multi-spectral nature of fat (24). As a result, the three-echo VIBE-Dixon sequence may produce errors similar to those observed in previous studies that utilized other chemical-shift imaging techniques, and this topic should be investigated further. However, we have no plausible explanation for the false-negative result for colon cancer metastasis in our study.
Hypothetically, the FF values for malignant marrow-replacing lesions should be near 0% because the lesion replaces bone marrow. However, the FF cut-off value for differentiation between malignant marrow-replacing lesions and benign red marrow deposition was unexpectedly high in our study (16.8%). Although many previous studies assessed the liver rather than bone marrow, it is known that the T1 and T2* effects should be minimized to measure FF accurately because all MR signals are subject to T1 and T2/T2* relaxation (11). We believe the T2* effect was minimized in our study because we adopted a sequence that corrects the effect of T2* decay, by using signals at three different echo times, which was validated in a prior report (10). However, the 25° flip angle used in our study might have produced the T1 effect, which is known to cause FF overestimation. Cassidy et al. (11) recommended a flip angle of 5-10° and a repetition time of ≤ 100 msec to minimize the T1 effect for liver fat quantification; the sequence parameters that minimize the T1 effect for bone marrow might be different from these parameters, but we could not find any related references. Hence, we optimized our sequence empirically, and we could not minimize the flip angle to < 25°, which would have assured an appropriate image quality with respect to the SNR at the commencement of our study. We believe 25° was not adequate for minimizing the T1 effect, given the unexpectedly high FF of our study. Further validation of FF quantification sequences is needed. T1 effect reduction could be achieved by using a more accurate correction of the confounding T2* effect and multi-spectral fat nature, by using signals from more echo time points, and using a low flip angle.
The sensitivity and specificity of T1WI in previous studies that were performed with 1.5-T scanners were 62.5-100% and 92-93.8% for differentiating benign and malignant lesions, respectively (15, 20). Although the sensitivity of our study was comparable to that of these studies, the specificity was far lower due to different analysis methods (20) and the selection of benign subjects for comparison (15). Nevertheless, LDR is a sensitive method in daily practice for detection or screening of marrow signal abnormality, and we do not believe that our study supports that FF can replace LDR in that regard. Rather, we expect that the FF would play a complementary role for additional differentiation with its high specificity, which would be superior to CER, since CER showed poorer performance when compared to FF in our study. Gd-enhanced MR imaging needed to be compared with the FF measurement in the performance of differentiation between benign and malignant marrow lesions because previous studies have already elucidated its usefulness in this aspect (13, 25, 26).
Our study had several limitations. First, the small number of study subjects might have biased our results. Second, the pulse sequence for FF quantification was not validated through a bone marrow phantom because this is technically difficult. However, we have elucidated that a T2*-corrected FF map by using the three-echo VIBE-Dixon sequence, which is at least feasible for differentiating between malignant marrow-replacing lesions and benign red marrow deposition of vertebrae. Third, not all assessed lesions were pathologically proven because it would be unethical to biopsy lesions with a high probability of malignancy or benignancy in a clinical setting. Fourth, we adopted only LDR for the parameters on T1WI, although qualitative assessment of imaging findings (e.g., bull's eye sign) (27) is useful for differentiating between malignant and benign bone lesions. This reason may also explain why the specificity of T1WI was lower than expected in our study. However, this qualitative assessment was beyond the scope of our study.
In conclusion, T2*-corrected FF measurement using a three-echo VIBE-Dixon sequence is feasible and is expected to play a complementary role for distinguishing benign red marrow deposition from malignant bone marrow-replacing lesions of vertebrae.


 XML Download