

 PDF
PDF ePub
ePub Citation
 Print
Print


INTRODUCTION
Dual-energy CT (DECT) was first investigated by Macovski et al. (1) and Alvarez and Macovski (2) in 1976, more than three decades ago. Different from conventional CT imaging using a single kV value (usually 120 kVp), DECT uses two different tube potentials (e.g., [80 kVp and 140 kVp] or [100 kVp and 140 kVp]) to obtain two image datasets with different attenuation characteristics (3, 4). Different energies have a great impact on the contrast resolution and noise characteristics of the two datasets. Generally speaking, the low kVp (80 kVp) images have superior contrast resolution to high kVp images, yet inferior noise performance (5, 6).
While DECT may provide useful clinical information, the question arises as to how to best realize and visualize this benefit. In conventional single-energy CT, patient image data is presented to the physicians using well understood organ specific window and level settings. But for DECT, it is possible to mathematically mix the two datasets, in addition to independent evaluation of the separate energy-level datasets, in order to yield a single "blended" dataset with desired features of each energy-level dataset. Specifically, it has been shown that a linear blending image with a ratio of 70% 140-kVp and 30% 80-kVp yields an image with similar image characteristics as a standard 120 kVp single-energy scan (4), providing a reasonable representation of the anatomy/pathology. While Behrendt et al. (7) shared a different point of view, they recommended using the weighting factor 0.5 for image fusion in DECT angiography. However, no matter which ratio used, the advantages of each dataset (contrast or sharpness) is partially offset by its drawbacks (blurring or noise) due to the linear nature of the blending (8). In addition, it is still a challenge that dual-energy scans dramatically increase the amount of data collected by generating twice the data of single-energy scans, which in turn, must be reviewed by a radiologist. To alleviate these problems, dual-energy data need to be blended to yield a fused volume with more desirable properties.
As an alternative to linear blending, non-linear blending functions (8) can be used to optimize the blending processing. The non-linear blending of DECT data was suggested "to be" superior to linear blending algorithms, especially the moidal algorithm, which could significantly increase the contrast resolution seen in dual-energy blended images, while lowering the noise level within the image (8, 9). However, their studies are all limited to the 140/80-kVp scanning, with no consideration of the 140/100-kVp scanning which is preferable in clinical practice for the trunk of the body in overweight or obese patients (body mass index [BMI] ≥ 25) (10, 11). Moreover, currently, the more commonly used approach is the latter, with the image reconstruction system providing low- and high-kilovoltage images and a series of weighted average images which integrates both acquisitions in a low-noise image for immediate clinical evaluation (10). Also, there are still no reports of non-linear mixing algorithms of DECT on the abdominal CT angiography (CTA).
Therefore, in order to evaluate the effect of non-linear blending on arterial-phase dual-energy abdominal CTA scanning, a study comparing non-linear blending images in the Sn140/80 kVp and Sn140/100 kVp scanning modes to the corresponding standard 0.5 linear blending images and conventional CT (120 kVp) images was conducted.
MATERIALS AND METHODS
This research protocol was approved by the Institutional Review Board of our institution, and all patients provided written informed consent before participation.
From October 2011 to September 2013, 156 patients accepted abdominal CT angiography on a second-generation dual-source CT. Among them, 101 were acquired with dual-energy scan mode and 55 patients with conventional single-energy scan mode. Patients were enrolled if they had one or more of the following inclusion criteria: abdominal pain, previous mesenteric ischemia, previous abdominal angina, severe vascular disease such as aneurysm, monitoring of untreated abdominal aortic aneurysm, and endovascular repair with stent of iliac stenosis. Patients were considered ineligible if they had any contraindication to iodinated contrast material, such as a previous history of anaphylactic reaction or impaired renal function (glomerular filtration rate < 30 mL/min). Finally, thirty-eight patients were excluded from the study because of: 1) image artifacts caused by motion (n = 8) or failure to hold their breaths (n = 10); 2) a wide range of abdominal aortic stent implantations (n = 14); or the presence of residual barium in the small intestine (n = 6).
One hundred and eighteen patients (60 men and 58 women; mean age, 54 years; age range, 41-82 years) were included in our study. For patients who had accepted DECT scanning, 40 patients were assigned to protocol A (Sn140/80 kVp) (22 males; mean age, 52.1 ± 20.1) with BMI < 25 and 41 patients to protocol B (Sn140/100 kVp) (19 males; mean age, 55.2 ± 11.5) with BMI ≥ 25. For patients who had accepted single-energy CT (SECT) scanning, 37 patients were enrolled as protocol C (19 males; mean age, 54.7 ± 12.6) regardless of BMI.
CT Examination
All patients were examined with a second-generation dual-source CT scanner (Somatom Definition Flash, Siemens, Forchheim, Germany). The scanner can be operated in dual-source dual-energy mode and standard SECT mode with all scans acquired in the craniocaudal direction from above the level of the diaphragm to below the level of the symphysis pubis during the arterial phase (AP) and portal venous phase (PVP).
In dual-energy acquisition mode, data were acquired at different peak kilovoltage settings of tube B for the two different groups of tubes according to patients' BMI: (protocol A [when BMI < 25]: tube A, 140 kVp; tube B, 80 kVp) and (protocol B [when BMI ≥ 25]: tube A, 140 kVp; tube B, 100 kVp). In protocol A, the tube voltage and the current of the two tubes were Sn140/80 kVp and 178/461 mAs with the automatic tube current modulation. In protocol B, the tube voltage and the current of the two tubes were Sn140/100 kVp and 178/230 mAs with the automatic tube current modulation. The other parameters were kept the same between protocol A and B. These parameters included: collimation, 32 × 0.6 mm; gantry rotation time, 0.5 second; pitch 0.7-0.9; reconstruction thickness and interval; 1 mm. The field of view covered by the standard single-source detector was 50 cm2, with the reference tube current-time product values of 250 mAs for the 120 kVp tube (protocol C).
Patients were injected with nonionic contrast materials (iohexol, Omnipaque; 350 mg I/mL, GE Healthcare, Milwaukee, WI, USA) with antecubital venous access at a rate of 4 mL/sec; a total of 60.100 mL (1.2 mL/kg) was injected, with a power injector (Envision CT Injector, Medrad, Georgia, USA) through a 20-gauge catheter inserted into an antecubital vein. The scanning delay for AP imaging was determined using automated scan-triggering software (SmartPrep; GE Healthcare, Milwaukee, WI, USA). AP scanning automatically began 7 seconds after the trigger attenuation threshold (100 Hounsfield units [HU]) had been reached at the level of the supraceliac abdominal aorta. After this, PVP acquisition was obtained 60-70 seconds after the injection of the contrast agent had begun.
Image Processing
All images were evaluated at a workstation (MultiModality Workplace; Siemens Medical Solutions, Erlangen, Germany) in the standard transverse plane. After the acquisition of dual-energy mode, we mixed the image datasets using linear blending and non-linear blending. The linear mixing images were reconstructed using a ratio of 0.5.
Non-linear blending including a binary blending function, a slope blending function, a gaussian function, and a modified sigmoid function, can be used to refine the blending process. Among them, the non-linear blending images based on a modified sigmoid function, which is referred to as "optimum contrast", are generated by using the software of optimal contrast in Syngo workstation (Siemens Medical Solutions, Erlangen, Germany). The modified sigmoid blending function is an example of an algorithm that has two parameters of λ and ω, the level and width, defining the window for the different blending ratios of low- and high-tube potential images pixel-by-pixel. Use of these two parameters strongly weighs the low attenuation values toward the 140 kVp image and the high attenuation values toward the 80 kVp. Accordingly, since it is high attenuation values which are differentiated between 140-kVp and 80-kVp scans, there is the potential for improved contrast. This process of shifting the CT values thus serves to enhance the high-contrast objects and reduce the noise of low-contrast objects. In our study, the default values of these two parameters (λ = 150 HU, ω = 120 HU) were selected. The selection of a default value for λ was due to the attenuation of the abdominal aorta, which was > 150 HU. Therefore, if these vascular CT values are greater than 150 HU, the advantage of high contrast will be the most due to the heavy weight of 80 kVp or 100 kVp components in the moidal non-linear blending images.
Image Analysis
A single reviewer with five-year experience performed quantitative analysis on the same workstation. The attenuation values (i.e., CT number [in HU]) of the abdominal vessels were obtained by placing a manually defined 1-2 cm2 region of interest (ROI) on all of the blending (linear blending and non-linear blending) dual-energy images in protocol A and B, and 120 kVp images in protocol C in the arterial phase. The images were magnified, and care was taken to avoid calcifications. The ROIs were placed in abdominal aorta, celiac trunk, splenic artery, renal artery, superior mesenteric artery. The ROI was maintained as large as possible, copied and placed at the same z-axis position on all datasets. Image noise, defined as the standard deviation of the pixel values from a circular or ovoid ROI drawn in a homogeneous region of the subcutaneous fat of the anterior abdominal wall, was performed for these datasets in each group (12). To ensure consistency, all measurements were repeated three times at the three contiguous imaging levels and the average values were calculated. For all measurements, the size, shape and position of the ROIs were kept consistent between the two phases by applying the copy-and-paste function.
In addition, attenuation of the central parts of latissimus dorsi and the psoas muscle muscles was measured on both sides and averaged (ROImuscle). On the basis of these measurements, signal-to-noise ratio (SNR) and contrast-to-noise ratio (CNR) were calculated according to the following equations: SNR = ROIvessel / SDfat and CNR = (ROIvessel - ROImuscle) / SDfat, where ROIvessel and ROImuscle were the mean attenuation of the targeted vessel and muscles, and SDfat was the standard deviation of the pixel values from the homogeneous subcutaneous fat of the anterior abdominal wall.
In addition, subjective overall image quality of blending images (linear blending and non-linear blending) in each protocol and 120 kVp images in protocol C was assessed by two readers independently by using transverse sections and the maximum intensity projections. For evaluation of subjective image quality, a five-point scale based on the visualization of the branch order of the renal artery and image noise was applied: 5, excellent (4th or higher order branches), no obvious image noise and artifacts; 4, superior (3rd order branches), mild image noise and artifacts; 3, diagnostic (2nd order branches), moderate image noise and artifacts, optimal enhancement but insufficient for diagnosis; 2, suboptimal (main or 1st order branches), severe image noise and artifacts, inadequate for diagnosis; 1, poor (vessels not seen), severe image noise and artifacts, no diagnosis possible.
Radiation Dose Evaluation
Scan length (distance covered) was documented for every protocol. The radiation dose in CT dose index (CTDIvol, mGy) from both examinations (DECT and SECT) was recorded for each patient from the provided image capture of CT dose. Estimation of the effective dose was performed on the basis of the dose-length product (DLP, mGy·cm) converted using a standardized conversion factor of 0.015 for abdominal examinations.
Statistical Analysis
All statistical calculations were performed with a software package (SAS, version 9.1.3; SAS, Cary, NC, USA). P < 0.05 indicated a statistically significant difference. Continuous variables were reported as means ± standard deviation, and categorical variables were reported as frequencies or percentages. A repeated-measures analysis of variance calculation with the least significant difference post hoc comparison tests was performed to compare age, sex, BMI, and effective dose among the three protocols, and was also used to compare vessel enhancement, image noise, SNR and CNR among non-linear blending image sets in protocol A (or B), linear blending image sets in the same protocol and the conventional 120 kVp image sets in protocol C. The independent t test was used to compare mean vascular attenuation, CNR and SNR in the non-linear blending images (or linear blending images) between protocol A and protocol B. Kruskal-Wallis tests were used to determine the results of the qualitative analysis. When statistically significant differences occurred, Mann-Whitney U test was performed for single posttest comparisons.
The inter-rater agreement was calculated by using Cohen κ values. Agreement was determined as follows: For κ values less than zero, no agreement; for κ values of 0-0.20, slight agreement; for κ values of 0.21-0.40, fair agreement; for κ values of 0.41-0.60, moderate agreement; for κ values of 0.61-0.80, substantial agreement; and for κ values of 0.81-1.00, almost perfect agreement (13).
RESULTS
No significant difference in sex ratio and age was found among the three protocols (all p values > 0.05). BMI for protocol B (25.9 ± 1.9) was significantly higher than that for protocol A (21.5 ± 2.8) and protocol C (22.6 ± 2.6) (both p < 0.001). There was no significant difference in BMI between protocol A and C (p = 0.088).
Image Analyses
Vascular Attenuation
Tables 1 and 2 respectively showed the comparative results for vascular attenuation among non-linear blending images and linear blending images in protocol A/protocol B, 120 kVp images in protocol C. In both protocol A and protocol B, the mean attenuation of the five points (abdominal aorta, celiac trunk, splenic artery, renal artery, superior mesenteric artery) measured in the abdominal vessels at non-linear blending images was significantly higher compared to the corresponding linear blending images (protocol A, 507.3 ± 127.1 HU vs. 355.5 ± 78.0 HU; protocol B, 351.7 ± 71.6 HU vs. 271.9 ± 46.9 HU), with an average increase of 42.7% in protocol A and 29.4% in protocol B. Compared to 120 kVp images (289.4 ± 59.3 HU), non-linear blending images in both protocols A and B were significantly higher, almost 1.75 times higher in protocol A and 1.22 times higher in protocol B.
Compared with 120 kVp images in protocol C, mean vascular attenuation was nearly the same on linear blending images in protocol B and significantly higher on linear blending images in protocol A.
CNR and SNR
In protocol A, mean CNR (64.1 ± 34.4) and SNR (71.7 ± 39.7) of non-linear blending images were both significantly higher than those in the linear blending images (CNR, 44.1 ± 22.6; SNR, 52.4 ± 24.7) as well as 120 kVp images (CNR, 31.1 ± 10.1; SNR, 37.3 ± 11.3). CNR and SNR in the linear blending images were both higher than those in 120 kVp images (Table 3).
Similarly, in protocol B, mean values of the non-linear blending images in CNR (37.4 ± 22.5) and SNR (43.7 ± 24.7) were all significantly higher than those in the linear blending images (CNR, 24.6 ± 10.6; SNR, 30.6 ± 12.5). However, there were no significant differences in CNR and SNR between non-linear blending images and 120 kVp images, as well as between linear blending images and 120 kVp images (Table 3).
Mean vascular attenuation, CNR and SNR in the non-linear and linear blending images in protocol A were all much higher than those in protocol B (all p values < 0.001).
Image Noise
There were no significant differences among non-linear blending images (protocol A, 8.5 ± 3.8 HU; protocol B, 9.4 ± 3.2 HU), corresponding linear blending images (protocol A, 7.9 ± 2.5 HU; protocol B, 9.8 ± 3.3 HU) and 120 kVp images (8.3 ± 2.5 HU) (all p values > 0.05).
Subjective Overall Image Quality
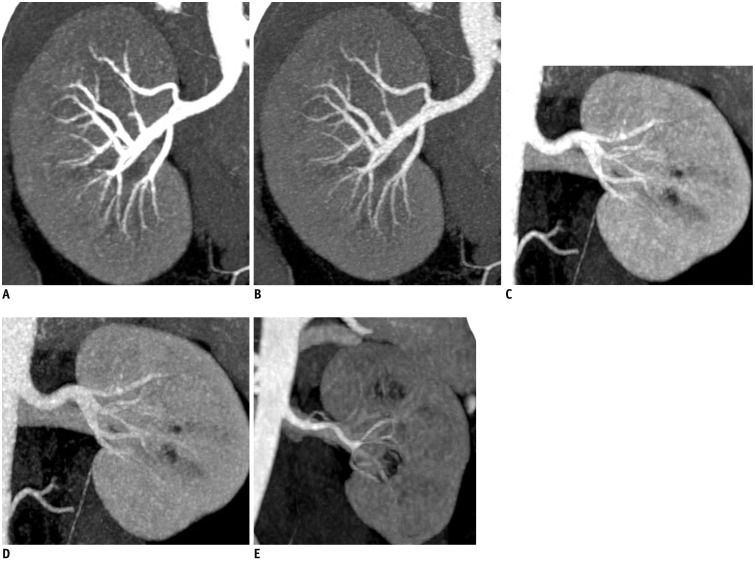
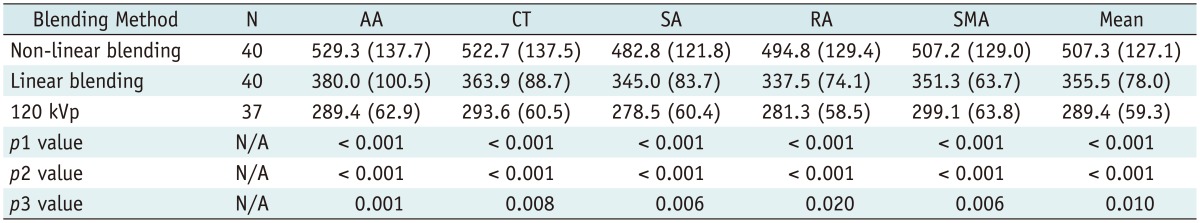
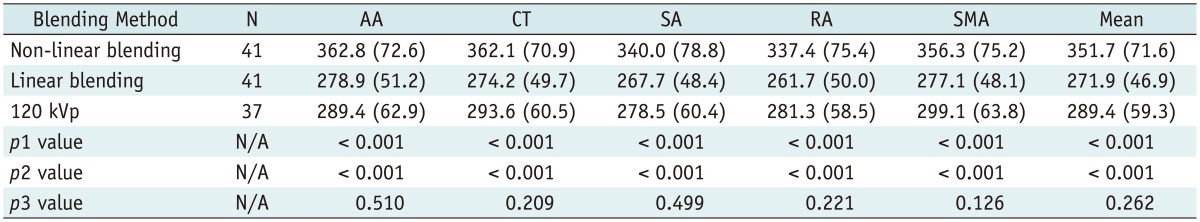
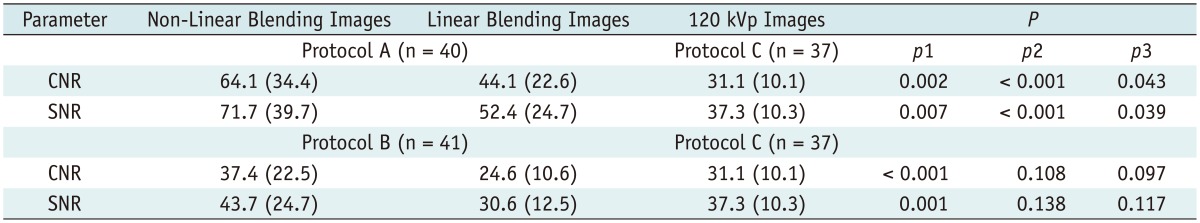
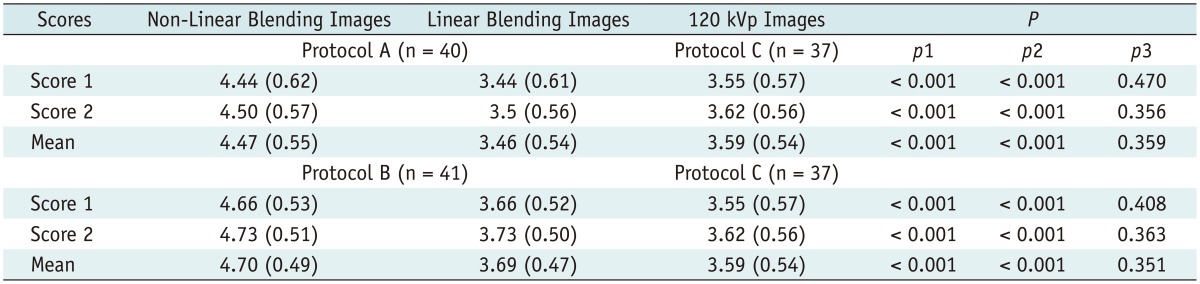
Table 4 showed the qualitative assessment of image quality among non-linear blending images, linear blending images and 120 kVp images. Compared to the corresponding linear blending images and 120 kVp images, the non-linear blending images scored higher in image quality for both readers (mean scores in protocol A, 4.47 ± 0.55; protocol B, 4.70 ± 0.49) (Fig. 1). However, the scores were similar in between the linear blending images (mean scores in protocol A, 3.46 ± 0.54; protocol B, 3.69 ± 0.47) and 120 kVp images (3.59 ± 0.54).
The inter-rater agreement with regard to the overall image quality revealed a κ value of 0.75 and 0.78 for non-linear blending images and linear blending images, respectively, in protocol A, 0.80 and 0.78, respectively, in protocol B, and 0.83 for 120 kVp images in protocol C.
Radiation Dose
On the basis of our protocols, the CTDIvol, DLP and effective radiation dose in the arterial phase for the CTA acquisition in protocol B (11.6 ± 4.8 mGy, 550.1 ± 190.9 mGy·cm, and 8.3 ± 2.9 mSv) and protocol C (10.9 ± 3.1 mGy, 568.7 ± 195.6 mGy·cm, and 8.5 ± 2.9 mSv) were all higher compared to those in protocol A (8.5 ± 2.1 mGy, 441.0 ± 111.3 mGy·cm, and 6.6 ± 1.7 mSv) (all p values ≤ 0.001). However, no significant difference was found between protocol B and protocol C (all p values > 0.05).
DISCUSSION
Historically, linear blending functions have been used to balance the advantages/disadvantages of low kVp (high contrast/more noise) (14, 15, 16, 17) and high kVp (low contrast/less noise) in different tube potentials of dual-tube, dual-detector CT system. However, the linear blending algorithm only allowed adjustment of the mixing ratio which was fixed at this value independent of voxel CT Number (HU). The uniform application of a fixed weighting function for all pixels reduces both noise and signal. By contrast, a moidal non-linear blending method based on a modified sigmoid function has two parameters of λ and ω to define the window for the different blending ratios of low- and high-tube potential images pixel-by-pixel. Use of these two parameters can yield a result which serves to enhance the high-contrast objects and to reduce the noise of low-contrast objects by shifting the low attenuation values toward the 140 kVp image and the high attenuation values toward the 80 kVp.
Our study demonstrated the result that non-linear blending had increased vascular attenuation, CNR and SNR compared to the 0.5 linear blending in the abdominal vessel evaluation in both protocols A and B. These findings were also consistent with the findings of Holmes et al. (9) and Kartje et al. (18). Compared to the non-linear or linear blending images for protocol B, mean vascular attenuation, CNR and SNR in the non-linear or linear blending images for protocol A were all much higher (all p values < 0.001). This might be due to the fact that reducing the tube voltage has great potential for high contrast. Moreover, in the moidal non-linear blending images, the advantage of high contrast was made the most due to the heavy weight of low kVp components, especially in protocol A which showed a higher increase of vascular CT values.
Compared to 120 kVp images, the non-linear blending images and linear blending images for protocol A showed improved mean vascular attenuation, CNR and SNR, while protocol B showed no significant difference expect the slightly higher mean vascular attenuation in the non-linear blending images. This could also be due to the characteristics of low kVp images. The attenuation of iodine will be much greater at low kVp (80 kVp) than at high kVp (100 kVp and 140 kVp). Compared to low kVp images, high kVp images had inferior contrast resolution (4, 5). Thus, the image contrast in the non-linear blending images was also lower in protocol B than protocol A.
There was no significant difference in image noise among the three protocols, which contrasted the study of Eusemann et al. (8) who thought that the moidal algorithm can lower the noise level within the image. The differences between the two studies in image noise may partially be explained by different fusion coefficients used in the linear fusion. They compared the moidal method to a fixed linear blend of 0.3, instead of 0.5 in our study demonstrated by Behrendt et al. (7) to display the highest SNR values in vessels and the highest score in the visual image assessment in DECT angiography. The result of similar image noise between low kVp and high kVp was also contrasted with the previous results of some researchers (4, 5, 19) who had found that low peak tube voltage (kVp) settings of dual-energy data sets resulted in high image noise in the abdomen. The differences may be due to patient grouping. The lower BMI in protocol A could compensate for the high noise caused by lower kVp (80 kVp).
Additionally, in the present study, because of the higher intravascular attenuation but similar image noise, non-linear image blending images scored significantly better for image quality than linear image blending images and 120 kVp images; this was similar to the work of Ascenti et al. (20) who had also found that the non-linear image blending algorithm improves image quality compared to standard linear image blending. Thus, combined with the low radiation dose characteristics of Sn140/80 kVp scanning, we believe non-linear image blending in patients with BMI < 25 is better than that in patients with BMI ≥ 25.
However, there were still some limitations in our study. First, the number of patients studied was small. However, given the fact that non-linear blending technique has not been studied extensively, the results are significant; and, to our knowledge, only a small amount of data have been published regarding abdominal CT angiography with non-linear blending in Sn140/80 kVp and Sn140/100 kVp DECT. Second, these results are mainly applicable to CT angiography and therefore, may not be valid for evaluation of other abdominal structures. But the advantage of non-linear blending image in high contrast and improved image quality would be useful for reducing contrast agent dose for CT angiography in clinical practice. Third, we did not compare the performance in terms of the actual lesion detection and characterization. Further study on these issues would be needed. Fourth, the values of the non-linear blending parameters were selected according to the vendor's default (λ = 150 HU, ω = 120 HU) instead of the phantom study. The selection of a default value for λ was due to the attenuation of the abdominal aorta, which was > 150 HU. Thus, our results would not be affected since the target vessel of our study was the aorta with its attenuation higher than 150 HU. Under conditions where the vascular attenuation is higher than 150 HU, non-linear image blending could improve vessel opacification significantly because of the heavy weight of 80 kVp or 100 kVp components. Up till now, the parameter selection by scan type and dose settings has still remained a challenge in assessing non-linearly blended images. Fifth, the patients enrolled to protocol C (120 kVp) were not assigned according to BMI. However, this is more in line with our clinical practice that patients often undergo conventional CT scanning with 120 kVp tube regardless of BMI. Finally, our study has proved that non-linear (sigmoid) blending could improve the image quality by improving CNR in high intensity and decreasing noise in low intensity. However, some delicate structures such as fatty streak or smaller arterial wall thickening could be hidden by excess image contrast.
In conclusion, for the arterial-phase dual-energy abdominal CTA scanning, non-linear blending of dual-energy data in both the Sn140/80 kVp and Sn140/100 kVp scanning mode showed improved vascular attenuation, CNR and SNR compared to 0.5 linear blending and conventional CT (120 kVp); however, it displayed similar results in the Sn140/100 kVp scanning mode compared to conventional CT. And there was a clear preference for the non-linear blending images in the subjective image quality. The Sn140/80 kVp protocol with non-linear blending is recommended for normal weight patient for its high vascular contrast, low radiation dose, but without much image quality degradation. This would make it possible to maintain good image quality of abdominal CTA while allowing reducing the dose of contrast medium and radiation to the patient. Further study on the relationship between reduction contrast agent dose and parameter optimization of non-linear image blending is needed.
 XML Download