

 PDF
PDF ePub
ePub Citation
 Print
Print


INTRODUCTION
Delayed gadolinium-enhanced magnetic resonance imaging (MRI) of cartilage (dGEMRIC) and T2 mapping are two compositional assessment techniques for MRI that are widely used to assess the physiologic composition of articular cartilage of the knee (1-5). dGEMRIC has been shown to be able to characterize the spatial glycosaminoglycan (GAG) concentration in tissue (6-8), while T2 relaxation time has been shown to reflect the collagen network architecture in cartilage (9-11). As the contrast agent Gd-DTPA2- may affect the inherent T2 of cartilage in a non-constant manner (12), T2 mapping and dGEMRIC are typically conducted in two separate MRI sessions in 90-minute intervals. The duration of the total acquisition time is usually long (up to two hours), and this time-consuming process can be clinically ineffective and inconvenient for patients.
Gd-DTPA2- is needed for dGEMRIC, and although it affects the inherent T2 information, recent studies have shown good agreement between pre- and post-contrast T2 values with good reproducibility in human cadaver knees along with other pilot clinical studies with intact cartilage (12, 13). These studies have suggested that combined dGEMRIC and T2 analyses in the presence of Gd-DTPA2- during a single imaging session would be advantageous. In the present study, we expanded upon two previous studies using high-resolution MRI and T2 mapping with and without the presence of Gd-DTPA2- to characterize the articular cartilage of the human knee in vivo from six different anatomical sites in patients with varying degrees of osteoarthritis.
Thus, the purpose of this study was to evaluate the relationship between T2 values of pre- and post-contrast MR images of the femoral cartilage of the knee joint in patients with varying degrees of osteoarthritis and to assess whether there is agreement or correlation between pre- and post-contrast images. Reproducibility of T2 measurements taken using the current setup was also investigated.
MATERIALS AND METHODS
Patient Population
The institutional review board of our institution approved this retrospective study, and informed consent was not required. From November 2011 to March 2012, 21 patients who were previously evaluated at the orthopedic clinic in our institution were selected for routine diagnostic MRI of unilateral knee joint. Quantitative T2 mapping and dGEMRIC were additionally performed in 21 patients for osteoarthritis evaluation. Among these patients, two were excluded because their post-contrast T2 images were not available. Finally, 19 patients (8 men, 11 women; mean age, 55.6 years; range, 35-75 years) were included in the study.
Image Acquisition
All MRI examinations were performed using a 1.5-T unit (Magnetom Avanto; Siemens Medical Solutions, Erlangen, Germany) with a dedicated knee coil. A custom leg holder, with the knee at approximately 20° of flexion, was used to minimize motion and to position the coil. To optimize reproducibility in positioning, the same individual positioned all the patients in the study. Initially, MRI was performed without contrast agent; 0.2 mmol/kg of Gd-DTPA2- (Magnevist, Bayern Schering, Germany) was then slowly administered into the right antecubital vein followed by saline flush with the patient lying supine for the dGEMRIC technique (14). After injection, the subjects walked for fifteen minutes to facilitate contrast distribution in the cartilage (14, 15). Ninety minutes after injection (14, 15), MRI was repeated. To evaluate the femoral cartilage of the knee joint, sagittal, multi-slice, multi-echo, source images were used for T2 map construction with six different TEs, 15, 30, 45, 60, 75 and 90 ms, similar to ones used by the Osteoarthritis Initiative study (16, 17). T2 maps were obtained using a pixel-wise, mono-exponential, non-negative least squares fit analysis. The details of the MR protocol are as follows: TR, 2200 ms; FOV, 15 cm; acquisition pixel size 0.5/0.5/0.5 mm; slice thickness, 3 mm; flip angle, 180°; number of signals averaged, 1; bandwidth, 226 Hz/pixel; echo train length, 1; slices, 21; scan time, 3:35 minutes.
T2 Measurement
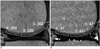
Six femoral cartilage regions were differentiated by manual segmentation of MR images into regions of interest (ROI) by a radiologist with three years of musculoskeletal MRI interpretation experience. First, a mid-sagittal section of both medial and lateral femoral condyles was selected, and cartilage was then divided into three equal parts in the anteroposterior direction between the anterior and posterior margins of the femoral articular cartilage (Fig. 1). The anterior and posterior margins of the femoral articular cartilage were defined as the anterior and posterior margins of the meniscus in the sagittal plane, respectively. The six regions were designated as follows: anteromedial (M1), middle-medial (M2), posteromedial (M3), anterolateral (L1), middle-lateral (L2) and posterolateral (L3). T2 values were measured using a clinical workstation (Viewforum, Philips Medical Systems, The Netherlands) and were calculated as the mean pixel value of a ROI on a map of T2 relaxation time. This software allows for the manual selection of ROI within sagittal T2-weighted images and for direct comparison of mean pixel values between the ROI in the T2-weighted image and the corresponding ROI on the T2 map. The sagittal, T2-weighted image that best differentiated subchondral bone, articular cartilage, and joint fluid from the femoral cartilage was selected among the six different echo times of T2-weighted images to outline ROI over the cartilage. ROIs drawn on a particular echo time were automatically matched to the T2 map. We then measured the mean pixel values of corresponding ROIs on the T2 map. The measurement was applied to T2 maps of both pre- and post-contrast images, and each T2 value was obtained three times with two-week intervals between measurements by the same radiologist. Regions classified as a modified Noyes classification grade 0 (normal cartilage), 1 (increased T2 signal intensity within morphologically normal cartilage), and 2A (superficial partial-thickness cartilage lesion less than 50% of the total thickness of the articular surface) were included (18, 19). Modified Noyes classification grade 2B (deep partial-thickness cartilage lesion greater than 50% of the total thickness of the articular surface) or grade 3 (full-thickness cartilage lesion) chondral lesions were excluded from T2 measurement, because these cartilages were too thin or absent to draw an ROI appropriately (18, 19).
Statistical Analysis
Statistical analyses were performed using SPSS version 18 statistical software for Windows (SPSS; SPSS Inc., Chicago, IL, USA). The paired t test and Pearson correlation coefficients were performed to compare overall T2 values from pre- and post-contrast images. For comparison of T2 values from pre- and post-contrast images, and differences in T2 values between pre- and post-contrast images among regions with the grade 0, 1 and 2A groups, Tukey's test and paired t test were used. A p value of < 0.05 was considered to be statistically significant. These analyses were also performed separately for each of the six different regions. Intraclass correlation coefficients (ICC) were calculated as an index of intraobserver reliability.
RESULTS
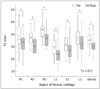
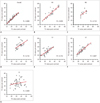
Of a total of 114 segmentations in 19 patients, 79 showed modified Noyes classification grade 0 (n = 46), 1 (n = 18), or 2A (n = 15) chondral lesions and were analyzed. The mean overall T2 cartilage values were 35.3 ± 9.2 (mean ± SD) for pre-contrast images and 29.9 ± 8.2 for post-contrast images. The overall cartilage T2 values on post-contrast imaging were significantly lower than those on pre-contrast imaging (p < 0.001) (Fig. 2). Pearson correlation coefficients for the overall cartilage T2 values showed a strong positive correlation between pre- and post-contrast images (rho-Pearson = 0.839) (Fig. 3). The ICC showed "almost perfect" agreement (0.822) on pre-contrast imaging and "substantial" agreement (0.797) on post-contrast imaging for the overall cartilage T2 value.
Comparison of T2 values between pre- and post-contrast imaging and ICC for each of the six regions are presented in Table 1 and Figure 2. The mean T2 values of the M1, M2, M3, L1, L2, and L3 regions on pre-contrast imaging were 38.6, 37.6, 43.4, 28.9, 31.9 and 36.9, respectively, and were 33.8, 30.8, 36.4, 23.9, 27.1 and 32.6 on post-contrast imaging, respectively. All post-contrast T2 values from individual regions were significantly lower than those of pre-contrast images (p < 0.01). Differences in individual T2 values between pre- and post-contrast images were constant among the six regions. Pearson correlation coefficients showed a strong positive correlation between pre- and post-contrast images (rho-Pearson = 0.712-0.905) (Fig. 3). The ICC showed "almost perfect" or "substantial" agreement (0.748-0.941) on both pre- and post-contrast images.
Comparison of T2 values between pre- and post-contrast imaging among a group of regions with grade 0, 1 and 2A is presented in Table 2. The T2 values of the grade 0 group from pre- and post-contrast imaging were significantly lower than those of the grade 1 group (pre T2, p = 0.006; post T2, p = 0.012). However, difference in T2 values between preand post-contrast images between a group of regions with grade 0 and group 1 were not significantly different (p = 0.377). Likewise, T2 values of pre- and post-contrast images of the grade 0 group were significantly lower than those of the grade 1/2A group (pre T2, p = 0.003; post T2, p = 0.006). However, differences in T2 values between pre- and post-contrast images were not significantly different in the grade 0 and grade 1/2A groups (p = 0.096).
The mean T2 values of grade 0 from pre- and post-contrast imaging were 33 ± 5.1 and 28.4 ± 5.2, respectively. T2 values of pre-contrast images of the grade 0 group were significantly higher than those of post-contrast images (p < 0.01).
DISCUSSION
Our study demonstrates two main findings. First, the overall and individual post-contrast T2 values from the femoral cartilage of the knee joint were significantly lower than those of pre-contrast images. Second, differences in individual T2 values between pre- and post-contrast images were constant among the six regions and had a strong positive correlation.
Currently, T2 mapping and dGEMRIC techniques are performed during separate MRI scan acquisitions because they detect different cartilage components (6-11) and Gd-DTPA2- seems to provide a competing relaxation pathway to the inherent T2 mechanisms. Nevertheless, it is not clear how meaningful an impact this alternate pathway has on the physiologic values of T2 in the presence of Gd-DTPA2-. Two recent studies have shown reproducible agreement between pre- and post-contrast T2 values in human cadaver knees as well as in pilot clinical studies with intact cartilage (12, 13). The authors of these studies concluded that the impact of Gd-DTPA2- is not great enough to alter T2 values; however, there have thus far been no clinical trials evaluating the effect of Gd-DTPA2- relative to the inherent T2 mechanisms in the areas of T2 osteoarthritic lesions.
In this study, unlike previous studies, the overall mean and individual T2 values of six regions on post-contrast images were significantly lower than those on pre-contrast images (p < 0.01). Furthermore, the differences in T2 values between pre- and post-contrast images in each of the six regions were constant (Figs. 2, 3). Our results may differ from those of previous studies because our study examined pathologic cartilage, while previous studies examined intact cartilage. Unlike intact cartilage, pathologic cartilage may exhibit significant T2 shortening due to elevated concentrations of contrast agent (5). Additionally, native T2 relaxation times were longer in our study, resulting in higher pre-contrast T2 values than in previous studies on intact cartilage. In the present study, the mean T2 value of pre-contrast images of the grade 0 group were significantly lower than those of post-contrast images (p < 0.01). Our patient population included subjects with clinically suspicious osteoarthritis, not healthy ones. We assume that our results may reflect early pathologic changes in the molecular level, which are not applicable to the modified Noyes classification, a grading system based on structural changes.
Downward-shifted T2 values on post-contrast images in this study suggest the possible simulation of pre-contrast T2 values using corrective schemes like back-calculation. Previously, the back-calculation approach was established for correcting post-contrast T1 values (20) and post-contrast T2 values (13, 21). Overall, these assumptions provided reasonable correction for T2 values affected by the presence of Gd-DTPA2- in physiologic conditions. This back-calculation may be necessary for pathologic conditions such as osteoarthritis. Therefore, it may be beneficial for future clinical trials involving dGEMRIC and T2 techniques to use only one scanning session instead of two.
Regional differences in T2 may be caused in part by the varying orientation of the articular surface in terms of the magic angle effect (22). Medial T2 values were slightly higher than lateral T2 values in this study, probably because osteoarthritic changes can be more severe in the medial compartment than in the lateral compartment due to increased physical stress on the weight-bearing medial portion. Since increasing T2 values are associated with the severity of osteoarthritis (23), higher T2 values in the medial compartment reflect more advanced arthritic changes.
Our study has several limitations. First, this was a retrospective study with a small number of subjects. Second, we did not compare the results from our osteoarthritis group with those from a healthy control group. Also, we did not correlate lesion grades with arthroscopic findings. Third, we did not study depth-wise T2 measurements. T2 values vary with depth of the articular surface due to collagen fibril orientation to the constant magnetic induction field (24). Moreover, as cartilage GAG concentration increases from surface to bone, accumulation of Gd-DTPA2- varies under equilibrium conditions and creates a non-uniform Gd-DTPA2- concentration distribution (8). This may potentially lead to depth-dependent shortening of T2 and may impair the diagnostics of early cartilage degeneration with the use of T2 measurements in the presence of Gd-DTPA2-. One study showed pre- and post-contrast T2 measurements with highly similar depth-dependent information in intact human cartilage (12). The authors proved statistically significant linear correlations between zone thicknesses as determined from pre-contrast T2 values and post-contrast T2 values for superficial, middle and deep tissue zones, and suggested dGEMRIC and T2 measurements in one MRI session are feasible for intact articular cartilage in vitro (12). However, studies on pathologic human cartilage have not yet been conducted. Hence, more advanced analysis schemes for T2 values are required.
In conclusion, although the results of our study indicated that T2 values of post-contrast images of the femoral cartilage of the knee joint were significantly lower than those of pre-contrast images, these T2 values have a strong positive correlation between pre- and post-contrast images. Also, T2 values of pre- and post-contrast images of the modified Noyes classification grade 0 group were significantly lower than those of the grade 1/2A group. Therefore, combined dGEMRIC and T2 analyses in the presence of Gd-DTPA2- during a single MRI session may be useful for the diagnosis of knee joint osteoarthritis.


 XML Download