

 PDF
PDF ePub
ePub Citation
 Print
Print


INTRODUCTION
The reported sensitivity and specificity of MR imaging for diagnosis of meniscal tears ranged from 68.4-92.7% and 76.1-95.2% respectively (1). Although the sensitivity and specificity of MR imaging was relatively high, their ranges were too wide. Many studies have been carried out with the aim of finding causes of low diagnostic ability of MRI. Some investigators (2-4) have suggested the use of MR sequences and imaging planes, arthroscopy as the reference standard, and that the presence of only subtle or minimal tear of the meniscus can cause various errors in MR interpretation, as encountered in daily practice.
Various histologic changes of the meniscus can be reflected on the MR image in two ways: shape alteration or signal intensity change of the meniscus. The MR diagnosis of the meniscal tear largely depends on the presence of abnormal high meniscal signal intensity. Since the first description of the MR grading system for abnormal high meniscal signal intensity was reported by Lotysch et al. (5), MR grades 1, 2 and 3 have been used widely for staging abnormal high meniscal signal intensities. MR grade 1: a small focal area of increased signal intensity on T2-weighted images, which does not extend to the articular surface, grade 2: linear areas of increased signal intensity, with no extension to the articular surface, and grade 3: abnormal high signal intensity of the central portion of the meniscus, extending to at least one articular surface, usually indicating a definite meniscal tear.
However, in later reports (6-9), MR grade 2 was occasionally found to be associated with a definite meniscal tear on arthroscopic examination. Therefore, the category was subdivided into 2A, 2B, and 2C according to the size of the area occupied by abnormal high signal intensity. 2A means linear abnormal signal intensity not contacting an articular surface, 2B, abnormal signal intensity in contact with the articular surface on a single image, 2C, extensive wedge-shaped abnormal signal intensity not in contact with an articular surface. Dillon et al. (7) showed that 50% of those graded 2C had meniscal tears on arthroscopic examination. Therefore, the correlation between the high signal intensity of the meniscus on MR image and histology needs to be clarified.
The purpose of this study was to document the causes of high signal intensity of the meniscus on MR image using the correlation between the MR image and histological examination to overcome false-positive and false-negative MR diagnosis.
MATERIALS AND METHODS
This prospective study protocol was approved by the institutional review board of our institution and written informed consent was obtained from all patients.
MR Imaging of Preoperative Meniscus and Its Specimen
First, we needed to determine whether there were differences in the MR findings of preoperative knee meniscus and the obtained specimen. Therefore, MR examinations of the knee joints of five patients (mean age, 68 years; age range, 51-80 years) were performed preoperatively. We obtained five lateral menisci from their knee joints during total knee replacement surgeries. We compared the shapes and signal intensities of the menisci on both the MR images of the preoperative menisci and those of the meniscal specimen. The average delay between the surgery and MR imaging of the retrieved meniscus was less than one day.
Meniscal Specimen Preparation and MR Examination
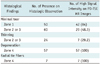
We obtained 31 menisci (16 medial and 15 lateral) from 21 patients (one man, 20 women; 12 right and 9 left) with osteoarthritis of the knee who had undergone total knee replacement. The patients ranged in age from 53 to 82 years, with a mean age of 71 years. In some cases, the obtained menisci were not complete, depending on the surgical procedure. Meniscal specimens with severe degenerative complex tear were discarded because superior or inferior meniscal surfaces had not remained and the general circular shape of the meniscus was lost.
For MR imaging, each of 31 menisci was cut into three segments, anterior horn, body and posterior horn and 46 segments of 93 segments were discarded because of their severe degenerative complex tear. A total of 47 meniscal segments were imaged. Each segment was placed into a saline-filled container, and two rubber blocks were used for fixation. MR imaging was performed with a 1.5-T imager (Symphony, Siemens Medical Solutions, Erlangen, Germany) equipped with a small flexible coil. The MR images of each segment were obtained in a plane perpendicular to its long axis. Images were acquired using five MR sequences, including T2-weighted turbo spin-echo (T2-TSE), T1-weighted turbo spin-echo (T1-TSE), proton density-weighted turbo spin-echo (PD-TSE), two-dimensional fast low-angle shot (2D FLASH), and three-dimensional fast imaging with steady-state precession (3D FISP). Tables 1, 2 show the MR imaging parameters for the patient knee joint and for the meniscal specimen, respectively. The images obtained by PD-TSE sequence were selected for correlation between MR images of preoperative menisci, their meniscal specimen, and the histological examinations, due to the relatively good demonstration of meniscal degeneration. The results of our study were similar to those of Escobedo et al. (10). MR images obtained by T2-TSE sequence showed a relatively dark signal intensity that was not sensitive to meniscal degeneration. T1-TSE, 2D FLASH and 3D FISP MR images were not used to examine the correlation due to excessive and heterogeneous meniscal signal intensities. All MR images were reviewed on a picture-archiving and communication system workstation monitor (m-view; Marotech, Seoul, Korea).
Histological Examination
Just after MR imaging, each meniscal segment was fixed in a 10% formalin solution for 12 hours or more. Each fixed segment was then cut into sections of 2 mm thickness in the same direction as MR imaging, and a mean of four sections (range, 2-5) were obtained from each segment. In total, 172 sections were embedded in paraffin and were sectioned further into 5-µm-thick slices. Histologic slides were stained with hematoxylin and eosin. The one histologic slide showing the meniscal configuration that best represented the corresponding MR image was selected from several slides of each section. A total of 100 slides (57 medial and 43 lateral menisci) and 100 corresponding MR images were used to analyze the correlation between the histologic findings and MR images. Histologic slides and MR images were analyzed by the consensus of one orthopedic pathologist and two experienced musculoskeletal radiologists.
Correlation of MR Image with Histological Examination
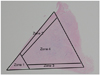
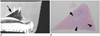
Scanning electron microscopic study of human menisci (11) has demonstrated that there are three distinct layers in the cross section of the meniscus: 1) the 10-µm-thick superficial network of delicate fibrils, 2) the 150-200-µm-thick lamellar layers of the superior and inferior surfaces, and 3) the central main layer. In the central layer, loose connective tissues which penetrate radially from the periphery of the meniscus is known as the radial tie fibers. Using a modification of the method used in Petersen and Tillmann (11), we divided the meniscus into four zones: the apical surface (zone 1), the superior lamellar layer (zone 2), the inferior lamellar layer (zone 3), and the central layer (zone 4). The apical surface (zone 1) was defined as an area occupying approximately 20% of the inner diameter of each meniscus (Fig. 1). In our study, the superior and inferior lamellar layers were defined as the summation of the superficial network (10-µm-thick) and the lamellar layer (150-200-µm-thick), because the superficial network could not be discriminated from the lamellar layer through MR imaging. Zones of apical surface, superior and inferior lamellar layers were considered to be peripheral zones. Zone 2 and 3 were evaluated and counted separately on both slides and MR images.
The MR grading of Stoller et al. (12) for abnormal high signal intensities of the meniscus (MR grades 1, 2, and 3) was also used. Meniscal tears that occurred within only one of peripheral zones, such as the apical surface or the superior or inferior lamellar layer, were considered to be minimal (subtle) tears. Minimal tears did not extend into the central layer. Minimal tears have previously been described as fraying, small, or subtle tears (4). For definite vertical and horizontal tears, the widely used definitions were adopted in this study based on histologic examination; in these tears, the central zone and peripheral zone of the meniscus were involved simultaneously. A meniscal tear consisting of two types was considered to be a complex tear. We classified only the vertical, horizontal and complex tears as definite meniscal tears.
MR signal intensity of the apical surface or superior or inferior lamellar layer was classified as follows: S0 = normal dark signal intensity, S1 = increased high signal intensity less than that of water, and S2 = increased high signal intensity equal to that of water. Apical surface or superior or inferior lamellar layer without a saw-tooth appearance on MR image was classified as M0 (normal surface) and that with a saw-tooth appearance as M1 (surface irregularity).
The superior and inferior lamellar layers were analyzed for the presence of thinning using histological examination. The meniscal thinning was defined as the area of decreased thickness of the lamellar layer. The superior or inferior lamellar layer showing thinning was correlated with the corresponding MR image for the presence of abnormal high signal intensity (S1 or S2) and surface irregularity (M1).
Various findings of meniscal degeneration were so scattered and discontinuous throughout the meniscus, and as such, it was very difficult to definitely separate areas of meniscal degeneration from areas of normal meniscus upon histological examination. Areas in which the abnormal findings of meniscal degeneration were detected on the slide were approximately correlated with the corresponding MR images. Radial tie fibers in the central zones detected on the histological examination were correlated with corresponding MR images.
RESULTS
Differences in the MR Findings of Preoperative Meniscus and Its Specimen
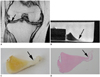
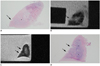
The menisci of the preoperative knee joints in general were maintained without signal intensity changes and contour distortion on MR images of their meniscal specimens. However, there were differences in two zones (zone 1 and 2). In the apical surface (zone 1), MR image of one knee joint showed a defect which was considered to be a radial tear, but that of the corresponding specimen showed minimal tear of the apical surface with S1 signal intensity (Fig. 2). In the superior lamellar layer (zone 2), MR images of two knee joints had surface irregularities (M1), but those of the corresponding specimens had normal surfaces.
Correlation of MR Findings with Histological Examination
Minimal Tear
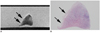
Minimal tear of the lamellar layer, those which did not extend into the central layer (zone 4), was shown in 60 zones (35 in zone 2 and 25 in zone 3) out of 100 slides with high signal intensity (S1, n = 29, 48.3%) and surface irregularity (M1, n = 38, 63.3%) (Fig. 3). Minimal tear of the apical surface (zone 1) was shown in 50 zones out of 100 slides, with high signal intensity (S1, n = 42, 84%) and surface irregularity (M1, n = 39, 78%).
Surface Thinning
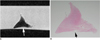
Surface thinning of the lamellar layer was seen in 24 zones (zones 2 or 3) out of 100 slides, with high signal intensity (S1, n = 7, 29.2%) and surface irregularity (M1, n = 10, 41.7%) (Fig. 4).
Meniscal Degeneration and Corresponding Abnormal High Signal Intensity
Out of 100 slides, 57 menisci showed degenerative changes in the central layer (zone 4) upon histological examination. All 57 menisci (100%) demonstrated abnormally high signal intensity (S1) on the corresponding MR images (Fig. 5). However, the areas of degeneration demonstrated on the slides did not conform with areas of high signal intensity on MR images, because the boundary of the degeneration could not clearly be determined from the slide (Table 3).
Simultaneous High Signal Intensities in Both Lamellar and Central Layers
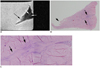
Of the 100 slides, 36 slides with definite meniscal tear on histological examination showed abnormal high signal intensities (S1 or S2) in one of the lamellar layers (zone 2 or 3) and in the central layer (zone 4) simultaneously. In 12 out of 100 slides, the lamellar layers with minimal tear (n = 7) or thinning (n = 5) on histological examination showed high signal intensities on corresponding MR images, and were accompanied by high signal intensities of the immediately adjacent central layers due to their degeneration (MR grade 3)(Fig. 6A, B). In 10 out of 100 slides, the lamellar layers with minimal tear on histological examination showed high signal intensities on MR images, and were distant from high signal intensities of the central layers (Fig. 6C, D) (Table 4).
Radial Tie Fibers
Seven of 100 meniscal slides had a normal appearance upon histological examination, but had abnormal high signal intensities (S1) in the central layers (zone 4) on the corresponding MR images. One-to-one correlation between the histologic slides and MR images demonstrated that the branching high signal intensities were caused by radial tie fibers of varying thickness (Fig. 7).
DISCUSSION
Based on the reports of investigators who reviewed MR images for the diagnosis of meniscal tears (2-4), the causes of errors in the interpretation of MR images can be classified into three categories. De Smet et al. (3) determined that 5% of missed tears were not detected through MR imaging despite prior knowledge of the sites and configurations of the tears. They believed that these false-negative errors were due to limitations in the MR sequences and imaging planes. Some investigators have used other sequences and imaging planes, such as axial imaging (13), three-dimensional reconstruction (14), and radial imaging (15) to overcome these errors. The second category is due to problems with interpretation, which occur as a result of misinterpretation of normal anatomic structures, anatomic variants, and changes after meniscal surgery (16-19). The last category may be related to the use of arthroscopy as the standard of reference (2, 4). In the analysis of error patterns by van Dyck et al. (20), ten of 12 unavoidable errors caused false-negative MR findings. Seven of these ten false-negative cases showed inner edge fraying that had been shaved with minimal resection. Inner edge fraying (minimal or subtle tears) is usually interpreted as insignificant findings on MR images, but on arthroscopic examination, it can be interpreted as either a tear or as an insignificant finding, depending on the arthroscopist.
In comparing the MR images of preoperative meniscus and its specimen, some of the apical surfaces (zone 1) and the lamellar layers (zone 2) showed differences in signal intensities of MR images. This inability of preoperative MR imaging of the meniscus to reveal the exact appearance of the meniscus can be another cause of MR error in the diagnosis of meniscal tears.
Many investigators have stated that frequent causes of incorrect diagnoses were subtle MR findings that were equivocal for a meniscal tear (3, 4, 20). Our results showed that minimal tear of the apical surface or lamellar layer of the meniscus can induce abnormal high signal intensity and surface irregularity, and can mimic a definite meniscal tear on MR images. Meanwhile, arthroscopic surgeons can make a subjective diagnosis with regard to minimal tear of the meniscus as a definite meniscal tear or insignificant findings of the meniscus. Therefore, the sensitivity and specificity of MRI for meniscal tears would depend on the arthroscopist's subjective diagnosis. Consequently, minimal tear of the apical surface or lamellar layer of the meniscus can be an important cause of incorrect MR diagnosis of the meniscal tear. Van Dyck et al. (20) recommended that radiologists should be very descriptive when reporting subtle MR findings, alerting clinicians to the possibility of a meniscal tear.
In 12 of 100 slides, MR grade 3 signal intensities were seen due to minimal tear of the lamellar layer and degeneration of the just adjacent central layer together. On the basis of our observations, MR grade 3 signal intensity can be caused by either a definite meniscal tear or by a minimal tear of the lamellar layer which coincides with degeneration of the just adjacent central layer, which may not be clinically significant. Based on our observations, minimal tear of the apical surface or the lamellar layer can be an important cause of false-positive MR diagnosis.
Thinning of the lamellar layer was seen in 24 zones (zone 2 or 3) of 100 slides. To our knowledge, this study is the first to classify meniscal surface thinning as one of the types of meniscal injury detected by histologic examination. Surface thinning of the meniscus was thought to occur as a result of chronic wearing of the lamellar layer. Whether or not surface thinning is associated with clinical symptoms needs to be confirmed.
Abnormal findings of meniscal degeneration have been known to include myxoid degeneration with an increase in intercellular mucoid ground substance, chondrocyte proliferation or death, microcyst formation, calcification and fragmentation of collagen bundles (12, 21, 22). Stoller et al. (12) stated that there was a precise one-to-one correlation (100%) between the three histologic stages and the three grades (1, 2, and 3) of MR signal intensity in the 12 menisci (36 segments) examined. However, in our histologic analyses, degenerative changes occurred so discontinuously and heterogeneously that we could not correlate the findings of histological examination and those of MR images.
Seven of 100 meniscal slides demonstrated that the abnormal high signal intensities on MR images were caused by radial tie fibers of varying thickness, which has been corroborated by other investigators (11, 23-28). Our observations concur with those of Hauger et al. (24), where another potential cause of linear intermediate signal intensity in the meniscus was the presence of radially-oriented collagen tie fibers. However, abnormal high signal intensity in a linear distribution in the central layer of the meniscus can be caused by intrasubstance meniscal tears, increased vascularity (29), and meniscal degeneration.
This study has several limitations. First, preoperative knee MR images of 21 patients were not available in this study. So, preoperative MR diagnoses about their menisci were not included in the evaluation of the study. Second, the selection of histologic slides that exactly represented each MR image was somewhat subjective due to differences in their thicknesses; however, we attempted to select histologic slides where the morphology, size, and appearance of the meniscal injury demonstrated on the histologic slide matched those of the MR image. Third, because this study was performed in samples of elderly patients, there was no comparison between various age groups. Degeneration of the meniscus can occur in the twenties (30), and its incidence increases with age. Therefore, our observations can be applied to the interpretation of meniscal MR images obtained in various age populations.
In summary, a relatively large proportion of minimal tears in the lamellar layer or the apical surface can cause abnormal high signal intensity and surface irregularity on MR images, which might lead radiologists to diagnose meniscal tears incorrectly. In situations where the diagnosis of meniscal tears depends largely on signal changes of the meniscus, detailed knowledge of the histologic and MR findings of minimal tears of the meniscus may be important for the exact diagnosis of meniscal tears. Further studies are necessary to validate the effect of minimal tears on the diagnosis of meniscal tears with a 3.0T MR scanner.


 XML Download