

 PDF
PDF ePub
ePub Citation
 Print
Print


INTRODUCTION
Recently, there has been a rapidly growing interest in radiation exposure in medicine among physicians, including radiologists, and also among the public. The most effective way of reducing medical radiation exposure would be to not perform unnecessary imaging studies or procedures that use X-rays and to follow the as low as reasonably achievable principle, in which only medically justifiable studies are performed (1). However, such is difficult due to a lack of consensus among both the medical community and the public regarding which studies are medically justified. The use of evidence from epidemiological, clinical and basic research studies should be a condition precedent to making decisions regarding what constitute medically justifiable studies and the optimal time for such studies. Thus, the practical and load-and-go way to reduce radiation exposure may decrease radiation doses during X-ray-related studies to values as low as achievable.
Although computed tomography (CT) comprises a relatively small portion of X-ray examinations, they constitute approximately half of the total collective annual dose (2). Furthermore, number of CT examinations and patients who need repeated CT follow-up due to chronic or oncologic disease have been rapidly increasing (3-5). Therefore, it is reasonable to assume that radiation dose reduction during CT examination is one of the most effective ways to reduce the total amount of radiation that a patient is exposed to. To compensate for the rapid increase in medical radiation exposure by CT, continued efforts have been made to reduce radiation dose and to develop radiation reduction techniques (3, 6-10). Recently, two new radiation reduction techniques have been introduced. The first technique is the automated tube potential selection technique (CARE kV, Siemens Healthcare, Forchheim, Germany), an automated dose-optimized X-ray tube voltage selection technique which uses a recommended optimal kV setting for each individual patient for each specific exam (8). The second is sinogram-affirmed iterative reconstruction (SAFIRE), a raw data-based iterative reconstruction algorithm. Contrary to conventional filtered-back projection, SAFIRE can reduce image noise without increasing radiation dose (11). Until now, there has been no study regarding the effectiveness of these new radiation dose reduction techniques on abdominal tissues. Although SAFIRE and CARE kV are vender-specific dose reduction techniques, it would be worth evaluating the combined effect of the iterative reconstruction and tube voltage modulation, as these two techniques represent the main direction of recent technical developments. Therefore, the aim of this study was to evaluate the feasibility of the two recently introduced techniques, CARE kV and SAFIRE, in reducing radiation dose without increasing image noise for abdominal CT examinations.
MATERIALS AND METHODS
Our institutional review board approved this retrospective study, and informed consent was waived.
CARE kV and SAFIRE: Brief Technical Background
CARE kV (Siemens Healthcare) is an automated attenuation-based tube potential selection algorithm which can be assigned to each patient according to the patient's topogram and study objective (8). On the basis of attenuation information obtained from a topogram, a tube current is calculated to preserve required image quality (i.e., contrast-to-noise ratio) for different tube potentials. Then, CARE kV proposes an optimized tube potential with corresponding mAs which may minimize radiation exposure during CT exams (1).
The filtered back projection (FBP) algorithm is a standard image reconstruction method in CT. However, there is a trade-off between spatial resolution and image noise when images are reconstructed by FBP. Hence, the amount of radiation dose reduction possible is limited by the diagnostic quality of images (12). Iterative reconstruction approaches can overcome this weakness, but clinical application is limited due to the intensive computational work required that results in a long operating time (13). A few years ago, a simplified method of iterative reconstruction (i.e., image based iterative reconstruction [IRIS]) was introduced. IRIS uses an FBP algorithm to reconstruct images first, and then decreases image noise by iterative steps (7, 8, 14). It requires a relatively short period of time for computation (five slices per second for abdominal CT) and can reduce radiation dose without compromising image quality (3, 15). SAFIRE is a simplified step-expansion and one of the most recently introduced iterative reconstruction algorithms, which uses a noise modeling technique based on raw data (16). It estimates noise content within a raw data set and removes it from the image data set at each iteration with a strength between 1 to 5, depending on the user's choice (12).
Image Quality Assessment of the Patient Study
Patients
Between June 24, 2011 and July 29, 2011, patients who underwent abdominal CT examination with the Siemens SOMATOM Definition Flash were screened for this study. In our hospital, CARE kV was installed on June 24, 2011, and SAFIRE was set up on July 11, 2011.
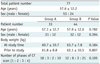
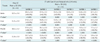
The inclusion criteria of our study were as follows: 1) patients who received an abdominal CT scan with CARE kV and routine dose (i.e., reference mAs of 240 with automated tube current modulation) between June 24, 2011 and July 10, 2011 (referred as group A hereinafter); or those who were examined with combined CARE kV, a decreased radiation dose (i.e., reference mAs of 170 with automated tube current modulation) and iterative reconstruction of the image using the SAFIRE technique between July 11, 2011 and July 29, 2011 (referred to as group B); and 2) patients who had a prior CT scan performed with the same scanner using the same protocol except for the use of CARE kV, reduced mAs and SAFIRE within 1 year. The time limitation of 1-year was set to minimize a patient's weight difference between the two CT examinations. The search found 33 patients assigned to group A (21 men and 12 women; average age, 57.1 ± 12.7 years; range, 28-81 years) and 44 patients assigned to group B (32 men and 12 women; average age, 57.9 ± 12.0 years; range, 31-79 years). The two groups were not significantly different in terms of age, sex and body weight, both at the time of study and at the time of prior CT and the number of phases of the CT scan (Table 1).
CT Protocols
All CT scans were obtained with a 64-channel multidetector CT scanner (Somatom Definition Flash, Siemens Medical Solutions, Forchheim, Germany). One to four phase CT scans were performed in each patient including the precontrast, late arterial-, portal venous- and delayed-phase CT scans, depending on their clinical indications. A precontrast CT scan was performed before administration of contrast media. Then, contrast media was injected by a power injector via the antecubital vein in the amount of 2 mL/kg over 30 seconds. Using a bolus tracking technique, the late arterial phase was performed 18 seconds after the Hounsfield Unit (HU) measurement reached 100 above the baseline at the abdominal aorta. The portal venous phase and delayed phase scans were obtained with a scan delay of 30 seconds and 150 seconds, respectively, after the end of the previous arterial and portal venous phase. In patients who only had hepatic venous phase CT performed, the hepatic venous phase was obtained 55 seconds after 100 HU was measured at the abdominal aorta from the baseline HU. CT parameters for the past comparison CT scans were as follows: applied CARE Dose 4D, tube current 120 kV, reference mAs 240 mAs, rotation time 0.5 seconds, beam pitch 0.6 and slice thickness 3-5 mm. Between June 24, 2011 and July 11, 2011, CARE kV was additionally applied to the scan protocol (group A). The CARE kV slider was set to 7 for contrast-enhanced CT and to 3 for non-enhanced CT. The tube voltage automatically chosen by CARE kV happened to be 100 kVp for all study patients. Between July 12, 2011 and July 29, 2011, a reduction of reference mAs from 240 mAs to 170 mAs (approximately 30% reduction) and image reconstruction with SAFIRE at different strengths of 1 to 5 were also added while maintaining all other CT scan protocols including CARE kV (group B). The tube voltage automatically chosen by CARE kV was 100 kVp in all patients of group B as well.
Image Analysis
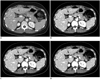
One radiologist measured the attenuation value (HU) of 4 different organs/tissues: abdominal aorta, liver right lobe, paraspinal muscle and subcutaneous fat tissue on the portal venous phase images. The measurements were done both on the CT obtained with the dose reduction techniques (i.e., CARE kV with or without SAFIRE) and the prior comparison CT, which was performed without using these techniques. One 200 mm2 circular region of interest (ROI) was placed per tissue by carefully selecting areas of homogeneous attenuation. The level of the left portal vein umbilical segment was well depicted to evaluate the four different tissues in the same location in each patient. The mean HU value of the ROI and its standard deviation (SD) representing the image noise in the organ/tissues were obtained.
Radiation Dose Assessment
Dose reports of the CT scans were reviewed by one radiologist, and the CTDIvol and dose length product (DLP) values were recorded. The effective dose was used for quantitative risk assessment caused by radiation exposure. The effective dose of each examination was calculated using DLP values and the normalized value of the conversion factor (EDLP; abdomen-pelvis, 0.015 mSv/mGy·cm) proposed by the European Guidelines on Quality Criteria (17, 18). For CT, formula for calculating the effective dose was: effective dose (mSv) = DLP × EDLP.
Statistical Analysis
Statistical analyses were performed using SPSS version 18.0.0 (SPSS Inc., Chicago, IL, USA). The mean organ/tissue attenuation and image noise were compared using repeated measures ANOVA for patient data analysis. The age and body weight of patients were compared between the groups by the independent sample t test. Pearson chi-square test or Fisher's exact test was used to compare sex and phase number of CT scans between groups A and B. Radiation dose and body weight were compared between the time of study and the time of prior CT using the paired sample t test. P values < 0.05 were considered to suggest a statistically significant difference for all data analyses.
RESULTS
Effect of CARE kV
In group A, CT numbers for the aorta, liver and muscle were significantly increased after applying CARE kV compared with previous CTs (p < 0.001); and CT numbers of subcutaneous fat tissue were decreased by about 10.7% compared to prior CTs (p < 0.001). Image noise was significantly increased in all four tissues after applying CARE kV by more than 14.9%, compared to prior CTs (p < 0.001) (Table 2).
Effect of SAFIRE and CARE kV
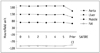
In group B, the mean CT numbers for each organ were not significantly different in relation to different strength reconstructions of SAFIRE (Fig. 1). Mean CT numbers between prior CTs and CTs during the study time with any SAFIRE strength were significantly different for all organs (p < 0.001 for all) (Fig. 1).
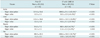
Image noise was significantly decreased from SAFIRE 1 to 5 in all tissues (ANOVA, p < 0.001) (Fig. 2, Table 3). On a post hoc analysis with the Tukey method, image noise was significantly different between SAFIRE strengths 0 and 1, 1 and 2, 2 and 3, 3 and 4 and 4 and 5 for all four organs (p < 0.001 for each group). Image noise (SD) was similar between the prior CT and the study time CT with SAFIRE strengths of 3 and 4 in the aorta, liver (p = 1.000 and p = 0.108) and muscle (p = 1.000, respectively). In terms of subcutaneous fat, there was no significant difference in the image noise between the prior CT and study time CT with SAFIRE strengths of 1 (p = 1.000) and 2 (p = 1.000). However, the image noise measured in the fatty tissue with the use of SAFIRE strengths of 3 and 4 became significantly smaller (p = 0.001 and < 0.001, respectively) than noise on the prior CT (Table 3).
Radiation Dose Assessment
The effective dose was decreased by 19.4% in group A (p < 0.001) after applying CARE kV. For group B, the effective dose was decreased by 41.3%, respectively (p < 0.001) (Table 4).
DISCUSSION
Our results show that a 19.4% dose reduction can be achieved by applying an automated kV modulation algorithm (i.e., CARE kV). Furthermore, mA can be decreased by approximately 30% (from 240 mAs to 170 mAs) by applying SAFIRE strength 3 or 4 and CARE kV together. The total radiation dose can be reduced up to 41.3% without increasing image noise.
Two important things to be considered when applying a newly developed image reconstruction algorithm are the CT number linearity and accuracy. If the CT number linearity and accuracy are not preserved, imaging findings of a certain lesion may be changed, resulting in a decreased diagnostic performance. According to a previous phantom study, CT number linearity was proven in IRIS (14). The CT number for abdominal organs did not change with increasing SAFIRE strength in this human study. These results suggest that CT number linearity and accuracy are preserved even after applying any strengths of SAFIRE.
In terms of modulation of tube voltage (CARE kV), CT number linearity cannot be preserved, because the CT number is dependent on tube voltage and chemical composition of materials that attenuate the X-ray. With a lowered tube voltage, the attenuation coefficient of iodine increases as photon energy decreases toward k-edge energy of 33 kV, resulting in a superior enhancement of iodine contrast agent (11). As a result, contrary to automatic exposure control, modulation of kV has only been applied in children and in the diagnosis of vascular lesions or hypervascular tumors up to now (19-21). In group A, the CT number of iodine-rich organs, such as the aorta (+20.4%) and liver (+16.8%), increased relatively more than that of iodine-poor organs (i.e., poorly-enhancing organs), such as muscles (+6.7%), after applying CARE kV. In contrast, attenuation of fat decreased by about 10.7%. Such may be due to the subcutaneous fat being a nearly iodine-free structure, where it attenuates X-rays less with a tube voltage decrease. In terms of radiation dose, use of a lower tube potential can reduce the radiation dose more than a higher tube potential while still maintaining image quality when the patient size is below a certain threshold (11). According to a previous phantom study, decreasing the tube voltage from 140 to 120 or 100 kVp resulted in a radiation dose reduction of 22% and 29%, respectively (21). In our study, the tube voltage was 100 kVp in all patients after applying CARE kV, and the achieved dose reduction was about 19.4%, which is comparable with previous studies. Considering that image noise increases more in large patients when tube voltage is decreased (19), magnitude of dose reduction after applying CARE kV may be less in Western countries (where large-sized patients are more prevalent) than it was in our study.
As expected, a higher SAFIRE strength can reduce image noise more (12). This was confirmed in our study, where image noise was significantly decreased with increasing SAFIRE strength from 1 to 5. This means that increased noise resulting from radiation dose reduction (i.e., kVp and mAs) can be compensated by applying SAFIRE, and at a certain strength of SAFIRE, the noise level can be similar to that of original images obtained with the reference mAs (240 mAs in this study). However, over-processing of iterative reconstruction might decrease image sharpness and provide a different image texture (often described as blurry or blotchy), compared with images reconstructed with FBP, an issue due to overfitting (22). Therefore, it is essential to find an optimal amount of iterative reconstruction processing. In terms of the adaptive statistical iterative reconstruction technique (ASIR, GE Healthcare, Waukesha, WI, USA), the user can choose a blended ratio of ASIR with conventional FBP image data. A 30-50% of ASIR blending is recommended (23). With SAFIRE, the user can choose the SAFIRE strength and tune the noise model. Unlike ASIR, SAFIRE strength (1-5) is not related to number of iteration loops or blending percentage, but rather related to presets for the parameters used by the noise model which impact the noise amplitude/contribution of high frequencies to the images. Until now, there has been no data regarding the optimal SAFIRE strength in abdominal CT. Our results suggest that a SAFIRE strength of 3 or 4 in case of 30% mAs reduction (240 mAs to 170 mAs) could present similar image noise levels to the standard dose images, although the difference of image noise was smaller in SAFIRE strength 3 than in SAFIRE strength 4 compared to that of the standard dose CT images.
According to previous studies, half-dose CT images with SAFIRE can reduce image noise and preserve or even improve diagnostic performance (12, 24). In our study, dose reduction was about 41.3%, even when both SAFIRE and CARE kV were applied, a relatively smaller value than that of previous studies. We approached this conservatively and reduced mAs by only 30%. Unlike previous studies which evaluated the coronary artery, we wanted to evaluate not only vascular structures but also other structures such as the liver and muscles.
The limitations of our study are as follows. First, the sample size of patients who received CT on the same CT scanner was relatively small. Second, we did not perform any image quality assessment other than noise measurement, and we did not evaluate the effect on diagnostic performance. Third, comparison of the radiation dose reduction effect between CARE kV group and SAFIRE-only group was not performed in this study. Fourth, we did not evaluate the effectiveness of novel radiation dose reduction techniques beyond a 30% dose reduction. Fifth, there is a limitation in generalization, as this study was performed with a single scanner model. Furthermore, the body habitus of the study patients was quite homogeneous, and no one was very overweight in this study. This may be the reason for the auto-selected optimal kVp being 100 kVp for all patients. The effect of auto kVp would be different for populations that have different BMI or body size distributions. Also, the settings of CARE kV were selected based on the recommendation of the vendor, and hence it might need optimization in a future study. Finally, although the possibility of a change is small, there may be discrepancies in the hemodynamic status of patients between the two CT scans.
In conclusion, the results of our study suggest that CT dose reduction may be achieved up to 41.3% without increasing image noise by applying the automated kV modulation technique and iterative reconstruction methods.

 XML Download