

 PDF
PDF ePub
ePub Citation
 Print
Print


INTRODUCTION
Tumor angiogenesis is essential for tumor growth and progression (1). In colorectal cancer, angiogenesis is associated with transmural extension as well as with lymphatic and distant hematogenous metastases (2). Tumor angiogenesis activity may be evaluated by direct or indirect methods. The direct method has been considered the standard for assessment. It measures immunohistochemical markers such as microvessel density (MVD) and vascular endothelial growth factor (VEGF) expression. However, the direct method is invasive, time consuming and difficult with which to achieve reproducible results. For these reasons, dynamic contrast-enhanced magnetic resonance imaging (DCE-MRI) has now become a promising indirect method with high spatial resolution and no associated radiation hazards (3-5). Some investigators have reported the usefulness of DCE-MRI in rectal cancer, mostly in terms of therapeutic monitoring after chemotherapy and radiotherapy (6-9). Only few reports have evaluated the relationship between DCE-MRI perfusion parameters and histological markers of angiogenesis and have shown conflicting results (10-12). These reports used relatively small sample sizes using an 1.5T MR scanner or semiquantitative parameters on the basis of time-intensity curves. Therefore, the purpose of our study was to investigate whether quantitative perfusion parameters of DCE-MRI, specifically transendothelial volume transfer (Ktrans) and fractional volume of the extravascular-extracellular space (Ve), correlate with immunohistochemical markers of angiogenesis in rectal cancer when determined using a high field 3.0T scanner with high temporal resolution.
MATERIALS AND METHODS
Patient Population
This retrospective study was approved by our institutional review board and a waiver of informed consent was obtained. Patients with histologically proven primary rectal adenocarcinoma who had received treatment were included in this study. The patients underwent elective primary surgical resection within 2 weeks of their staging MRI examination. DCE-MRI sequence was routinely performed as part of our pre-operative rectal MR protocol. From September 2008 to April 2009, a total of 72 patients were enrolled. However, nine patients were excluded because of small tumor volumes that were not detectable on MR imaging (n = 5) or procedural failures for immunohistochemical staining (n = 4). Finally, a total of 63 patients (39 men and 24 women; mean age, 61 years [range, 36-88 years]) were included in this study.
MR Imaging and Protocols
MRI examination was performed on a 3.0 tesla scanner (MAGNETOM TrioTim; Siemens, Erlangen, Germany) applying a 6-element body phased-array coil on the anterior side of the patient and another 6-element spine coil on the posterior side. Patients underwent bowel preparation including intravenous injection of a 20-mg dose of scopolamine butylbromide (Buscopan, Boehringer Ingelheim Korea, Seoul, Korea) and luminal distension with 80-100 mL of sonography transmission gel (Progel®, Dayo, Seoul, Korea) using an enema syringe before the MRI examination. Axial, sagittal, and oblique T2-weighted MR images were obtained using a respiratory-triggered turbo spin-echo sequence for anatomical imaging.
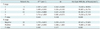
Dynamic contrast-enhanced magnetic resonance imaging was performed using a free-breathing T1-weighted three-dimensional (3D) spoiled gradient echo fat low-angle shot (FLASH) sequence with fat suppression on the axial plane. The protocol for the T1 map included a T1-weighted spin echo pulse sequence with 16 slices, TE of 8.5 msec, and three different TRs of 100, 400 and 1000 msec. Dynamic T1-weighted images were obtained with the following parameter settings: TE/TR of 1.18/3.58, flip angle of 20°, temporal resolution of 1.5-1.6 seconds, total of 341 dynamic images per slice, total imaging time of 8 minutes 48 seconds, single acquisition with parallel acquisition (generalized autocalibrating partially parallel acquisitions, acceleration factor 2), and the same field of view and matrix as those of the T1 map protocol. A bolus injection of gadolinium-diethylenetriamine pentaacetic acid (Gd-DTPA) at a dosage of 0.1 mmoL/kg (Magnevist, Schering, Berlin, Germany) was followed by 10 pre-acquisitions. Contrast agent was injected at 2 mL/second using a power injector with a chasing bolus of 20 mL normal saline. The MRI sequence parameters used are detailed in Table 1.
Imaging Analysis
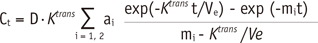
Analysis of the DCE-MRI data was based on the generalized kinetic model by Tofts and Kermode (13, 14). According to this model after bolus injection of contrast agent at dose D given at time t = 0, the plasma concentration of contrast agent decays biexponentially:
(15)
a1 and a2 are the amplitudes of the components, and m1 and m2 are their decay rate constants. In humans, amplitudes a1 = 3.99 kg/liter and a2 = 4.78 kg/liter, and rate constants m1 = 0.144 min-1 and m2 = 0.0111 min-1, according to the data of Weinmann et al (16). In this study, the dose D of Gd-DTPA was 0.1 mmoL/kg body weight. This model predicts changes in the concentration of contrast agent in the tissue due to its transfer between plasma and interstitial space:
(17)
Ktrans is the volume transfer constant between blood plasma and extravascular extracellular space (EES), and Ve is the EES fractional volume, which is the volume of EES per unit volume of tissue. To obtain the volume transfer constant Ktrans, a concentration curve was fitted to the above Tofts and Kermode model at pixel resolution.
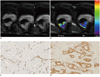
All in-house software for pharmacokinetic modeling was written in Interactive Data Language (Interactive Data Language, Research Systems, Boulder, CO, USA). MR images were analyzed by an experienced gastrointestinal radiologist who was blinded to the pathologic data. Regions of interest (ROIs) were manually contoured along the edge of the tumor on dynamic T1-weighted FLASH images, section by section in thicknesses of 5 mm on the central three levels of the tumor and referenced on the corresponding T2-weghted axial images. The mean summed sizes of three serial ROIs in the tumor and normal rectal wall were 11.13 ± 6.45 cm2 and 3.63 ± 1.92 cm2, respectively. The mean Ktrans and Ve of all voxels within each ROI were derived. The radiologist drew three ROIs for each tumor and normal rectal wall twice, and average values for the perfusion parameters (Ktrans and Ve) were calculated.
Immunohistochemical Staining and Quantification of Histologic Parameters
In addition to routine tissue sampling for pathologic staging, additional tissue blocks from each tumor were acquired for immunohistochemical staining by the pathologist. The pathologist was attentive to the fact that the histological assessment involved specimens obtained at a tumor level in which the largest transverse diameter was detected on MRI. Tissue blocks from each patient were stained immunohistochemically for CD34 and VEGF. The pathologist evaluated the MVD and VEGF expression scores while being blinded to the DCE-MRI findings. To determine MVD, three tumor "hotspots" [highly vascularized areas within the tumor; Weidner counting method (18)] were identified at low magnification, and the highest number of microvessels in each were counted at 200 × magnification. The MVD score was expressed as the mean number of microvessels per 1 mm2. VEGF staining was assessed using staining intensity (1, no; 2, weak; 3, moderate; and 4, strong staining), and the percentage of tumor area was stained at 200 × magnification (1, < 5; 2, 5-20; 3, 21-50; and 4, > 50%). The sum of these two scores was the VEGF expression score, ranging from 2 to 8 (19).
Statistical Analysis
Statistical analyses were performed using statistics software (SAS v 9.2, SAS Institute, Cary, NC, USA; MedCalc, version 9.3.6.0, MedCalc Soft ware, Mariakerke, Belgium). Mean values with standard deviations were calculated for all parameters. Perfusion MRI parameters for rectal cancer wall were compared with those from the normal rectal wall using the paired t test. Perfusion parameters of rectal cancer were correlated with the MVD and VEGF expression scores using Spearman's rank coefficient analysis. Perfusion parameters and MVD were also correlated with T stage (1, 2, 3, or 4) and N stage (negative or positive) using the generalized linear regression procedure and one-way analysis of variance. P values less than 0.05 were considered to indicate statistically significant differences.
RESULTS
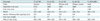
All 63 patients underwent radical surgery for pathologically confirmed rectal adenocarcinoma: Mile's operation in 4 patients, low anterior resection in 51 patients, and ultra low anterior resection in 8 patients. The mean tumor size was 4.5 cm (range, 2-12 cm). The types of the tumors found in the patients were 19 upper, 38 middle, and 6 lower third tumors. Histopathological tumor staging was determined to be T1 in 5, T2 in 10, T3 in 41, and T4 in 7 patients. Thirty-three patients had lymph node metastases. The tumor was well-differentiated in 4, moderately-differentiated in 58, and poorly-differentiated in 1 patient. The mean summed Ktrans and Ve values of the three serial ROIs were 1.824 ± 0.909 (range, 0.456-4.423) min-1 and 0.424 ± 0.229 (range, 0.121-0.902), respectively, for the tumor, and 0.600 ± 0.443 (range, 0.078-1.248) min-1 and 0.416 ± 0.284 (range, 0.057-0.857), respectively, in the normal rectal wall. The mean Ktrans was significantly higher in rectal cancer than in the normal rectal wall (p < 0.0001), but the mean Ve was not significantly different (p = 0.570).
Correlation between Perfusion Parameters and Immunohistochemical Markers of Tumor Angiogenesis
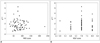
The average hot-spot MVD score of rectal cancer specimens was 81.9 ± 32.8 (range: 27.7-231.1), and the average VEGF expression score was 7.0 ± 0.7 (range: 5.0-8.0). Table 2 shows the correlation between MRI perfusion parameters and immunohistochemical markers of tumor angiogenesis. No significant correlations were found between MRI perfusion parameters (Ktrans and Ve) and the MVD or VEGF expression score (Figs. 1, 2).
Correlation between Perfusion Parameters and TN Stage in Rectal Cancer
There was no significant correlation between MRI perfusion parameters (Ktrans and Ve) and T stage or N stage (Table 3). MRI perfusion parameters were also not significantly different between the hot-spot MVD score, T stage or N stage.
DISCUSSION
To obtain nutrients for growth and to metastasize to other organs, a tumor develops both structurally and functionally abnormal new vasculature that is leaky with a hazard pattern of interconnections (20, 21). This leads to higher endothelial permeability and blood flow within the tumor, and thereby increases the Ktrans value. Published studies have reported that the Ktrans value in rectal cancer wall is significantly higher compared with the normal rectal wall or muscle tissue (12, 22). In our study, DCE-MRI of rectal cancer also revealed a significantly higher Ktrans value compared to the value of the normal rectal wall. However, the Ve values did not significantly differ between tumor and normal wall in our study. Ve is defined as the fractional volume of the EES. The EES and vascular space are balanced for adequate nutrient and oxygen supply in normal tissues, but the balance is disrupted in tumors. In most tumors, the EES is enlarged and differs depending on the tumor type and aggressiveness (23). DCE-MRI has been used in an attempt to quantify the EES of tumors and normal tissues (14, 24, 25). Published studies regarding rectal cancer have revealed conflicting results, with some results showing significantly higher Ve values on DCE-MRI (12) and others showing similar Ve values (22) on perfusion CT for rectal cancer wall versus the normal rectal wall or muscle tissue, respectively. Janssen et al. (22) presumed that the relatively short imaging time may create a bias resulting in similar Ve values for tumor and normal tissues. The absence of a significant difference in Ve in our study is difficult to explain, because our imaging time (8 minutes 48 seconds) was sufficient. The physiological microenvironment of the tumor is heterogeneous, and the ESS is related to several parameters of the tumor microenvironment such as cell density, hypoxic fraction or interstitial fluid pressure, thus causing Ve values to be variable (25).
There have been published reports on the use of DCE-MRI as an indirect method for assessing angiogenesis in rectal cancer, and these reports have shown varying results (10-12, 26). Atkin et al. (10) reported that there was no correlation between tumor markers of angiogenesis and kinetic MRI parameters. However, other investigators reported that DCE-MRI parameters showed a significant correlation with MVD (11, 12, 26) and VEGF expression (11). Yao et al. (12) suggested that Ktrans correlated positively with TNM staging and Dukes staging.
In our study, there was no direct correlation between MRI perfusion parameters (Ktrans and Ve) and immunohistochemical markers of tumor angiogenesis (MVD score and VEGF expression score). For the detailed evaluation of MRI perfusion parameters, we analyzed specimens according to T and N stage. There was no significant difference in MRI perfusion parameters when values were grouped by T or N stage. The MVD scores was also not significantly different when the values were grouped by T or N stage. In this regard, our study is concordant with the report described above by Atkin et al. (10). Although we used the highest temporal resolution (1.5-1.6 seconds) in 3D DCE-MR imaging and had the largest sample size (n = 63) ever reported in colorectal cancer (10-12, 26), the results of our study do not support the general trend that DCE-MRI parameters directly reflect tumor angiogenesis. The lack of correlation between perfusion parameters with MVD and VEGF expression may reflect the wide variation in the functional status of tumor vasculature. A tumor typically has structurally and functionally abnormal new vasculature, which is leaky, tortuous and dilated (21). MVD is a measurement of vessel density, whereas DCE-MRI reflects the functional status of only perfused tumor vessels and reflects physiological variables such as tumor blood flow and capillary permeability (3). A histopathology-MR imaging correlation may not be seen because of the discrepancy between the anatomical and the functional status of the tumor vasculature. Similarly, tumor VEGF measurements reflect only static data, thus the lack of correlation between VEGF and DCE-MRI parameters according to the dynamic local microenvironmental changes of the tumor (10, 27).
It is possible that MVD and VEGF may not accurately reflect tumor angiogenesis. Hlatky et al. (28) reported that MVD reflects the metabolic burden of the supported tumor cells rather than angiogenic dependence. Previous studies reported that VEGF expression in endometrial carcinoma (29) and lung cancer (30) was not correlated with microvessel count. Although VEGF is an important component in angiogenesis (31, 32), the process of angiogenesis may depend on the net balance of many positive angiogenic factores, such as VEGF, fibroblast growth factors, epidermal growth factor, transforming growth factors, thymidine phosphorylase and negative angiogenic factors, such as thrombospondin and angiostatin (33). Because of the complexity of the angiogenic process, it is unlikely that any single specific indicator is responsible for the process (33).
One of the major limitations of this study was that the pathological tissue sections from which MVD and VEGF estimates were determined were not necessarily taken from the same MRI planes. Tumor shape can change and shrinkage can occur during tissue processing after surgery. Furthermore, the comparison between DCE-MRI parameters measured at the millimeter level versus histological markers at the micrometer level (34) may be additional limitations. Another limitation is that we did not obtain perfusion parameters for the entire tumor volume. ROI analysis is prone to bias and may not adequately represent tumor heterogeneity. To minimize these limitations, ROIs were drawn from three sections through the tumor, and the mean Ktrans and Ve values were obtained in our study.
In conclusion, DCE-MRI perfusion parameters (Ktrans and Ve) are less likely to show a direct correlation with the MVD and VEGF expression scores in rectal cancer.

 XML Download