

 PDF
PDF ePub
ePub Citation
 Print
Print


INTRODUCTION
Intrahepatic bile duct adenoma (BDA) is a rare benign tumor of the liver arising from the epithelium of the intrahepatic bile ducts. Research has suggested that this benign tumor should be called a peribiliary gland hamartoma because of a similarity between bile duct adenoma and peribiliary glands in their secretory glandcell phenotype (1). According to Edmondson's classification (2), bile duct adenoma is the rarest of benign primary hepatic tumors, with an incidence of 1.3%. Craig et al. (3) reported that bile duct adenoma was identified in only five of 50000 autopsies. Often, bile duct adenoma is depicted as a well-defined, non-encapsulated, non-cystic small (< 2 cm) tumor typically found on the surface of the liver. Due to its characteristic subcapsular location and small size, most cases have been found incidentally on autopsies or resected livers after treatment for other pathologies (2-4). Histologically, bile duct adenoma is characterized by inflammation and fibrosis involving a proliferation of bile ductules, which are thought to be reactive processes in response to focal injuries and may be associated with chronic liver disease (4).
We report imaging features of a case of surgically confirmed intrahepatic BDA. To our knowledge, this is the first report of a case of intrahepatic BDA that was studied using both diffusion-weighted imaging (DWI) and gadolinium-ethoxybenzyl-diethylene triamine pentaacetic acid (Gd-EOB-DTPA)-enhanced magnetic resonance imaging (MRI).
CASE REPORT
A 64-year-old male patient with alcoholic liver cirrhosis, who was under surveillance for hepatocellular carcinoma (HCC), showed a mass-like lesion on a computed tomography (CT) scan. The CT scan performed 22 months earlier had revealed no abnormal lesion in the liver. Liver function tests on admission showed elevated serum aminotransferases, with a glutamic-oxaloacetic transaminase level of 121 IU/L (normal = 15-41 IU/L) and a glutamic-pyruvic transaminase level of 69 IU/L (normal = 17-59 IU/L). The serological workups for the hepatitis B virus antigen and hepatitis C virus antibody were negative, and the serum alpha-fetoprotein level was normal.
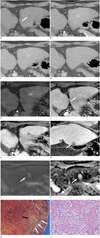
Dynamic CT scan was performed with a multi-detector row scanner (Somatom Definition Flash, Siemens Healthcare, Forchheim, Germany) before and after the intravenous injection of 2 mL/kg of non-ionic, iodinated contrast material (Xenetix 300, iobitridol; Guerbet, Sulzbach, Germany). Unenhanced images showed a newly developed 1.4-cm low-density subcapsular mass in the left lateral segment of the liver (Fig. 1A). On dynamic contrast-enhanced images, the mass demonstrated homogeneous enhancement in the arterial phase (18 seconds after the injection of contrast material) and persistent enhancement in the portal venous phase (60 seconds) but appeared to be isoattenuated relative to the liver parenchyma in the delayed phase (180 seconds) (Fig. 1B-D). The CT parameters were as follows: detector collimation, 0.63 mm; reconstruction interval, 3 mm; tube voltage, 120 kVp; and the product of the tube current and exposure time, 50-240 mAs in conjunction with dose modulation techniques.
Liver dynamic MRI was performed one week later to rule out the possibility of small HCC with a 3-T whole-body MRI system (Intera Achieva 3.0T, Philips Medical System, Best, the Netherlands). On T2-weighted images, the mass showed high signal intensity. On T1-weighted images, it showed low signal intensity. On dynamic MRI using Gd-EOB-DTPA (Primovist, Bayer Schering Pharma, Berlin-Wedding, Germany; 0.025 mmol/kg), the mass showed strong enhancement in the arterial and portal venous phases (30 and 70 seconds after the injection of Gd-EOB-DTPA, respectively) but was isointense to the liver parenchyma in the late dynamic phase (180 seconds) (Fig. 1E, F). In hepatobiliary phase images, which were obtained 20 minutes after the injection, the mass was distinctly hypointense (Fig. 1G, H). Respiratory-triggered DWI sequences were performed with single-shot echo planar imaging with b values of 0, 50, 400, and 800 s/mm2. The apparent diffusion coefficient (ADC) was automatically calculated by the MR system and displayed as the corresponding ADC map. The mass showed high signal intensity on DWI even at high b-values and exhibited high signal intensity on the ADC map. The ADC value (2.21 × 10⁻³ mm2/s) of the tumor was more than twofold that of the surrounding liver parenchyma (1.01 × 10⁻³ mm2/s), which indicates that the hyperintensity seen on high b-value DWI was due to a very high signal intensity on T2-weighted images rather than diffusion restriction (Fig. 1I, J).
Initially, our first impression was that the patient had a benign enhancing nodule, such as focal nodular hyperplasia (FNH), FNH-like lesion, small hemangioma or dysplastic nodule. However, the possibility of HCC could not be ruled out. When all the possible diagnoses were explained to the patient, he chose to have the mass resected and underwent left lateral segmentectomy at our institution.
A gross inspection of the specimen showed an ill-defined yellowish nodule located about 0.5 cm from the hepatic capsule, measuring about 1.2 × 1 cm. Microscopically, a proliferation of well-formed bile ductules on a background of fibrous stroma was noted without cellular atypia or mitotic activity (Fig. 1K, L). The result from immunohistochemical stain was negative for carcino-embryonic antigen and p53, but positive for cytokeratin-19. The absence of p53 helps differentiate bile duct adenoma from metastatic adenocarcinoma. The presence of cytokeratin-19 shows that the nodule is of bile duct origin (5). The histologic diagnosis was intrahepatic bile duct adenoma on a background of alcoholic liver cirrhosis.
DISCUSSION
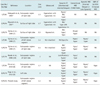
Bile duct adenoma typically manifests as a small hypervascular tumor in patients with chronic liver disease undergoing HCC surveillance, which makes this rare benign tumor a HCC-mimicker on imaging studies (6). Thus, radiologists should be familiar with the radiologic features of BDA in order to avoid unnecessary surgery or other harmful treatments. Thus far, to our knowledge, eight cases of BDA that were diagnosed through imaging findings have been reported (7-10). In Table 1, we summarized the radiologic features of the eight previously reported cases as well as our case from the present study. All but one lesion (9 cm in size) were smaller than 2.1 cm (mean, 1.3 cm after excluding the 9 cm lesion), and all of the lesions were located in the subcapsular portion or on the surface of the liver. On MRI, the tumors showed variable signal intensities on T1-weighted images, on all but one lesion, which had calcification and showed hyperintensity on the T2-weighted images. On dynamic contrast-enhanced CT scans and conventional Gd-enhanced MRI, most BDAs were hypervascular with contrast-enhancement in the arterial and delayed phases. Delayed or persistent enhancement in dynamic imaging may be due to the fibrous stroma within the tumor (11). All three BDAs examined using Gd-EOB-DTPA-enhanced MRI showed relative hypo- or isointensity in the late dynamic phase and distinct hypointensity in the hepatobiliary phase, which may be explained by the lack of hepatocytes within the tumors. Thus, the enhancement pattern may not be sufficient to differentiate between BDA and HCC because some HCCs do not show venous washout, especially when they are small (< 2 cm) (12).
Our case is the first to be studied with DWI and shows that DWI may be useful for this differentiation. In our case, BDA showed hyperintensity on both high b-value DWI and the ADC map with an ADC value (2.21 × 10⁻³ mm2/s) greater than the surrounding liver parenchyma (1.01 × 10⁻³ mm2/s). This means that the observed hyperintensity on high b-value DWI was not due to restricted diffusion, but rather to T2 shine-through effects. Moreover, the overall diffusivity of the tumor was more than twofold that of the adjacent liver parenchyma (13). Several previous studies on the usefulness of DWI for differentiating between benign and malignant hepatic lesions demonstrated that malignant lesions, such as HCC and metastasis, may tend to have ADC values that are lower (e.g., typically < 2 × 10⁻³ mm2/s) than benign lesions and non-tumorous liver parenchyma (14-19). A previous study also demonstrated that the histopathologic differentiation of HCC shows inverse correlation with the ADC value (20).
The high ADC value in our case may be explained by the microstructure of this particular tumor. Microscopically, BDA is characterized by a proliferation of tubulocystic structures (bile ductules) embedded in a fibrous stroma. In addition to the diffusion of water molecules in the ductules, the fibrous stroma may also have contributed to the high diffusivity of this lesion. Previous studies demonstrated that ADC of liver tissue gradually decreases as hepatic fibrosis progresses (21, 22). Recently, Mwangi et al. (23) measured and compared the ADC values of fibrous components and regenerative nodules through ex vivo and in vivo studies of cirrhotic livers. They demonstrated that the mean ADC value of fibrotic components was significantly greater than that of regenerative nodules or background cirrhotic liver parenchyma. The authors concluded that, contrary to prevailing notions, the reduced liver ADC value observed in cirrhosis is probably due to regenerative nodules rather than fibrotic bridges.
In summary, we experienced a case of BDA that was hypervascular and hepatocyte-defective on Gd-EOB-DTPA-enhanced MRI. On DWI, the tumor showed hyperintensity due to T2 shine-through effects on high b-value DWI and was also hyperintense on an ADC map with an ADC value greater than the surrounding cirrhotic liver parenchyma. Although we only report one case here, we believe that BDA may have inherently higher ADC values than the background liver because of its histologic features. We further suggest that DWI, along with ADC measurements, can be used as an important tool to reveal the benignity of BDA in clinical practice. Further diagnostic use of DWI with BDA cases is required to confirm our hypothesis.
 XML Download