

 PDF
PDF ePub
ePub Citation
 Print
Print


INTRODUCTION
Hemangiomas are the most common benign hepatic tumors (1-3). These tumors are frequently discovered incidentally during liver ultrasonography (US). Because hepatic hemangiomas are most often asymptomatic and have a low rate of complications, the role of imaging is to help diagnose the lesions (4). The characteristic US findings of hemangiomas are well-known (2, 4, 5), but unfortunately, some malignant hepatic tumors have US findings that are similar to those of hemangiomas. Large hemangiomas, which are often heterogeneous in US (6), can mimic malignant tumors. In such cases, contrast enhancement study using US, computed tomography (CT), or magnetic resonance imaging (MRI) is required for confirmation of hemangiomas, especially in high-risk patients, such as cirrhotic patients with new focal hepatic lesions or individuals with a history of malignancy (3, 5, 7-10). However, the need to maintain an intravenous line, the time delays for the diagnosis, the potential for allergic reactions to the contrast agents, and the higher costs of CT or MRI can limit their use in daily clinical practices. Patients with cardiac pacemakers, artifact-producing metallic clips, or claustrophobia may not be eligible for MRI.
Recently, stiffness imaging techniques that measure the shear wave velocity in liver tissues, such as magnetic resonance elastography, US-based elastography techniques, such as acoustic radiation force impulse (ARFI) elastography and shear wave elastography, have been introduced and are currently being used in the liver (11), as well as in the other organs (12-15). The ARFI elastography technique provides information about the stiffness of target tissues by using high-intensity, short-duration acoustic pulses (push pulses) to propagate shear waves through the targeted tissues. The stiffness is measured quantitatively with the shear-wave velocity by repeating push pulses and detection pulses across the region of interest (ARFI quantification), and it is mapped qualitatively to the images (ARFI 2-dimensional [2D] imaging) (16). In ARFI 2D imaging, a time series of displacements is estimated in the same location as the acoustic push pulse, and the maximum displacement is estimated from this time series. A tissue displacement map is generated after several push pulses are applied over a specified region of interest. In ARFI quantification, tissue is pushed, and the shear wave that is generated from the push is tracked by estimating displacement time series at different lateral offsets from the push location. Correlation of wave features (e.g., the wave front or wave peak) at these lateral offsets is used to estimate the shear wave velocity. Several studies have described successful applications of ARFI elastography for focal hepatic lesions with variable results (17-24). Two of these studies reported the preliminary potential for differentiating hemangiomas from malignant hepatic tumors using ARFI elastography (17, 18). However, these two studies have some limitations: a relatively small number of focal hepatic lesions were examined and both the ARFI quantification and ARFI 2D imaging were not being applied to all the patients.
Therefore, the purpose of our study is to investigate whether ARFI elastography with ARFI quantification and ARFI 2D imaging was useful for differentiating hepatic hemangiomas from malignant hepatic tumors.
MATERIALS AND METHODS
The Institutional Review Board of our hospital approved this study, and the requirement for informed consent was waived due to the retrospective nature of this study.
Patients
Between August 2009 and February 2010, ARFI elastography was routinely performed with conventional US of the liver in 110 patients with focal hepatic tumors who had been randomly allocated to the US examination room with an Acuson S2000™ scanner (Siemens Medical Solutions, Mountain View, CA, USA). The inclusion criteria were 1) patients with hepatic tumors proved by imaging or pathology; 2) patients who had undergone ARFI elastography with ARFI 2D imaging and ARFI quantification; and 3) patients with hepatic tumors observed in the right intercostal scans. According to these inclusion criteria, 10 patients with unproven hepatic tumors, 18 patients without ARFI 2D imaging or ARFI quantification, and eight patients not observed in the right intercostal scans were excluded, leaving 74 patients (45 males and 29 females; mean age, 56 years; range, 36-78) in our study.
In total, 101 focal hepatic tumors were included in this study in which 16 patients had two, four patients had three, and one patient had four focal hepatic tumors that met the inclusion criteria. The hepatic tumors included 28 hemangiomas (mean diameter, 4.50 ± 3.34 cm; range, 1.82-15.01 cm) in 24 patients, 26 hepatocellular carcinomas (HCCs) (mean diameter, 5.73 ± 3.06 cm; range, 2.25-13.34 cm) in 23 patients, three cholangiocarcinomas (CCCs) (mean diameter, 3.50 ± 0.87 cm; range, 2.54-4.02 cm) in one patient, 20 metastatic hepatic tumors from colorectal cancer (mean diameter, 3.57 ± 0.84 cm; range, 2.23-6.24 cm) in 11 patients, and 24 other metastatic hepatic tumors (mean diameter, 3.63 ± 1.91 cm; range, 1.56-9.08 cm) in 16 patients. All of the hemangiomas were diagnosed based on a combination of typical findings using either contrast-enhanced CT or MRI and the absence of an increase in tumor size for at least 12 months. The following imaging findings were used for the diagnosis of hemangiomas: lesions showing early, peripheral globular contrast enhancement isodense to the aorta during the hepatic arterial phase and centripetal fill-in enhancement during the portal venous phase. The specificity of this enhancement pattern for the diagnosis of hemangiomas is known to be 100% (25, 26). There was clinical and biochemical evidence of chronic liver diseases in two patients with hemangiomas.
The diagnosis of HCC was confirmed by surgery in three patients, percutaneous biopsy in two patients and clinical diagnosis in 18 patients. The clinical diagnosis for HCCs was made according to the recommendations of the American Association for the Study of Liver Disease (AASLD) 2005 (27). According to the AASLD 2005 guidelines, a diagnosis of HCC can be made if a mass larger than 2 cm in diameter shows typical features of an HCC (i.e., hypervascularity in the arterial phase and washout in the portal venous phase, as observed on contrast-enhanced CT or on MRI) or if a mass measuring 1-2 cm shows these features with the use of both modalities. All of the patients with HCCs in our study had chronic liver diseases: Child-Pugh classification A (n = 20) and B (n = 3).
The diagnosis of CCC was confirmed by a biopsy. The diagnosis of metastatic hepatic tumors was obtained by surgery in one patient, percutaneous biopsy in 11 patients and clinical diagnosis in 15 patients. The tumors in these 15 patients showed findings consistent with metastasis on contrast-enhanced CT and/or MRI and an incremental increase in size. The origins of the 44 metastatic tumors in 27 patients were as follows: 20 tumors were from colorectal adenocarcinomas, six were from pancreatic adenocarcinoma, five were from gastric adenocarcinoma, three were from gastric neuroendocrine carcinomas, two were from breast adenocarcinoma, two were from rectal melanoma, two were from renal cell carcinoma, two were from ovarian papillary adenocarcinoma, one was from pancreatic neuroendocrine carcinoma and one was from lung adenocarcinoma. There was no clinical or biochemical evidence of chronic liver diseases in patients with cholangiocarcinomas or metastatic hepatic tumors.
ARFI Elastography Acquisition
Acoustic radiation force impulse elastography was performed by two experienced radiologists (with 17 and 5 years of clinical experience in US of the liver, respectively) using an Acuson S2000™ scanner with a curvilinear transducer array operating at 4 MHz (4C1, Siemens Medical Solutions, Mountain View, CA, USA). B-mode images of the hepatic tumor were first obtained in the conventional manner, and ARFI 2D imaging and ARFI quantification were subsequently performed. After B-mode images with the hepatic tumor located as centrally as possible were obtained, the ARFI 2D imaging was performed by pushing the Virtual Touch™ tissue imaging button and placing a region of interest (ROI) on the hepatic tumor while trying to include the tumor and the adjacent hepatic parenchyma. When the Virtual Touch™ tissue quantification button was pushed, the shear wave velocity (SWV, expressed in meters per seconds) was measured in a central window of 5 mm axial by 4 mm width within the ROI that was graphically displayed at 1 cm axial by 6 mm width (28). To reduce cardiac- and respiration-related tissue motion in the ROI, all quantification was performed in the right lobe of the liver by the intercostal approach during a brief breath hold (neither full inspiration nor full expiration).
For hepatic tumors, at least five SWV values were obtained at the different area within tumors. Also for hepatic parenchyma, at least five SWV values were obtained at the different area around tumors away from the large hepatic vessels. Median SWV value was used as a representative value of the five SWV values of hepatic tumors and parenchyma. The difference in the SWV between each tumor and the adjacent hepatic parenchyma was calculated according to the following formula: the median SWV of the focal hepatic tumor - the median SWV of the adjacent hepatic parenchyma.
ARFI 2D Image Analysis
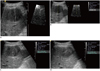
Two radiologists (with 18 and 5 years of clinical experience in conventional liver US, respectively) independently evaluated ARFI 2D images with the corresponding B-mode images on a PACS workstation monitor (Impax 5.3, Agfa Healthcare, Mortsel, Belgium). The radiologists were blinded to the clinical diagnosis, but they were aware that all of the patients had hepatic tumors. The images were presented to the readers in a random sequence of 4 months after last ARFI elastography had been obtained to avoid a recall bias. They evaluated the stiffness of the tumors as compared with the adjacent hepatic parenchyma in the ARFI 2D images. The tumor stiffness was classified as brighter (softer), the same color (equally stiff), slightly darker (slightly stiffer) or remarkably darker (markedly stiffer). They also evaluated the conspicuity and size of the tumors in the ARFI 2D images as compared with the B-mode images. The tumor conspicuity was classified as worse, the same or better. The tumor size was classified as not measurable, the same or not the same.
Statistical Analysis
The variation of median SWVs of tumors and adjacent hepatic parenchyma in each tumor group and the variation in median SWV difference between tumor and the adjacent parenchyma in each tumor group were expressed as the means ± standard deviations. The variation of SWVs in a single tumor was expressed as the mean of variance ± standard deviations of variance. These quantitative variables were compared among the hepatic tumor groups by the Kruskal-Wallis test and post-hoc subgroup analysis. The diagnostic performance of SWVs in discriminating hemangiomas from malignant tumors was obtained by using receiver operating characteristic (ROC) curve analysis. The chi-square test for trend was used to compare the qualitative variables of the hemangiomas and malignant hepatic tumors. These variables included the stiffness, conspicuity and size of the tumors. A p value less than 0.05 was considered to indicate a significant difference. The agreement between the two radiologists was tested using weighted Kappa (κ) statistics. The κ value was interpreted as follows: < 0.2, poor; 0.21-0.40, fair; 0.41-0.60, moderate; 0.61-0.80, good; and 0.81-1.00, very good. The statistical analyses were performed using MedCalc software (MedCalc for Windows, version 12.1.0; Mariakerke, Belgium).
RESULTS
ARFI Quantification of Focal Hepatic Tumors
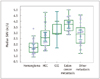
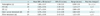
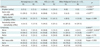
The mean SWVs of the hepatic tumor groups are shown in Table 1 and Figure 1. The SWVs of the hemangiomas were significantly lower than the malignant hepatic tumor groups: hemangiomas, 1.80 ± 0.57 m/sec; HCCs, 2.66 ± 0.94 m/sec; CCCs, 3.27 ± 0.64 m/sec; colon cancer metastases, 3.70 ± 0.61 m/sec; and other metastases, 2.82 ± 0.96 m/sec (p < 0.05). The SWVs of colon cancer metastases were significantly higher than the other malignant hepatic tumor groups, except CCCs (p < 0.05).
Regarding the variation of SWVs in a single tumor, the mean and standard deviation of variance of SWVs were as follows: all tumors, 0.21 ± 0.23 m/sec; hemangiomas, 0.10 ± 0.12 m/sec; HCCs, 0.17 ± 0.16 m/sec; CCCs, 0.13 ± 0.06 m/sec; colon cancer metastases, 0.33 ± 0.27 m/sec; and other metastases, 0.27 ± 0.30 m/sec.
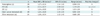
The mean SWVs of adjacent hepatic parenchyma are shown in Table 2. The SWVs of hepatic parenchyma in the HCC group were significantly higher than other tumor groups (p < 0.05).
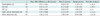
The mean difference in the SWV between the tumors and the adjacent hepatic parenchyma are shown in Table 3. The difference in the SWV of the hemangiomas was significantly lower than the malignant hepatic tumor groups, except HCCs: hemangiomas 0.53 ± 0.64 m/sec; HCCs, 0.35 ± 1.27 m/sec; CCCs, 2.03 ± 0.66 m/sec; colon cancer metastases, 2.45 ± 0.66 m/sec; and other metastases, 1.56 ± 1.12 m/sec (p < 0.05). The difference in the SWV of colon cancer metastases was significantly higher than the other malignant hepatic tumor groups, except CCCs. The difference in the SWV of HCCs was significantly lower than the other malignant hepatic tumor groups (p < 0.05).
Diagnostic Performances of ARFI Quantification for Differentiating Hemangiomas from Malignant Hepatic Tumors
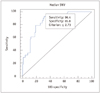
The area under the ROCs curve of SWVs for differentiating hemangiomas from malignant tumors was 0.86, with a sensitivity of 96.4% (95% confidence interval [CI], 81.7-99.9%) and a specificity of 65.8% (95% CI, 53.7-76.5%) at a cut-off value of 2.73 m/sec (p < 0.05) (Fig. 2). The area under the ROCs curve of SWVs for differentiating hemangiomas from non-HCC malignant tumors was 0.90, with a sensitivity of 96.4% (95% CI, 81.7-99.9%) and a specificity of 76.6% (95% CI, 62.0-87.7%) at a cut-off value of 2.73 m/sec (p < 0.05).
ARFI 2D Image Analysis between Hemangiomas and Malignant Hepatic Tumors
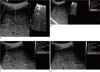
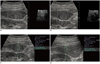
The results of the analysis of ARFI 2D images comparing hemangiomas, HCCs and other malignant hepatic tumors are presented in Table 4. With regard to stiffness, 13 of 28 hemangiomas (46.4%) were brighter (softer) or the same color (equally stiff) as compared with the adjacent hepatic parenchyma by both of the two reviewers (Fig. 3), whereas most malignant tumors except HCCs were darker (stiffer) in 45/47 (95.7%) and 47/47 (100%) by reviewers 1 and 2, respectively (Fig. 4) (p < 0.0001). There was no significant difference between hemangiomas and HCCs in the distribution of tumor stiffness (p > 0.05). Of the 14 malignant tumors scored as brighter (softer) or the same color (equally stiff) by either of the two reviewers, 12 were HCCs (Fig. 5) and two were metastatic tumors from melanomas.
With regard to conspicuity, six (21.4%) and nine (32.1%) of 28 hemangiomas showed better conspicuity on ARFI 2D images compared with B-mode images by reviewers 1 and 2, respectively, while 32 (68.1%) and 37 (78.7%) of 47 malignant tumors except HCCs showed better conspicuity by reviewers 1 and 2, respectively (p = 0.0003). Twelve malignant tumors (33.3%) had worse conspicuity by either of the two reviewers. Eight of these 12 tumors were HCCs (Fig. 5), and the others were metastatic tumors that originated from renal cell carcinoma and melanoma.
In terms of tumor size, there was no statistical difference among three groups in both reviewers for the distribution of 'not measurable', 'the same' and 'not the same'. The agreement between the two reviewers regarding stiffness, conspicuity and size was either good or very good (κ > 0.79).
DISCUSSION
This study demonstrated that the SWVs of hemangiomas were significantly lower than malignant hepatic tumors. Likewise, on the ARFI 2D images, hemangiomas had a significant tendency to be softer than malignant tumors. These results are not surprising from the pathological point of view because hemangiomas are composed of cavernous vascular spaces of various sizes filled with blood.
This study also showed that the difference in the SWV between hemangiomas and background liver was significantly lower than malignant hepatic tumors, and hemangiomas had a significant tendency to be less conspicuous than malignant tumors on the ARFI 2D images. This result means that hemangiomas are closer to liver tissues in stiffness than malignant tumors, which is consistent with prior studies (17, 18, 24, 29).
The mean SWV of hemangiomas was 1.80 ± 0.57 m/sec in this study, which is higher than two studies by Cho et al. (17) (1.51 ± 0.71 m/sec) and Davies and Koenen (18) (1.35 ± 0.48 m/sec) and lower than three studies by Heide et al. (20) (2.36 ± 0.77 m/sec), Gallotti et al. (21) (2.30 ± 0.95 m/sec) and Frulio et al. (22) (2.14 ± 0.49 m/sec). In addition, the hemangiomas in this study showed a wide SWV range, from 0.97 m/sec to 3.53 m/sec. The reason why hemangiomas have such a variation in stiffness could be explained by the pathological spectrum of hemangiomas. As described earlier, hemangiomas are composed of cavernous vascular spaces of varying sizes lined by a single layer of flat endothelium and separated by thin fibrous septae. However, hemangiomas may contain various amounts of fibrous septae and vascular thrombi. Rarely, hemangiomas may contain focal stromal calcification and ossification (30). Such changes of hemangiomas may contribute to increasing stiffness. This assumption is to some extent supported by the study of Heide et al. (20) reporting the highest mean SWV of hemangiomas ever recorded, in which the majority of hemangiomas were partially thrombosed in histopathological samples.
All five of the hemangiomas that were remarkably stiffer than background liver, as assessed by either of the two reviewers, showed SWV values of more than 2 m/sec. The cut-off value of 2.73 m/sec in this study would be more appropriate to differentiate hemangiomas from malignant hepatic tumors than that of 2 m/sec provided by Cho et al. (17) because the cut-off value in this study is closer to the value noted in a previous report by Davies and Koenen (18) that included the largest number of hemangiomas. They reported a similar cut-off value of 2.5 m/sec. Because more than half of the hemangiomas were stiffer than normal hepatic parenchyma, it is necessary to measure the SWV of tumors to reduce misdiagnosis when darker (stiffer) tumors, especially in patients with normal livers, are encountered.
The difference in the SWV between hemangiomas and the adjacent hepatic parenchyma was not significantly different from HCCs. The SWV difference between HCCs and background liver was very low (0.35 m/sec). With regards to lesion conspicuity, eight (30.8%) of the 26 HCCs showed worse conspicuity in ARFI 2D images than in B-mode images. This result can be explained by all patients with HCCs having chronic liver diseases. The mean of SWVs of hepatic parenchyma in patients with HCCs was 2.31 m/sec, which is much higher than that of the normal liver, resulting in a lower contrast of stiffness between HCCs and the adjacent hepatic parenchyma. Twelve (46.2%) of the 26 HCCs were brighter (softer) or the same color (equally stiff) than the adjacent hepatic parenchyma according to either of the two reviewers. DeWall et al. (31) reported that the HCC-to-background liver contrast was relatively low and decreases with increasing hepatic parenchymal fibrosis grade, with the HCC being softer than the surrounded background of F4-graded tissues. Therefore, when tumors being softer than or equally stiff as the background liver on ARFI 2D images are encountered in patients with chronic liver diseases, it is recommended to obtain the SWV of the tumors to differentiate hemangiomas from malignant hepatic tumors, especially HCCs.
In our study, the SWVs of colon cancer metastases and CCCs and the SWV difference between these tumors and the adjacent hepatic parenchyma were significantly higher than the other malignant hepatic tumor groups (p < 0.05). It could be related to the speed of tumor expansion within a mechanically restricted space and/or the tumor's own consistency, made by cellularity and matrix.
In our study, colon cancer metastatic masses showed the highest value of variance of SWVs in a single tumor (0.33 ± 0.27 m/sec) and wide range of median SWVs (2.84 m/sec to 5.00 m/sec). Frulio et al.'s (22) study which performed elasticity-pathology correlations of liver tumors also showed wide range of median SWVs (0.64 m/sec to 4.4 m/sec). In their study, three of colon cancer metastases showed median SWV less than 2 m/sec, which were massively necrotic (80%) without colloid component. They interpreted that the wide range was dependent on stromal remodeling as well as the amount of the mucoid components. Studies with larger numbers of metastases and elasticity-pathology correlations are required to establish the characteristics of pathological features that affect stiffness.
As described in the discussion section of a previous report (22), there have been debates regarding if ARFI quantification is helpful for differentiating between benign and malignant tumors in the liver. Two previously published studies insisted that ARFI quantification could not differentiate between the benign and malignant hepatic tumors (20, 22). The different opinions between our study and their studies could be explained by the difference in the type and consistency of included tumor groups. These two studies included focal nodular hyperplasias (FNHs) and hepatic adenomas, with both showing higher SWVs (FNH, 3.11 ± 0.93 m/sec, 3.14 ± 0.63 m/sec; hepatic adenoma, 2.23 ± 0.97 m/sec, 1.90 ± 0.86 m/sec) in the benign tumor group. In addition, more malignant tumors with hemorrhage, necrosis, or mucoid component with relatively lower SWVs were probably included in those studies than ours.
There are several limitations in our study. First, because of its retrospective nature, a certain degree of selection bias could not be avoided. Second, not all of the hepatic tumors were histopathologically confirmed by either percutaneous biopsy or surgery. Third, this study included only hepatic lesions obtained by right intercostal scanning. Therefore, the results of this study are limited to applications of hepatic lesions only by the right intercostal scanning. Fourth, in the interpretation of ARFI 2D imaging on tumor stiffness, the presence of chronic liver disease was not being considered, which would skew the results. However, as described above, only two patients had hemangioma, none with CCCs and metastases, and all patients with HCCs had clinical or biochemical evidences of chronic liver diseases. Thus it does not seem to be meaningful in our study to divide ARFI 2D imaging data according to the presence of chronic liver diseases. To reflect liver status objectively, SWVs on adjacent liver and tumor were obtained together and compared in our study. Fifth, we did not assess intraand interobserver measurement reproducibility. D'Onofrio et al. (32) reported the measurement reproducibility of ARFI quantification in normal liver. However, to the best of our knowledge, there was no study regarding the reproducibility of focal hepatic lesions. Because the size of ROI does not cover the entire tumor and the different tumor components such as hemorrhage, necrosis, and fibrosis have different levels of stiffness, thus, the measurement reproducibility for hepatic tumors may be lower than that for the normal liver.
In conclusion, ARFI elastography with ARFI quantifications and ARFI 2D imagings might be useful for differentiating hepatic hemangiomas from malignant hepatic tumors.
 XML Download