

 PDF
PDF ePub
ePub Citation
 Print
Print


INTRODUCTION
Na18F is a very useful imaging agent for the evaluation of bone abnormality. Owing to its high bone affinity, rapid clearance, and low protein binding, Na18F is superior to 99mTc-labeled phosphate agents in terms of bone image quality (1, 2). Furthermore, the fast kinetics of Na18F enables image acquisition as early as 30 minutes post injection, improving patient compliance (3, 4). In fact, Na18F has been introduced as a bone imaging agent for positron emission tomography (PET) since the 1960s (5). However, bone PET using Na18F could not be routinely used in clinical practice during those years due to the undeveloped PET imaging technology. The advent of gamma imaging technology and the development of 99mTc-labeled phosphate agents in the 1970s have almost replaced bone PET with the bone scan (6).
The recent innovative advancement of the PET technique allowed Na18F to resurface as a promising bone imaging agent (3, 7). The resolution of PET was superior to that of gamma camera imaging. PET integrated with CT, yielding PET/CT, further improved the lesion detection rate with the aid of anatomical information from the CT. Thanks to the effective attenuation correction algorithm, PET generated a more accurate quantitative image data set than gamma camera imaging (7-9). Furthermore, the supply crisis of 99Mo, the parent radionuclide of 99mTc, in 2010 had many physicians pay more attention to the usefulness of bone PET using Na18F (1, 4). Bone PET has been proven to be useful for a variety of bone diseases. Bone PET is able to effectively evaluate not only malignant diseases (8-10), but also benign bone diseases (11-13). Previously, we reported the utility of bone PET for the evaluation of bone abnormalities for the first time in Korea (14). However, in the previous study, bone PET was not directly compared to the bone scan for the detection rate of bone metastasis (BM). Thus, in the current study, we aimed to compare the diagnostic accuracies between bone PET and bone scan in cancer patients who underwent both imaging studies.
MATERIALS AND METHODS
Subjects
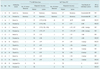
Sixteen cancer patients (M:F = 10:6, mean age = 60 ± 12) were enrolled in this study. Eleven of these patients were included in our previous report (14), which did not involve the head-to-head comparison between the bone scan and the bone PET. Underlying diseases of the patients included breast cancer (n = 5), prostate cancer (n = 5), thyroid cancer (n = 3), gastric cancer (n = 1), colon cancer (n = 1), and larynx cancer (n = 1) (Table 1). The bone scan and the bone PET were performed within 1 month apart from each other. The reasons for the bone evaluation were regular follow-up (n = 10), presence of suspicious BM (n = 5), and post-therapeutic evaluation of the known BM (n = 1). This study was approved by the Institutional Review Board of Seoul National University Bundang Hospital.
Bone Scan
A bone scan was performed using 99mTc-hydroxymethylenediphosphonic acid (HDP, Mallinckrodt, St. Louis, MO, USA). The dose of 99mTc-HDP was 1295 MBq (= 35 mCi). Whole body bone scan images were acquired using a dual-head gamma camera (Forte, ADAC-Philips, Holt, MO, USA) equipped with low energy high resolution collimator 3 hours post 99mTc-HDP injection.
Na18F Bone PET
For the bone PET image acquisition, no particular patient preparation was required. Na18F was generated from a reaction of 18O (p, n)18F using an in-house cyclotron (Kotron13, KIRAMS, Seoul, Korea). 370 MBq (= 10 mCi) of Na18F was injected into the patients. Ten minutes later, furosemide (10 mg, Lasix) was injected in order to flush the activity of the renal pelvis or urinary excretory system. Bone PET images were obtained from the skull base to the upper thigh or from the skull vertex to the feet, as requested by the physicians who had set the orders starting 30 minutes post Na18F injection. A dedicated PET scanner (Allegro, Philips Medical Systems, Andover, MA, USA) was used for 9 patients prior to the year 2009 (14) and a PET/CT scanner (DVCT, GE Healthcare, Milwaukee, WI, USA) was used for 7 patients afterwards. PET images from the dedicated PET scanner were attenuation-corrected using 137Cs transmission scans and then reconstructed using an iterative algorithm (Row-Action Maximum-Likelihood, Philips Medical Systems, Andover, MA, USA). PET/CT images were attenuation-corrected using the CT scan and then reconstructed using a 3-dimensional ordered-subset iteration algorithm (VUE point, GE Healthcare, Milwaukee, WI, USA). The resolutions of the reconstructed trans-axial images were 4.8 mm and 5.1 mm for PET and PET/CT, respectively.
Interpretation of Bone PET and Bone Scan
A positive finding for BM was defined as the presence of an abnormally high bony uptake, which is not associated with typical degenerative, traumatic or periarticular lesions (8). Diagnostic accuracies were also analyzed using the receiver operating characteristic (ROC) curve analysis by utilizing a 4-point grading system; definite, probable, less likely, and no evidence of BM. Consensus was reached by two nuclear medicine physicians in order to call a lesion BM.
A gold standard for BM was either the presence of typical findings compatible with BM in at least 2 imaging studies among MRI, 18F-FDG PET/CT or 131I whole body scan, or the presence of a clinical progression causing a change of treatment plan during at least a one-year follow-up. Those who had at least one proven BM lesion were considered BM positive patients regardless of the presence of any false positive BM findings.
RESULTS
Patient-Based Analysis
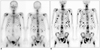
Of the 16 patients in the current study, 8 (50.0%) proved to be BM positive and 8 (50.0%) as BM negative. Of the 8 BM (+) patients, 2 had disseminated metastatic lesions, as shown in Figure 1. All of the 8 BM (+) patients were categorized as having BM in the bone PET, yielding 100% sensitivity, whereas 7 of the 8 BM (+) patients were positive in the bone scan, yielding an 87.5% sensitivity; the sensitivities were not statistically different between the bone PET and the bone scan (p > 0.05).
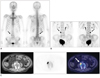
Of the 8 BM (-) patients, 7 were correctly categorized as having no BM in the bone PET, yielding an 87.5% (7/8) specificity, whereas only 2 were correctly diagnosed in the bone scan, yielding a 25.0% (2/8) specificity. As a result, a bone PET had a significantly higher specificity than a bone scan in the patient-based analysis (p < 0.05). A case showing higher specificity of a bone PET than a bone scan is demonstrated in Figure 2.
Overall, the accuracy of bone PET (93.8% = 15/16) was significantly greater than that of the bone scan (56.3% = 9/16, p < 0.05) in the patient-based analysis (Table 2).
Lesion-Based Analysis
Lesion-based analysis was conducted for the bone lesions identified by imaging studies, namely bone PET, bone scan, or CT. This is because benign bone lesions without abnormal findings in the imaging studies cannot be the lesions of interest in clinical practice. In addition, 2 patients who had innumerable BM lesions (Fig. 1, Table 1) were excluded in the lesion-based analysis because it was not sensible to identify a few more lesions in the clinical context of disseminated BM. As a result, 43 bone lesions were found in 14 patients. Of the 43 lesions, 31 were proven to be malignant and 12 were benign.
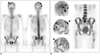
All of the 31 BM lesions were positive in the bone PET (sensitivity 100% = 31/31), whereas only 12 BM lesions were positive in the bone scan (sensitivity 38.7% = 12/31). As a result, bone PET was found to be significantly more sensitive than the bone scan (p < 0.01) (Fig. 3). Specificity was also significantly greater for bone PET (75% = 9/12) than the bone scan (8.3% = 1/12) (p < 0.05). Overall, the accuracy of bone PET (93.0% = 40/43) was significantly greater than that of the bone scan (30.2% = 13/43, p < 0.005) in the lesion-based analysis (Table 3).
False Positive Findings of Bone PET
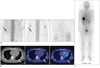
Three false positive bone PET lesions were noted in 3 patients (nos. 5, 6, and 9). The first two were sacrum and rib lesions from patients with spinal bone metastases proven by a spine MRI. With regard to the other proven bone metastases, the two lesions were strongly suggested to be clinical metastatic lesions. However, bone PET positive sacral lesion was negative in 18F-FDG PET/CT, while other bone PET positive lesions were all positive in the same patient. In addition, bone PET positive rib lesion was clinically stable without any evidence of a disease progression for 4 years and 2 months afterward. Thus, the 2 lesions were considered to be benign. For the last bone lesion in patient no.9 (Fig. 4), the rib lesion appeared to be positive in both the bone scan and the bone PET; however, it was negative on the 18F-FDG PET/CT and the 131I whole body scan. Serum thyroglobulin (< 0.2 ng/mL) and anti-thyroglobulin antibody (< 25 U/mL) were undetectable. The lesion was considered to be a benign lesion because other imaging studies were all negative; moreover, there was no evidence of a disease progression thereafter for more than one year.
ROC Curve Analysis
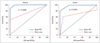
In the ROC curve analyses, the bone PET was significantly more accurate than the bone scan for the detection of BM. In the patient-based analysis, the area under the curve (AUC) of the bone PET (AUC = 0.992, standard error [SE] = 0.0110, 95% confidence interval [CI] = 0.781-1.000) was significantly higher than that of the bone scan (AUC = 0.750, SE = 0.118, 95% CI = 0.476-0.927) (p = 0.0306). In addition, in the lesion-based analysis, the AUC of the bone PET (AUC = 0.976, SE = 0.0155, 95% CI = 0.876-0.999) was significantly greater than that of the bone scan (AUC = 0.691, SE = 0.0752, 95% CI = 0.532-0.823) (p = 0.0001) (Fig. 5).
Bone PET vs. Bone PET/CT
The diagnostic accuracies were compared between bone PET and bone PET/CT. No difference was observed between the two studies in both patient and lesion-based analyses (Table 4).
DISCUSSION
Bone PET has been proven to be a useful bone imaging modality worldwide (1, 4). The combination of excellent physico-chemical characteristics of Na18F and robust imaging techniques of modern PET scanner enabled the bone PET to be the most promising tool for bone imaging. Not only malignant bone diseases (8-10), but benign metabolic bone diseases (11-13) have also been successfully investigated using the bone PET. Furthermore, PET integrated with CT, yielding PET/CT, increased the diagnostic accuracy of bone PET in a variety of bone diseases (16).
In Korea, there has been only one clinical report on Na18F bone PET (14). The study investigated only the feasibility of Na18F bone PET in both cancer and benign bone disease patients. However, a critical question regarding the diagnostic accuracy of bone PET vs. bone scan for the detection of BM has not been addressed in the previous report. Thus, in the current study, we performed a direct comparison between the diagnostic accuracies of Na18F bone PET vs. 99mTc-HDP bone scan in cancer patients who underwent both imaging studies. The major finding of the current study is that the bone PET was found to be more accurate than the bone scan in the evaluation of BM and further, bone PET was shown to improve the sensitivity (in the lesion-based analysis) and specificity for BM.
Bone PET could effectively exclude non-metastatic bone lesions, which was reflected by its high specificity, compared to the bone scan in both patient- and lesion-based analyses. The improved specificity of the bone PET compared to the bone scan seems to be mostly due to the tomographic nature of a PET and/or supplemental information from a CT (1, 4, 15). Planar bone scan images often fail to give confidence to readers regarding the exact location of the bone lesions due to the lack of depth information. On the contrary, bone PET is an inherently tomographic imaging modality with or without CT. Of course, if we had adopted a single photon emission computed tomography (SPECT) instead of the simple planar bone scan, the diagnostic accuracy of 99mTc-HDP bone imaging would have been better (16), although a whole body coverage by SPECT might have been unrealistic due to the limited axial field of view of the current gamma camera. Another reason for the high specificity of bone PET compared to a bone scan also could be explained by the way the patients were recruited to the current study. Bone scan has already been proven to be useful as an initial screening test for BM evaluation (6, 15), and patients without any abnormality on their bone scans are not regarded as candidates for further tests, such as bone PET. Therefore, due to the test referral bias, true negative bone scan cases are typically excluded in this kind of retrospective study, resulting in a low specificity of the bone scan.
Bone PET sensitivity for individual metastatic lesions was superior to the bone scan. However, bone PET and bone scan had comparable sensitivities in the patient-based analysis (Table 2). With regard to the sensitivity of BM, bone PET seems to have a physico-chemical advantage over the bone scan (8, 17). The high first-pass extraction, rapid blood clearance, and low protein binding of Na18F provide bone PET imaging with a high image-quality and a high lesion-contrast (3, 7). In our cases, bone PET clearly showed a more prominent uptake pattern compared to the bone scan in most of the BM lesions (Figs. 1-3), providing the readers with more confidence in the reading. Nevertheless, given the comparable sensitivity in the patient level (Table 2) and the relatively low cost, the bone scan may continue to be the primary screening study for the evaluation of BM for the time being. In fact, one crucial obstacle in the clinical application of bone PET is the cost-effectiveness of bone PET over the bone scan (10).
In addition, there are several advantages of bone PET over the bone scan. First, PET imaging is quantitative, whereas gamma camera imaging is not (1, 4, 7). Bone blood flow and bone turnover could be quantitatively measured using dynamic Na18F PET studies in malignant bone disease, Paget disease, or renal osteodystropy (3, 11, 18, 19). Second, patient compliance for a bone PET should be better than that for a bone scan because it only takes about 0.5-1 hour for a bone PET acquisition in order to get started after the injection, which is shorter than the time for a bone scan, which takes at least 3-4 hours. Third, none-medical issues, such as the supply problem of 99Mo and the parent radionuclide of 99mTc may advance the clinical use of Na18F bone PET faster than expected. In this regard, physicians need to increase their awareness and pay closer attention to the development of Na18F bone PET in the future.
In conjunction with all the mentioned points above, the unique strength of the current study could be the comparison of the diagnostic accuracies between bone PET/CT and bone PET. Although the analyzed number of patients (n = 16) or lesions (n = 43) were quite low compared to other studies, the competency of bone PET was not inferior to that of bone PET/CT (Table 4). Although bone PET/CT may be more accurate for the identification of a particular BM lesion than the bone PET (Fig. 2), overall, the two studies were equivalent in terms of detection of BM in the level of patients and individual lesions (Table 4). If the results could be advocated in other larger scale studies, it might provide some chances of clinical utility to the out-dated dedicated PET scanners in a few hospitals in Korea, including one in our hospital.
Limitation
The small sample size in the present study may have biased the final results. The characteristics of BM (i.e., osteoblastic, osteolytic, or mixed) or the known predilection site of BM may also have played some roles for determining the diagnostic accuracy of the bone PET. The heterogeneity of patient diseases also may have affected the low diagnostic accuracy of the bone scan; particularly with single malignant disease patients, such as breast cancer, a bone scan may have a better diagnostic accuracy than other studies (20, 21). Furthermore, the fact that not all of the suspicious lesions were pathologically proven is another critical limitation of the study. 100% sensitivity of bone PET in the current study may overestimate the genuine diagnostic accuracy of the bone PET. Some bone metastatic lesions have been reported to be contained within the bone marrow without involving the cortical bone (22). If we had performed more 18F-FDG PET/CT studies, such BM lesions may have been missed by the bone PET, but observed by 18F-FDG PET/CT, generating a sensitivity of bone PET to be lower than 100%. 18F-FDG PET has been reported to be more accurate than 99mTc-MDP bone scan (21); however, 18F-FDG PET seems to have a lower accuracy for BM than Na18F bone PET (14). As a matter of fact, not only 18F-FDG PET/CT, but also MRI sometimes offers equivocal findings regarding the nature of bone lesions (20). Without a doubt, a bone biopsy would determine the exact nature of the bone lesion; yet, it is not always a practical approach for patient management. Furthermore, the cost-effectiveness of a bone PET was not evaluated in this study. In this regard, further large scale studies are required to determine the role of the bone PET for the evaluation of BM in the current medical reimbursement condition of Korea.
Conclusion
Na18F bone PET is more accurate than 99mTc-HDP bone scan for the evaluation of BM. Bone PET by itself has a potential to be a gold standard test for BM. However, without sufficient confirmatory data in Korea, we claim, solely from our findings, that the accuracy of bone PET is superior to that of the bone scan.


 XML Download