

 PDF
PDF ePub
ePub Citation
 Print
Print


INTRODUCTION
Transcatheter arterial chemoembolization (TACE), using a mixture of various anticancer agents and iodized oil, is widely accepted as an effective palliative measure with five-year survival rates after treatment exceeding 50% in patients with intermediate-stage hepatocellular carcinoma (HCC), who are not candidates for curative therapies (1-4). When caring for the patients with HCC using TACE, it is very important to detect the residual viable tumor or remote recurrence on follow-up imaging studies, as when the viable tumor is suspected, another session of TACE is needed for an effective control of the HCC. For this purpose, multiphasic CT is widely used at many institutions (5). As retained iodized oil is best seen on CT images as an intense, hyperattenuating material located at the site of uptake, which usually appear in the region of the tumor, HCCs with complete uptake of iodized oil after TACE are considered to be completely necrotic (6). However, retained iodized oil in the tumor can mask enhancements within the tumor (7). Furthermore, in patients treated with TACE for HCC, it is sometimes difficult to monitor a marginal or remote tumor recurrence on multiphasic liver CT because of the presence of a variety of hyperattenuating lesions seen in the arterial phase images, i.e. lesions showing faint traces of iodized oil, masses previously injected with iodized oil, and TACE-related arterioportal shunts (8, 9). There have been several previous reports describing the limited accuracy of multiphasic liver CT for evaluating the therapeutic efficacy of TACE for HCC (10, 11).
More recently, quantitatively color mapping of the arterial enhancement fraction (AEF) for the liver, which is defined as the ratio of the attenuation increment during the arterial phase to the attenuation increment during the portal phase, can improve the diagnostic performance of multiphasic liver CT for detecting the newly diagnosed HCC in the cirrhotic liver by providing information regarding the arterio-portal perfusion balance of HCC and liver parenchyma, without additional radiation exposure (12). We hypothesized that information regarding the arterio-portal perfusion balance of HCC, provided by the color mapping of hepatic AEF, can also improve the diagnostic performance for evaluating the therapeutic efficacy and for detecting HCCs in patients treated with TACE. Therefore, the purpose of this study is to investigate the additional diagnostic value of color mapping of the hepatic AEF to evaluate the therapeutic efficacy and to detect recurrent HCCs, remotely or marginally, in patients previously treated with TACE.
MATERIALS AND METHODS
Patients
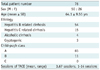
Our Institutional Review Board approved this retrospective study. Written informed consent was not required since the imaging data were obtained from routine liver CT examinations performed during a routine clinical practice, no additional diagnostic examination was needed for this study. The case enrollments, as well as the control of data and information, were performed by two authors. Between June 2007 and October 2007, 205 consecutive patients, who previously underwent TACE for treatment of HCC, performed multiphase liver CT on a CT scanner (Somatom Sensation 16, Siemens Medical Solutions, Erlangen, Germany). Among these patients, 76 met the following inclusion criteria: 1) when multiphasic liver CT images showed the recurrent HCCs (n = 50), an additional session of repeated TACE was performed within one month after obtaining multiphasic liver CT; 2) for the recurrent HCCs (n = 50), less than 10 HCC nodules seen on multiphasic CT images; 3) Recurrent HCC lesions (n = 50) without macroscopic vascular invasion, i.e. portal vein or hepatic vein invasion as vascular invasion could alter the hepatic parenchymal hemodynamics; 4) patients with available follow-up CT or MR images greater than twelve months after the repeated TACE for the recurrent HCCs (n = 50); and 5) when multiphasic liver CT images did not show the recurrent HCCs (n = 26), available follow-up images more than twelve-month interval to assess the focal live lesion. The remaining patients were excluded from the study participation for the following reasons: patients with more than 10 HCC nodules seen on multiphasic liver CT (n = 37); patients with an HCC lesion with vascular invasion (n = 39); and lack of follow-up images for at least a twelve-month period (n = 53). We also retrospectively reviewed the 76 study patients' medical records and radiology reports using our electronic medical records system (Bestcare, Ezcaretech, Seoul, Korea). The cause of cirrhosis and HCC, Child-Pugh classes, and the number of previous TACE sessions were recorded and are summarized in Table 1.
Initial Diagnosis of HCC
Among the 76 study patients, 68 were initially diagnosed with HCC, according to the recommendations from the American Association for the Study of Liver Disease (AASLD) 2005 (13). All of these 68 patients underwent TACE, and hepatic angiography obtained during the TACE, in addition, follow-up CT images confirmed the HCC diagnosis, i.e. tumor staining on the hepatic angiogram and retained iodized oil uptake on the follow-up CT images. The remaining eight patients were initially diagnosed with HCC, according to the histopathology findings. Two of these patients underwent liver biopsy, and the biopsy specimens revealed HCC on microscopic examination. Six patients underwent hepatic resection, i.e. left hemihepatectomy in one, right posterior segmentectomy in one, segment 5 segmentectomy in one, segment 6 segmentectomy in two, and segment 8 segmentectomy in one. The pathology specimens and microscopic examination confirmed the HCC diagnosis.
Lesion Confirmation for Marginally or Remotely Recurrent HCC: Reference Standard
In this study, the diagnosis of marginally or remotely recurrent HCC lesions after TACE was confirmed by a clinical diagnosis, according to the AASLD 2005 recommendations (13). All hepatic lesions, which were suspected to be marginally or remotely recurrent HCC and were seen on multiphasic liver CT and hepatic angiography obtained during TACE as well as on the follow-up CT images, were analyzed by two experienced abdominal radiologists who had not participated in the image interpretation sessions. The number and locations of the marginally or remotely recurrent HCC lesions were determined on the basis of a combined interpretation of the pre-TACE multiphasic liver CT and follow-up imaging findings, including the serial multiphasic CT findings, their angiographic appearance on hepatic angiography obtained during TACE, and retained iodized oil uptake on the follow-up CT, which were usually obtained two weeks after TACE. The decision regarding the presence of recurrent HCC lesions was reached by a consensus.
Transcatheter Arterial Chemoembolization
After performing hepatic angiography, TACE was performed using a mixture of iodized oil (Lipiodol; Andre Gurbet, Aulnay-sous-Bois, France) and doxorubicin hydrochloride (Adriamycin RDF; Ildong Pharmaceutical, Seoul, Korea) in 50 of the 76 patients who were suspected to have recurrent HCC, which were seen on both multiphasic liver CT and angiography within one month after their CT scanning. In patients with Child-Pugh class A or B cirrhosis, without portal vein thrombosis, particle embolization was performed using Gelfoam (Upjohn, Kalamazoo, MI, USA). Chemoembolic material was injected through a 3 Fr microcatheter super-selected for tumor-feeding arteries until a reflux of lipiodol into the draining portal vein was observed.
CT Acquisition
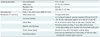
All CT examinations were performed on a MDCT scanner (Somatom Sensation 16, Siemens Medical Solutions, Erlangen, Germany). The key scanning parameters and multiphasic acquisitions are summarized in Table 2.
All patients underwent quadruple-phase MDCT before and after TACE. To evaluate the therapeutic effect after an additional session of repeated TACE, follow-up CT, using the same protocol, was performed 4-6 weeks after TACE. In patients with no viable tumor in the liver, additional follow-up CT scans were then performed, at three-month intervals. For patients with viable tumor remaining after TACE, an additional session of TACE procedures was performed.
Quantitative Color Mapping of the Arterial Enhancement Fraction of the Liver
Based on a previous study by Platt et al. (14, 15), region of interest-based ratios of arterial enhancement to peak hepatic enhancement are calculated on a pixel-by-pixel basis, and images of the AEF can be generated using a prototype software (HepaCare, Siemens Medical Solutions, Erlangen, Germany), as described in a previous study (12). According to several previous studies (16, 17), the AEF can be considered to indirectly reflect the ratio of the hepatic arterial perfusion to that of the total perfusion, and can be used as an approximate surrogate for the hepatic perfusion index. In addition, in a previous study by Kim et al. (12), quantitative color mapping was shown to significantly increase the visual conspicuity of HCC lesions in patients with liver cirrhosis, as the AEF increases both for higher arterial enhancement, as well as for reduced portal venous enhancement.
Calculating the AEF on a pixel-by-pixel basis requires registration of the 3-phase data sets, i.e. unenhanced, arterial, and portal venous, onto each other in order to precisely align them anatomically in three dimensions. This is necessary in order to compensate for the unavoidable differences in the breath-hold level of the three scans, and requires non-rigid warping techniques because of the relatively complex deformation of the liver during breathing (12). The very high local contrast of retained iodized oil, i.e. up to 1000 HU or more poses a considerable challenge for the registration algorithm, which must simultaneously be locally precise, globally smooth, and continuous. The subtraction operation can transform even small misalignments of dense retained iodized oil nodules into large misregistration artifacts in their immediate vicinity. In order to minimize these artifacts, landmark-based constraints were added to the techniques previously used (12). By a simple, one-point mouse click, the operator marks retained iodized oil-laden nodules in the three-phase data set. The click points are substituted by locally calculating the center of the mass of the retained iodized oil-laden structures. These points are then used as landmarks in a "gravitational-like" fashion, i.e. the closer a voxel is to a landmark, the more it is forced toward it.
Arterial and portal phase CT volumes are both registered onto the unenhanced volume, which serves as the reference volume. The unenhanced data are then subtracted from the arterial and portal venous data. After smoothing the differences in three dimensions, the ratio is formed and multiplied by 100 in order to obtain the results in percentages. Pixels that show no enhancement are suppressed. The resulting data are mapped to a spectral color scale that displays 0% as purple and 100% as red, and are fused with the unenhanced reference image to add additional anatomic landmarks.
Our CT images were transferred to a workstation (Leonardo; Siemens Medical Solutions, Erlangen, Germany), equipped with prototype software (HepaCare, Siemens Medical Solutions, Erlangen, Germany) that implemented the techniques described above. Manual marking of the retained iodized oil nodules was made by one author, who was not involved in the image interpretation session. According to the number and location of retained iodized oil nodules in the liver of each patient, one to five manual markings of the retained iodized oil nodules were made. Generating the images for each patient took less than two minutes. The registration of multiphasic liver CT for the creation of AEF color mapping was successful in all patients previously treated with TACE for HCC in this study. The calculated sets of color AEF images were stored as DICOM images on the workstation, and were then transferred to our Picture Archiving and Communications System (PACS) for image analysis. After that, the image review process was possible in combined multiphasic liver CT and AEF color mapping.
Image Analysis
Two radiologists with varying levels of clinical experience interpreting liver CT images, i.e. a third-year resident and an attending physician with eight years of clinical experience, independently and retrospectively analyzed the two-image data set, i.e. the multiphasic liver CT only and the combined image set of multiphasic liver CT and AEF color mapping. All CT images and AEF color mapping images were reviewed in stack mode on a PACS workstation monitor (m-view, INFINITTI, Seoul, Korea). The radiologists were aware that the patients had HCC lesions and had previously underwent TACE for treatment of their HCCs, but the radiologists were blinded to both the detailed locations and the numbers of viable HCC lesions, in addition, they had not seen the original CT reports. Two image interpretation sessions within a two-week interval were performed by each radiologist. The first image set included multiphasic CT of unenhanced, arterial, portal, and equilibrium phase images, and the second set was a combined image set of the quantitative color mapping of the AEF and multiphasic CT images. The image sets were randomly presented in no specific patient order, in order to minimize any possible recall bias. All reviewers were familiar with AEF color mapping of the liver after having practiced it using several sample cases.
The two radiologists were asked to record the number, size, and segmental locations of the lesions, and to assign a confidence level for the diagnosis of a remote recurrence or marginal recurrence of HCC, using a 4-point scale: 1, probably no HCC; 2, possibly HCC; 3, probably HCC; and 4, definitely HCC. Before interpreting the images, the reviewers were instructed that categorization at the confidence levels 3 and 4 would be considered a positive diagnosis of viable HCC. Lesions assigned a confidence level of 3 or 4 and confirmed to be HCC were considered as true-positives, while lesions assigned a confidence level of 1 or 2 and proven to be HCC, were considered as false-negatives. In order to prevent lesion misallocation, a standardized template form was used, which the interpreter indicated the segmental location of each lesion.
For objectivity and reproducibility of the image analysis performed in this study, the criteria for HCC were provided. The criteria for HCC detected on multiphasic CT were defined as nodules that showed 1) homogenous or variegated contrast-enhanced foci and visible intratumoral arteries on arterial phase images, 2) washout during the portal venous or equilibrium phase, 3) discrete capsules on arterial and delayed phase images, 4) a mosaic appearance on portal and equilibrium phase images, and 5) a hypovascular or hypoattenuating lesion larger than 2 cm in diameter during all dynamic phases, which did not fulfill the diagnostic criteria for a cyst, i.e. smooth margins, homogeneous low attenuation similar to that of water, and no enhancement during the contrast-enhanced examination (12, 16, 18, 19). For the retained iodized oil nodules, resulting from the previous TACE, a marginal viable HCC nodule was considered to appear as a hyperattenuating or isoattenuating lesion during the hepatic arterial phase, and as a hypoattenuating lesion during the portal venous phase.
Quantitative color mapping was used to change the diagnostic confidence level obtained from the criteria for HCC on a multiphasic CT. Based on the previous results by Kim et al. (12), the following criteria for the diagnosis of HCC were provided to the reviewers. When the color mapping images showed a nodular or mass lesion with homogenously or heterogeneously increased AEF compared to that of the liver parenchyma (AEF cut-off value 45%), the lesion was considered to be HCC. However, when color mapping images showed a peripheral, wedge-shaped lesion with increased AEF, it was assumed to indicate an arterioportal shunt (12). On color mapping of the AEF, the HCCs with retained iodized oil, but without enhancement, were suppressed and were expressed as a blank. For HCCs with partial uptake of retained iodized oil from previous TACE, a marginal, viable HCC nodule was considered to be present when there were any nodular foci of increased AEF, compared to that of the adjacent liver parenchyma within the tumor.
Statistical Analysis
The quadratic, weighted kappa (κ) value was used to assess the interobserver agreement between the two reviewers for each interpretation session intended for detecting HCCs. We considered a κ value of more than 0.81 to represent excellent agreement and values of 0.61-0.80 and 0.41-0.60 to represent good and moderate agreement, respectively. A value of less than 0.40 was considered to represent fair agreement. To obtain the kappa statistics, MedCalc version 9.1.0.1 (MedCalc Software, Mariakerke, Belgium) was used.
To analyze and compare the performance of the two-image data set for detecting HCCs, a jackknife-alternative, free-response, receiver-operating-characteristic (JAFROC) analysis was performed using a maximum likelihood estimation program (JAFROC version 2.3; http://jafroc.radiology.pitt.edu) (20). The mean diagnostic accuracy was calculated according to the mean figure of merit (θ), which was defined as the probability that on normal images a lesion is rated higher than the highest rated non-lesion. An F-statistic test was used internally for the analysis of variance, and yielded a p value for rejecting the null hypothesis of no difference between the image interpretation sessions (21). The sensitivity and positive predictive values for detecting HCC, on a per-lesion and per-patient bases, were then calculated. The sensitivity of multiphasic CT and the combined image set with color mapping of the AEF were compared using the McNemar test, and the positive predictive values were compared using a Fisher's exact test. A p value < 0.05 was considered to indicate a statistically significant difference. Computer software packages (SPSS 12.0 for Windows, SPSS, Chicago, IL, USA) were used for the statistical analyses.
RESULTS
Diagnosis of Marginally or Remotely Recurrent HCC: Reference Standard
Fifty of the 76 (50/76, 65.8%) study patients had a total of 126 recurrent HCC nodules, after receiving TACE. There were 89 remotely developed HCCs (mean diameters; 1.6 ± 0.6 cm, ranges; 0.8-3.2 cm) in 41 patients, and 37 marginally recurrent HCCs lesions (mean diameters, 1.8 ± 0.7 cm, ranges; 0.9-3.7 cm) located around the previously retained iodized oil nodules in 32 patients. Twenty-three patients had both remotely developed HCCs and marginally recurrent HCCs. These 50 patients with recurrent HCCs underwent TACE within one month, after undergoing multiphasic liver CT; they had confirming imaging findings of recurrent HCC on multiphasic liver CT and angiography during TACE and responded to TACE, as noted on the follow-up CT scan (nodular retained iodized oil uptake). An increased alpha-fetoprotein level greater the 200 ng/L was detected in 12 of these 50 patients. There was one HCC lesion in each of the 20 patients, two HCC lesions in each of the 11 patients, three HCC lesions in each of the eight patients, four HCC lesions in each of the four patients, five HCC lesions in each of the three patients, seven HCC lesions in each of the three patients, and eight HCC lesions in one patient. In the remaining 26 patients, there were no recurrent HCC lesions; and therefore, repeated TACE was not performed. Follow-up images obtained after more than a twelve-month interval, were used as confirmation, and stable hepatic lesions without a definite enhancing area were seen in these 26 patients, on a follow-up imaging. In addition, the blood concentration of the alpha fetoprotein level was also in a normal range in these 26 patients.
Diagnostic Performance of Multiphasic Liver CT and AEF Color Mapping
The reader-averaged values of the free-response ROC figure of merit (θ) were 0.699 for first interpretation session for multiphasic liver CT alone, and 0.831 for the second interpretation session for the combined data set of multiphasic liver CT and combined AEF color mapping. In addition, the 95% confidence interval for Δθ, i.e. the difference in the figures of merit between the two interpretation sessions, was -0.194-0.069. JAFROC analysis indicated that the difference between the two interpretation sessions was significant for detecting HCC at the 5% level (F-statistic = 17.27, p = 0.000059).
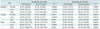
The diagnostic performance of multiphasic liver CT and the combined data set of AEF color mapping, in terms of the sensitivity per lesion and sensitivity per patient for detecting HCCs, are presented with a comparative statistical analysis in Table 3. The mean sensitivity of the second interpretation session for the combined data set of multiphasic liver CT and the combined AEF color mapping (207/252, 82.1%), was significantly higher than that of the first interpretation session for multiphasic liver CT alone (158/252, 62.7%) (p value < 0.001 according to the McNemar test). When the HCC lesions were categorized into two groups, i.e. marginal local recurrence and remote, recurrent HCC, the second interpretation session for the combined data set of multiphasic liver CT and AEF color mapping showed significantly higher sensitivities in both the remote, recurrent HCC group (80.3%, 143/178 for the second interpretation session vs. 60.1%, 107/178 for the first interpretation session, p value < 0.001) (Fig. 1) and for the marginal, local recurrence group (86.5%, 64/74 for the second interpretation session vs. 68.9%, 51/74 for the first interpretation session, p value = 0.0044) (Fig. 2). In terms of per patient sensitivity, both reviewers achieved increased sensitivity during the second interpretation session, compared with that of the first interpretation session, and a statistically significant difference was achieved by one of the reviewers, who was an attending physician.
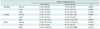
Regarding the positive predictive value, the mean positive predictive value decreased in the second interpretation session as there are a great number of false positives with AEF color maps (Table 4), however, there was no statistically significant difference in the positive predictive value between the two image interpretation sessions (74.5%, 158/211 for the first interpretation session vs. 71.6%, 207/289 for the second interpretation session, p value = 0.4754 using Fisher's exact test). For the resident reviewer, the positive predictive value was slightly higher in the second interpretation session, and for the attending physician, the positive predictive value had decreased in the second interpretation session, compared with that of the first interpretation session. However, a statistically significant difference was not seen for either reviewer in the two interpretation sessions.
Interobserver Agreement
For detecting HCCs, a moderate interobserver agreement was achieved between the two reviewers for multiphasic liver CT (κ value: 0.568), and fair interobserver agreement was achieved between the two reviewers for combined multiphasic liver CT and AEF color mapping (κ value: 0.384).
DISCUSSION
In our study, the combined data set of quantitative color mapping of the AEF and multiphasic liver CT, significantly improved the diagnostic performance for detecting viable HCC in patients treated with TACE, compared to that of multiphasic liver CT only (p value = 0.00059). Furthermore, the mean sensitivity per lesion of the second interpretation session of the combined data set, with quantitative color mapping of the AEF, was significantly higher than that of the first session with multiphasic CT alone. Specifically, statistically improved sensitivity with the combined data set, with quantitative color mapping of the AEF and multiphasic liver CT, was achieved with both marginal, locally recurrent HCC and with remotely recurring HCC.
This improved sensitivity for detecting remotely recurring HCCs can result from increased lesion conspicuity on AEF color mapping. The hepatic AEF can indirectly reflect the ratio of the hepatic arterial perfusion to that of the total perfusion. Therefore, the relatively increased arterial perfusion, compared to the total hepatic perfusion, as seen in HCCs, resulted in a high AEF value. Even iso- or slightly hypoattenuated nodules, such as those seen on arterial phase images, can show a higher AEF than that of the liver parenchyma, if the nodules show evident hypoattenuation during the portal venous or equilibrium phase (12). Therefore, the quantitatively calculated AEF of HCC tends to amplify its arterial portal perfusion alterations, which can then increase the lesion conspicuity by optimizing the maximum liver-to-tumor contrast.
Furthermore, in our study, the significantly improved sensitivity of the combined data set, with that of the AEF color mappings, was achieved, not only in remotely recurrent HCC, but also in the marginal recurrence of TACE-treated HCC. Detection of subtle arterial enhancement around a retained iodized oil nodule can be difficult as the retained iodized oil nodule shows high attenuation on all phase images. Volume averaging effects around the masses previously injected with retained iodized oil and the beam hardening artifact around retained iodized oil can make it difficult to evaluate the true arterial enhancement. However, in color mapping of the AEF, true arterial enhancement is calculated by subtracting the unenhanced attenuation from the arterial attenuation. Therefore, in our study, subtle arterial enhancement around the areas of previously injected retained iodized oil could be clearly seen because the retained iodized oil attenuation could be subtracted in color mapping of the AEF.
In our study, the combined data set of the AEF color mapping and the multiphasic liver CT improved not only the sensitivity per lesion, but also the sensitivity per patient. Five additional patients reviewed by the resident and eight additional patients reviewed by the attending physician were classified as having viable HCC in the combined data set with color mapping of the AEF and multiphasic liver CT. Further, significantly increased sensitivity per patient was achieved by one reviewer, i.e. the attending physician. Considering our results, we believe that quantitative color mapping of the AEF has additional value for determining whether or not an additional session of TACE is needed. This additional value of AEF color mapping can facilitate appropriate decision regarding the care of patients treated with TACE that can achieve improved tumor control.
Although in our study, not only did adding AEF color mapping to MDCT images improve the sensitivity for detecting both marginal and remote HCC recurrence, it also increased the number of false-positive lesions. The mean positive predictive value was slightly decreased in the second interpretation session with the combined data set, although the difference between the two interpretation sessions was not statistically significant. The main cause of false-positive lesions was misinterpretation of arterioportal shunts as HCCs. In fact, arterioportal shunts are more prevalent in cirrhosis than in the normal liver, and arterioportal shunts may be increased with TACE, which may cause some degree of hepatic arterial damage. In addition to an arterioportal shunt, the beam-hardening artifact around the partial uptake of retained iodized oil can mimic arterial hyperattenuation, and in some cases, it can cause an increased AEF value on AEF color mapping. However, we believe that the number of false-positive lesions can be reduced as there is greater awareness of these pitfalls and more experience interpreting AEF color mapping.
For the detection of recurrent HCC, contrast enhanced MRI (22) and diffusion weighted MRI (23) may also be used, and these modalities showed promising results. However, we are not exactly aware of how those MRI-related imaging techniques are useful for the detection of recurrent tumor or how those techniques are comparable to our imaging method. Further studies including both modalities are needed for these issues.
Our study had some limitations. First, as our study design was retrospective, some selection bias could not be avoided. Second, as our reference standard consisted of a combination of imaging findings and laboratory findings without histopathologic proof, this could potentially overestimate the actual sensitivity. However, we used very strict criteria based on several imaging studies performed during at least twelve months of follow-up after TACE. Furthermore, in many patients treated with TACE, as hepatic resection could not be performed, our study design was therefore closer to an actual clinical setting. Third, we excluded some patients with vascular invasion, as this can alter the hepatic perfusion nature of an HCC. Further study, including that of patients with vascular invasion, is warranted in order to optimally evaluate the value of AEF color mapping in this setting. Fourth, kappa value was 0.384 for combined multiphasic liver CT and AEF color mapping, and this was slightly lower than that of multiphasic liver CT alone. AEF color mapping is newly developed technique, thus, interpretation of AEF color mapping was possibly different between the reviewers, and this might result in decreased interobserver agreement. Therefore, we thought that more experience interpreting AEF color mapping should be needed for good interobserver agreement.
In conclusion, quantitative color mapping of the hepatic AEF may have the possibility of increasing the diagnostic performance of multiphasic liver CT for detecting recurrent or residual HCC after TACE. Quantitative color mapping of the AEF, created from routine multiphasic liver CT, can be used as a complementary modality for HCC detection to routine multiphasic liver CT, and also to monitor viable tumor after TACE.


 XML Download