

 PDF
PDF ePub
ePub Citation
 Print
Print


INTRODUCTION
Gliomas are the most common primary brain tumors. World Health Organization (WHO) classification of brain tumors is used as the primary basis to guide therapy and to assess overall prognosis in patients with brain tumors (1). Permeability parameters from dynamic contrast-enhanced (DCE) MRI and apparent diffusion coefficient (ADC) are quantitative physiologic metrics for tumor microenvironments and are used as independent imaging biomarkers for tumor grading, for gauging tumor treatment response, and for estimating tumor prognosis (2-7). DCE-MRI has strong advantages in quantifying permeability parameters regardless of the biologic situation, method of image acquisition, and contrast injection with improved spatial resolution (8, 9). The transfer constant (Ktrans) has shown efficacy in the grading of gliomas (10-12). Contrary to transfer constant (Ktrans), volume fraction of extravascular extracellular space (ve) has been underused in glioma grading (13, 14). Extravascular extracellular space (ve) has been considered as an index of tumor necrosis and an inverse index of tumor cellularity (15). ADC negatively correlates with tumor cellularity (16, 17). Therefore, theoretically, extravascular extracellular space (ve) and ADC may show correlation. Comprehensive understanding about extravascular extracellular space (ve) in correlation with other permeability parameters and ADC values need investigation. The purpose of this study was to evaluate extravascular extracellular space (ve) to grade gliomas, and to assess the correlation among permeability parameters (Ktrans, ve, and vp) and ADC values.
MATERIALS AND METHODS
Patients
The institutional review board waived patient consent for this retrospective study. Perfusion study in brain tumors are already widely used in clinical field and non-invasive additional pulse sequence does not need informed consent form. Thirty-three patients (50.79 ± 18.34 year-old) who had been diagnosed with an intraaxial tumor between April 2009 and March 2010 were included in this study; all patients had been examined by preoperative MR imaging including DCE-MRI and ADC mapping. Patients had no history of previous surgery for brain tumor. All the tumors were pathologically proven as gliomas after craniotomy and tumor resection. The interval between preoperative MR imaging and surgery was less than 10 days in 30 patients. Only 3 patients had the interval of 11 days and 14 days between MR imaging and surgery. The gliomas were classified by 2007 WHO criteria. Gliomas of WHO grade 1 and WHO grade 2 were grouped as low-grade gliomas and gliomas of WHO grade 3 and WHO grade 4 were grouped as high-grade gliomas for the purposes of analysis.
Image Acquisition
Preoperative images were taken using the 3.0-teslar system (Achieva, Philips, Best, the Netherlands) and 8-channel SENSE head coil. Anatomical MR imaging for preoperative evaluation and ADC map were acquired. Diffusion weighted images were measured using the following parameters: field of view (FOV), 220 mm; matrix, 112 × 112; slice thickness, 2 mm; and slice gap, 0 mm. ADC maps were generated from diffusion weighted images of b-value of 1000 s/mm2 and 0 s/mm2. Dynamic contrast-enhanced MR images were obtained in all of the patients and they were all applicable to the analysis. For DCE-MRI, precontrast 3 dimensional T1-weighted images were obtained with following parameters: FOV, 240 mm; matrix, 192 × 192; slice thickness, 3 mm; slice gap, 0 mm; and flip angle of 5°. After precontrast scan, 60-dynamic contrast-enhanced T1-weighted images were taken with the same MR parameters except for flip angle of 15° with an injection of Gadovist (0.1 mL/kg) at a rate of 2 mL/sec. Total scan time for DCE MRI was less than 7 minutes.
Data Analysis
Permeability parameters were calculated by off-line Pride tools provided by Philips Medical System, which is based on the pharmacokinetic model of Tofts (18). Post-processing was composed of motion correction of pixels from dynamic images, T1 mapping using different flip angles (5° and 15°), registration of pixels on T1 map, arterial input function estimation, and pharmacokinetic modeling. All processes were performed automatically by Pride tools, except for drawing the regions of interest (ROIs) for permeability parameters of the tumor and arterial input function. A neurologist (H.S.C.) with 5-years of experience drew the ROI, while blinded to the patients' pathology results. ROIs were drawn at the maximal enhancing solid portion of the tumor on contrast-enhanced T1 weighted images, where the highest grade of each tumor was suspected. If there was no visual enhancement of the tumor, ROI was drawn at the center of the solid portion where the T2-signal abnormality was noted after careful inspection of T1- and T2-weighted images. The ROIs of the tumor were duplicated on each permeability map (Ktrans, ve, and vp) automatically by Pride tools. The size of the ROIs of the tumors was 51.33 ± 31.73 pixels (mean ± standard deviation), 20 pixels in minimum, and 137 pixels in maximum. ROIs on ADC map were manually drawn at the corresponding area of ROIs on permeability map. There was no post-processing method for co-registration of algorithms for permeability map and ADC map. ROI for arterial input function was drawn at the M1 segment of the middle cerebral artery, ipsilateral to the tumor. Mean values of permeability parameters (Ktrans, ve, and vp) were calculated at the selected ROIs of gliomas. Mean values of ADC were measured at the corresponding ROI as that of permeability maps. Variables of low- and high-grade gliomas were not satisfactory with assumptions of t-test. Therefore, Mann-Whitney U test was used to compare permeability parameters (Ktrans, ve, and vp) and ADC values between low-grade gliomas (WHO grade 1 and 2) and high-grade gliomas (WHO grade 3 and 4). Presumptive variables from Mann-Whitney U test were chosen for ROC curve analysis to evaluate the diagnostic performance for differentiating high-grade gliomas from low-grade ones. Spearman correlation analyses were performed among the permeability parameters and ADC values. Statistical significance was set at a p-value < 0.05.
RESULTS
Thirty-three gliomas were confirmed by pathology: 15, glioblastomas; 6, anaplastic astrocytomas; 4, diffuse astrocytomas; 3, mixed oligoastrocytomas; 2, oligodendrogliomas; 2, anaplastic oligodendrogliomas; and 1, pilocytic astrocytoma. According to 2007 WHO classification, there was one, WHO grade 1; 9, WHO grade 2; 8, WHO grade 3; and 15, WHO grade 4 gliomas.
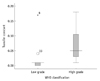
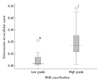
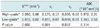
High-grade gliomas showed higher Ktrans (0.050 vs. 0.010 in median value, p = 0.001) and higher ve (0.170 vs. 0.015 in median value, p < 0.001) than low-grade gliomas (Figs. 1, 2, Table 1). There was no statistical difference in plasma volume fraction (vp) between high- and low-grade gliomas (Table 2).
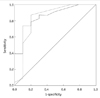
ROC curve analysis showed significant area under curve of transfer constant (Ktrans) and extravascular extracellular space (ve) for differentiating high-grade gliomas from low-grade ones (Fig. 3). The area under curve, lower bound, and upper bound of 95% confidence interval was 0.833, 0.648, and 1.017 for transfer constant (Ktrans); 0.857, 0.719, and 0.994 for extravascular extracellular space (ve). However, there was no statistical difference between diagnostic performance of Ktrans and ve.
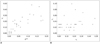
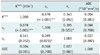
Spearman correlation analysis of permeability parameters and ADC value showed correlation between Ktrans and ve at the level of p < 0.01, and correlation between ve and vp at the level of p < 0.05 (Fig. 4, Table 2). However, ADC values did not correlate with any of the permeability parameters (Table 2).
DISCUSSION
This study evaluated permeability parameters and ADC values for differentiating high- and low-grade gliomas with emphasis on extravascular extracellular space (ve). Higher transfer constant (Ktrans) and higher extravascular extracellular space (ve) were observed by DCE-MRI in high-grade gliomas compared to low-grade gliomas. The finding of a correlation between higher Ktrans and high-grade gliomas was comparable with previous studies. However, to the best of our knowledge, there were few reports about correlation between extravascular extracellular space (ve) and glioma grade. This finding was observed in the recent literature (13, 14). The values of extravascular extracellular space (ve) were also similar to our results: mean ve, 0.20 for high grade glioma; and mean ve, 0.01 for low grade glioma (14). Increase in fractional interstitial volume in high-grade gliomas also supports potential use of extravascular extracellular space in differentiating brain tumors (19). A longitudinal MR imaging using in-vivo glioma in mouse model showed progression of tumor vascularization, increase in permeability and extravascular extracellular space (ve) along with tumor growth (20). A marked increase in the extravascular extracellular space (ve) in the later growth stage of high-grade gliomas has been observed in this study. It is consistent with high grade glioma demonstrating tumor necrosis during the latter growth stages in humans (21). A rapid increase in the volume of a high-grade glioma will lead to regional hypoxia and necrosis, consequently resulting in release of angiogenic cytokines such as vascular endothelial growth factor; this induces increases in angiogenesis and microvascular leakage. Metrics such as Ktrans, ve, and vp can be changed coincidentally and dynamically in the growth of a glioma tumor (18). Our results showed positive correlations among Ktrans, ve, vp, and with each other. This was comparable with a study about enhancing fractions in glioma showing correlation among each of the permeability parameters (22). Those permeability metrics are expected to be used not only in differentiating high- and low-grade gliomas but also in monitoring response to targeted therapy and correlating immunohistochemical tumor markers.
Generally, high signal intensity on diffusion weighted image and low ADC value represents high cellularity and low extravascular extracellular space (ve). Therefore, ADC value has been considered as an inverse index of tumor cellularity (16, 17). Extravascular extracellular space (ve) has been considered an index of tumor necrosis and an inverse index of tumor cellularity. Therefore, theoretically, extravascular extracellular space (ve) and ADC should show correlation. However, our results showed ADC did not correlate with any permeability parameters. Although there have been few reports on this topic, no correlation between extravascular extracellular space (ve) and ADC has been shown (15). Our study included not only high grade gliomas (n = 23), but also low grade gliomas (n = 10), which were different from the previous study. A possible explanation is that ADC value will be affected not only by extravascular extracellular space but also by various physiologic parameters, such as tumor cellularity, capillary bed perfusion, and permeability (16, 17, 23, 24). Further research about those metrics of permeability parameters and ADC seems to be necessary.
Our study has several limitations: a retrospective design, a small sample size, and heterogeneity of tumor pathology. There were many cases of oligodendrogliomas, oligoastrocytomas, and anaplastic oligodendrogliomas different from astrocytomas in nature. Also, the size of our study was too small to evaluate diagnostic performance of permeability parameters and ADC in differentiating high- and low-grade gliomas. Further large scale research seems necessary for understanding the nature of those metrics in relation to the grade of gliomas. Second, extravascular extracellular space (ve) measured by DCE-MRI can be affected by the scanning time of dynamic images. We used the same DCE-MRI protocols for all enrolled patients. However, different scanning time of DCE-MRI may be a potential confounder. Moreover, extravascular extracellular space (ve) cannot be estimated in tissue where capillary perfusion pressure is too low for contrast media to extravasate. Third, because of the given heterogeneity of high-grade gliomas, such as necrotic change, edema, hemorrhage, and microvascular proliferation, the ROI-based method used in this study has a potential weakness in evaluating gross characteristics of the gliomas. Voxel based analysis of whole tumor volume with coregistration technique between DCE-MRI and ADC should be considered in a future study. Finally, there was no post-processing method for coregistration of permeability maps and ADC map. Therefore, there is potential error in ROI measurement. To overcome this error, we measured mean values of permeability maps (Ktrans, ve, and vp) and ADC maps using ROI-based method instead of maximal or minimal values. Although correlation analyses of mean values from permeability maps and ADC maps may be less affected by misclassification than correlation analyses of maximal or minimal values, careful interpretation should be needed for this result.
Conclusion
Extravascular extracellular space (ve) was comparable with transfer constant (Ktrans) in differentiating high-grade gliomas from low-grade gliomas. ADC value did not show correlation with any of the permeability parameters from DCE-MRI. Further investigation of these metrics is needed at this stage.
 XML Download