

 PDF
PDF ePub
ePub Citation
 Print
Print


INTRODUCTION
Despite considerable obstetric and neonatal advances in the care of very low birth weight (VLBW, < 1500 g) infants, bronchopulmonary dysplasia (BPD) continues to occur in 25-30% of surviving infants (1). The "new" clinical definition for BPD (2) is based on the oxygen dependency at 36 weeks postmenstrual age (PMA) without considering radiologic findings.
Chest radiography has been used in daily clinical practice for BPD, and chest radiographic scoring systems have been developed to assess the clinical severity of BPD (3-5). However, chest radiography has a drawback of superimposition of structures and there is a controversy on the reliability of chest radiography for the diagnosis of BPD (6). The radiographic scoring system can not give enough information to properly reflect the abnormalities in the pulmonary parenchyma and to predict the clinical severity of BPD (7, 8).
Computed tomography scans can provide more objective and definitive evidence of pulmonary structural damage which can be used in outcome measures for future interventions and as reference images of the lungs in patients with BPD (9, 10). Two previous reports (9, 11) have described the correlation between the chest CT score and the clinical severity of infants with BPD. However, both proposed CT scoring systems (9, 11) accompany the following problems: observer's subjective assessment is included in the evaluation of the findings (11), quantitative evaluation of the extent of the lesion in the involved lung is not sufficiently taken into account in the scoring method (9, 11), and the CT scan parameters are not optimized for infants (9, 11).
We hypothesized that a more reproducible, objective high resolution computed tomography (HRCT) scoring system for BPD would provide useful information for both the evaluation of the disease status and the prediction of clinical severity. The purpose of this study was to develop a new HRCT scoring system for the assessment of BPD that can be utilized in the clinical and/or research settings and to determine its usefulness in comparison with the chest radiographic score.
Go to : 
MATERIALS AND METHODS
This prospective study was performed with the approval and under the guidelines of the institutional review board. Informed consent was obtained from the infants' parents. The parents were provided with information about the risks and benefits of the CT scan in the assessment of BPD. They were informed that the infants would be sedated and receive substantial doses of radiation compared with those from chest radiography (12). We also explained that HRCT could provide more objective evidence of pulmonary structural damage of BPD compared with chest radiography (8).
Patients
The schematic outline of BPD patients in this prospective study is shown in Figure 1.
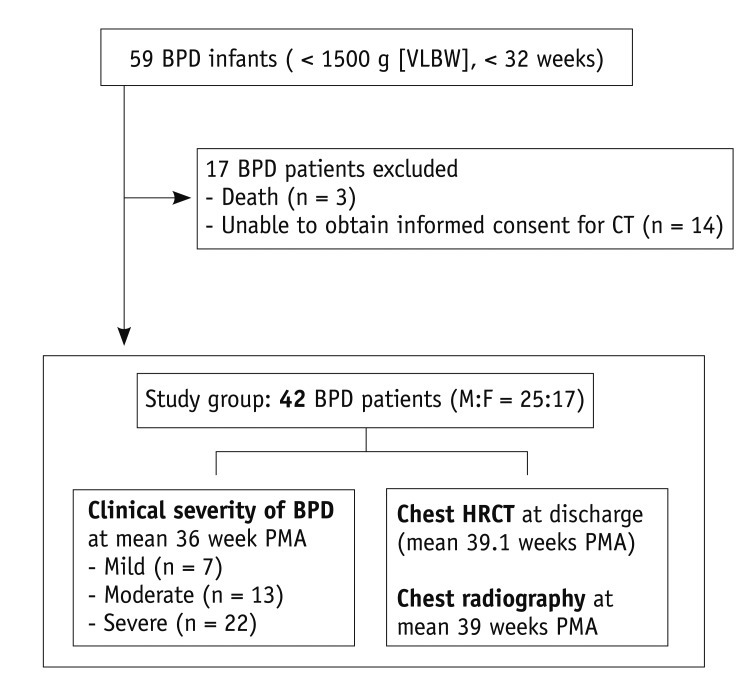
The inclusion criteria of this study were VLBW infants (birth weights of less than 1500 g) with a gestational age of less than 32 weeks, and those diagnosed with BPD at 36 weeks PMA or at discharge, whichever comes first. The exclusion criteria were severe congenital chest deformity or mass, congenital heart disease, past pulmonary surgery, or serious pulmonary infection. During the period between December 2006 and January 2008, we encountered 59 subjects that met our inclusion criteria. Three of the subjects could not be included because they died of sepsis, congestive heart failure, and pulmonary hypertension, respectively. Another fourteen could not be included because informed consent for HRCT could not be obtained from their parents. Finally, a total of 42 infants (25 males and 17 females) underwent HRCT examination and were subsequently enrolled in this study. The mean gestational age at birth was 26.3 weeks (range, 24.0-31.3 weeks), and the mean birth weight was 838 g (range, 490-1500 g).
Clinical Severity of BPD
All 42 infants in this study group were classified as mild, moderate or severe BPD according to the "new" clinical definition for BPD (2). All infants were treated with oxygen of > 21% for at least 28 days. Of these infants, seven were classified as mild BPD according to the criterion "breathing room air at 36 weeks PMA or discharge, whichever comes first". Thirteen infants had moderate BPD, defined as "the need for < 30% oxygen at 36 weeks PMA or discharge, whichever comes first", and 22 infants had severe BPD, defined as "the need for ≥ 30% oxygen and/or positive pressure (positive-pressure ventilation or nasal continuous positive airway pressure) at 36 weeks PMA or discharge, whichever comes first".
Clinical severity was evaluated by a pediatrician who was blinded to both the chest HRCT results and the radiographic scores at the mean PMA of 36 weeks (range, 35-36 weeks).
Chest HRCT Score
HRCT Imaging
Chest HRCT was performed at the mean age of 39.1 weeks PMA (range, 34.9-54.7 weeks PMA), when the patients were stable just before discharge, the period between March 2007 and March 2008. There was, on average, a 3.2 week (range, 0.1-18.7 weeks) gap between the assessment of the clinical severity of BPD at 36 weeks PMA and the actual occurrence of the HRCT scan, because HRCT examination was postponed until the condition of the patients had sufficiently improved for the examination. Removal of the endotracheal tube and stable vital signs were the prerequisites for CT examination. Of the 42 infants, 32 infants were administered with oral chloral hydrate before CT examination and 10 infants needed no sedation because they fell asleep after feeding (feed-and-wrap technique). To minimize dependent atelectasis of the posterior portions of the lungs, the patients were kept prone and frequently patted on the back for at least 1 hour and they had CT examination in the supine position.
Chest HRCT scans were obtained with a four-detector (MX8000; Marconi, Philips Medical Systems, Cleveland, OH, USA) CT scanner. The preset parameters for the MX8000 were 90 kVp (the lowest available X-ray tube voltage of the scanner), 60 mAs, axial nonvolumetric CT acquisition, 1.0 mm beam collimation, 1.0 mm slice thickness, 5.0 mm interval, 0.75 second acquisition time (the shortest time available for chest CT in the machine used), high-spatial frequency algorithm, and the smallest field of view ranging from 98 to 157 mm. The scanning time ranged from 8 to 13 seconds. During quiet respiration, the patients were scanned in the supine position from the apex of the lung to the dome of the diaphragm. CT findings were analyzed with lung window settings (window level, -300 HU; width, 1300 HU) using a picture archiving and communication system (Maroview; Marotech, Seoul, Korea).
The calculated mean effective radiation dose was 0.10 mSv ± 0.01 (range, 0.09-0.13 mSv) per examination with a weighted CT dose index (CTDIw) of 0.7 mGy. A typical dose curve (13) dependent on object size showed that in patients of 11 cm in diameter, the dose could be 2.3 times higher than the displayed CTDIw. The corrected CTDIw was 1.61 (0.7 × 2.3) mGy. The number (n) of slices was 14-20 and slice thickness (T) was 0.1 cm. The conversion factor (k, mSv·mGy-1 cm-1) was 0.039 for chest CT of newborns (14). The dose-length product (DLP, CTDIw × n × T) values were 2.67 ± 0.26 mGy·cm (range, 2.3-3.3 mGy·cm).
New HRCT Scoring System for BPD
Our new HRCT scoring system for BPD consisted of the scores of two categories of pulmonary abnormalities: hyperaeration and parenchymal lesions (Table 1). For quantitative evaluation of pulmonary abnormalities of BPD, we assessed the extent of these two lesions by counting the number of involved bronchopulmonary (BP) segments.
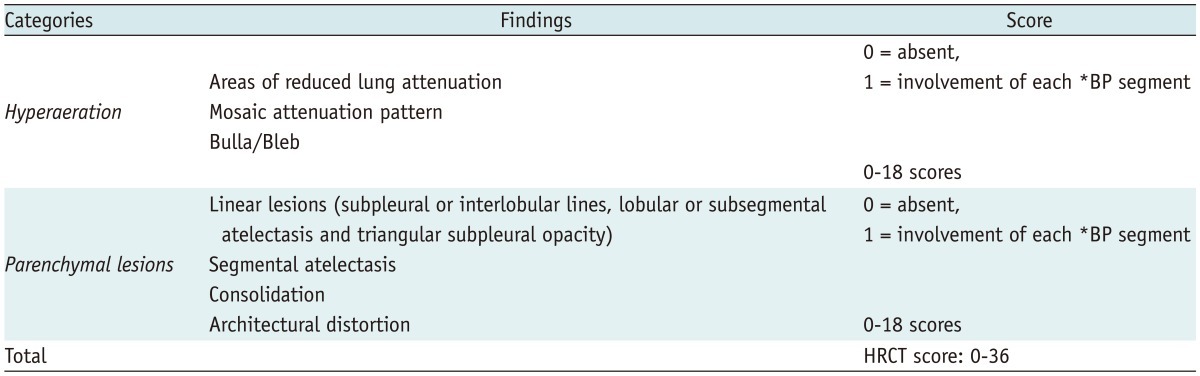
The hyperaeration score (range, 0-18) is the number of BP segments (15, 16) showing areas of reduced lung attenuation, mosaic attenuation pattern, or bulla/bleb (Table 1). A mosaic attenuation pattern was defined as a patchwork of regions of differing attenuation (17), including both hypoattenuated areas with small vessels (mosaic oligemia) and hypoattenuated areas with normal-caliber vessels (18). For further evaluation of the area of hyperaeration on CT scans, we compared its attenuation of the involved lung with that of the contralateral and/or adjacent lung. A bulla was defined as a rounded focal lucent area or an area of decreased attenuation, larger than 1 cm in diameter bounded by a thin wall (17). A bleb was defined as a small air-containing space within the visceral pleura or in the subpleural lung, not larger than 1 cm in diameter (17).
The parenchymal score (range, 0-18) is the number of BP segments showing linear lesions, segmental atelectasis, consolidation or architectural distortion (Table 1). We defined linear lesions as any elongated thin lines of soft tissue attenuation that include various pulmonary abnormalities of previous studies (9-11, 18), including subpleural or interlobular lines, lobular or subsegmental atelectasis and triangular subpleural opacity. Consolidation was defined as a homogeneous increase in pulmonary parenchymal attenuation that obscures the margins of vessels and airway walls (17). Architectural distortion was defined as an abnormal displacement of bronchi, vessels, fissures, or septa caused by diffuse or localized lung disease (17).
Even if several different lesions of the same category were detected within one segment, only one point was added to the score. We evaluated the presence of abnormalities in one segment regardless of their severity. Thus, the HRCT score of each patient (range, 0-36) was the sum of the hyperaeration score and the parenchymal score.
The examinations were independently interpreted and scored by two radiologists without any clinical information. To harmonize the scoring action between the two observers, both observers discussed the HRCT findings of four BPD patients who were not included in this study prior to scoring the study infants. To test intraobserver reproducibility, the scans were reviewed 5 months later by one observer who was blinded to the first results. A consecutive series of scans was continuously reviewed in a single day to fix the sensitivity in the detection of abnormalities.
Chest Radiographic Score
The Toce system (3), which was modified from the Edward radiographic score (19), was adopted as the radiographic scoring system for the radiographic severity of BPD. The Toce system comprises five categories: cardiovascular abnormalities, hyperexpansion, emphysema, fibrous/interstitial abnormalities, and a subjective factor. The subjective factor is the roentgenographic impression of the overall severity of the disease (3). The score ranged from 0 to 10, with a higher score indicating a more severe radiographic state. All radiographs were taken with the Sirius 130HP mobile X-ray unit (Hitachi Medical Systems, Singapore). The mean values of the parameters of this X-ray system were 49 kVp (range, 42-53 kVp) and 1.8 mAs (range, 1.4-2.5 mAs). Most examinations were carried out with the baby in the incubator and placed directly on top of the cassette with a focus-to-film distance of 100 cm. The estimated effective dose was 0.015 mSv (range, 0.01-0.031 mSv) (20).
A radiograph was obtained and scored at the time of discharge (mean age, 39 weeks PMA; range, 34.7-54.6 weeks PMA) to synchronize with the time of HRCT examination. Chest radiographs were independently evaluated by two radiologists who were blinded to both the clinical status and the HRCT score of corresponding patients. The radiographs were reviewed 5 months later by one observer who was blinded to the first results to check for intraobserver reproducibility.
Follow-Up Clinical Information and Follow-Up Imaging Study
At discharge, 19 patients (45%) were prescribed with home oxygen (supplemental oxygen at home). One year after discharge, telephone interviews were conducted with the parents of 32 patients. The remaining 10 patients could not be reached despite repeated attempts. We inquired the condition of patients at that time of telephone contact and whether they had been readmitted to the hospital for pulmonary problems. All patients survived except for one who died as a result of a neurologic problem. Ten patients (31%) of the survived patients were rehospitalized for pneumonia. One-year follow-up chest radiographs were available in 31 patients and were scored by the Toce system.
Statistical Analysis
Interobserver and intraobserver reproducibility of both the HRCT scores and the chest radiographic scores were statistically analyzed by the Pearson correlation coefficient.
We correlated the clinical severity with the HRCT score and the chest radiographic score respectively, using the Spearman rank correlation coefficient, and then compared the results using Hotelling's method (21). The correlation between the clinical severity and the score of each HRCT category (the hyperaeration score and the parenchymal score) was also evaluated using the Spearman rank correlation coefficient. Following this, the results were again compared using Hotelling's method (21).
We analyzed the statistical differences in the HRCT score and chest radiographic score between infants discharged with supplemental oxygen (n = 19) and those discharged without supplemental oxygen (n = 23) by the Mann-Whitney U test. The statistical differences in the HRCT score between infants with the history of rehospitalization for pneumonia (n = 10) and those without (n = 22) were also evaluated by the Mann-Whitney U test. We correlated the clinical severity, HRCT score and chest radiographic score with the one-year follow-up chest radiographic score using the Spearman rank correlation coefficient.
Statistical analyses were performed using SPSS 14.0 for Windows (SPSS, Chicago, IL, USA). A difference with a p value of less than 0.05 was considered statistically significant.
Go to :
RESULTS
Interobserver and Intraobserver Reproducibility
The HRCT scores had good interobserver (r = 0.969, p < 0.001) and intraobserver (r = 0.986, p < 0.001) reproducibility. Good interobserver and intraobserver reproducibility was shown in both the hyperaeration score (r = 0.923, p < 0.001 and r = 0.971, p < 0.001, respectively) and the parenchymal score (r = 0.950, p < 0.001 and r = 0.989, p < 0.001, respectively).
The chest radiographic scores showed good interobserver (r = 0.924, p < 0.001) and intraobserver (r = 0.922, p < 0.001) reproducibility.
Correlation between Radiologic Scores and Clinical Severity
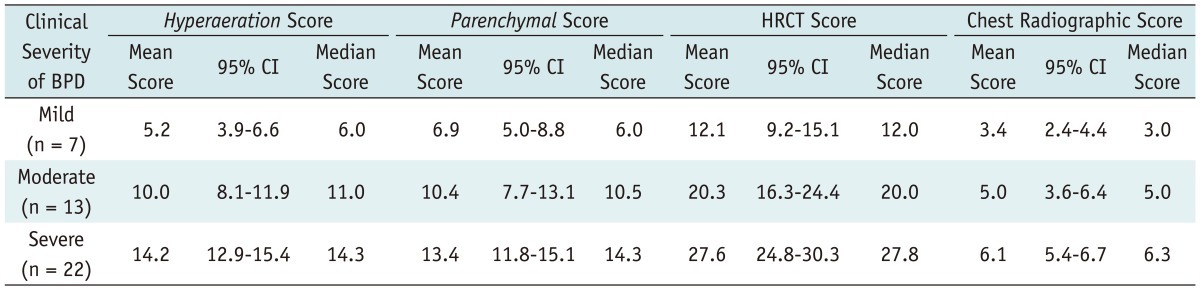
According to the clinical severity, the chest HRCT and radiographic scores, as determined by the two observers, are shown in Table 2 and Figures 2 and 3.
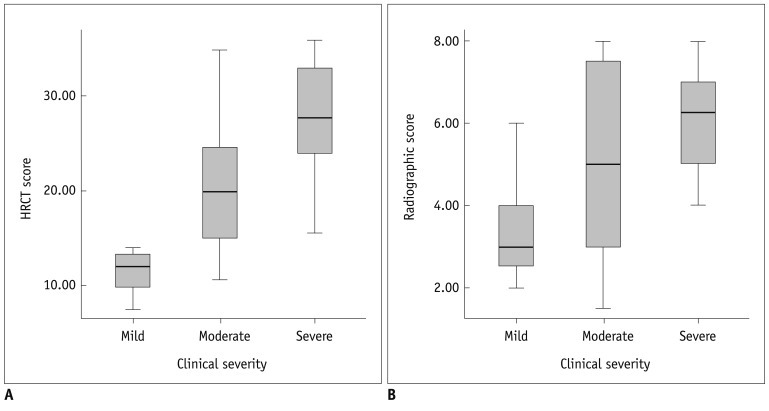 | Fig. 2Correlation between radiologic scores and clinical severity in bronchopulmonary dysplasia (BPD) patients.
HRCT score (A) shows significant correlation (r = 0.646, p < 0.001) with clinical severity of BPD. Chest radiographic score (B) also shows significant correlation (r = 0.410, p = 0.007) with clinical severity of BPD. HRCT score shows better correlation with clinical severity of BPD than chest radiographic score (p = 0.003). HRCT = high resolution computed tomography
|
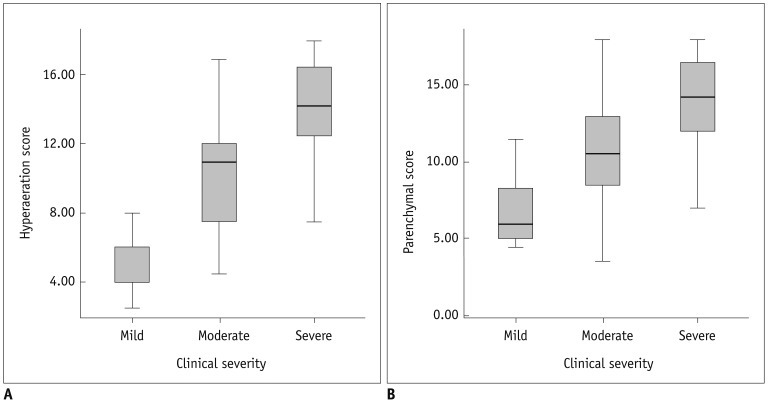 | Fig. 3Correlation between hyperaeration and parenchymal scores of HRCT and clinical severity.
Hyperaeration score (A) shows significant correlation (r = 0.738, p < 0.001) with clinical severity. Parenchymal score (B) shows significant correlation (r = 0.523, p < 0.001) with clinical severity. Hyperaeration score shows better correlation with clinical severity than parenchymal score (p < 0.001). HRCT = high resolution computed tomography
|
The mean HRCT score was 12.1 (95% CI, 9.2-15.1) in mild BPD (Fig. 4), 20.3 (95% CI, 16.3-24.4) in moderate BPD (Fig. 5), and 27.6 (95% CI, 24.8-30.3) in severe BPD (Fig. 6). The HRCT score showed a significant correlation (r = 0.646, p < 0.001) with the clinical severity of BPD (Fig. 2A). The mean chest radiographic score was 3.4 (95% CI, 2.4-4.4) in mild BPD (Fig. 4), 5.0 (95% CI, 3.6-6.4) in moderate BPD (Fig. 5), and 6.1 (95% CI, 5.4-6.7) in severe BPD (Fig. 6). The chest radiographic score showed a significant correlation (r = 0.410, p = 0.007) with the clinical severity of BPD (Fig. 2B). Overall, the HRCT score showed a better correlation with the clinical severity of BPD than the chest radiographic score (p = 0.003).
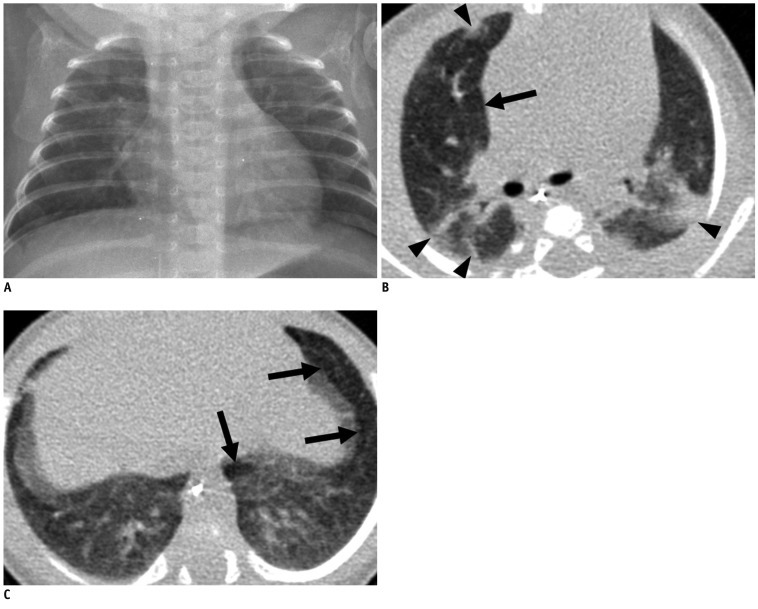 | Fig. 4Mild bronchopulmonary dysplasia in 41.1-week-old female infant born at 29.9 weeks of gestation with birth weight of 1280 g.
Chest radiograph (A) shows mild cardiomegaly and few streaks of abnormal density (radiographic score = 2). Transverse HRCT scan (B) at level of bronchus intermedius shows hyperaeration in anterior segment of right upper lobe (arrow) and parenchymal lesions in anterior and posterior segments of right upper lobe and apicoposterior segment of left upper lobe (arrowheads). Transverse HRCT scan (C) at level of liver dome shows hyperaeration in anteromedial basal segment of left lower lobe and in lingular inferior segment of left upper lobe (arrows). HRCT score was 12 with hyperaeration and parenchymal lesions in 6 segments, respectively. HRCT = high resolution computed tomography
|
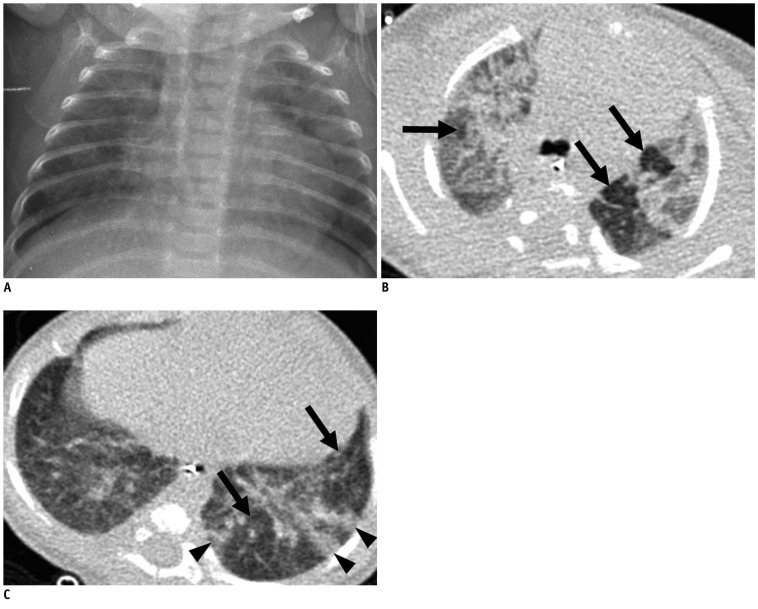 | Fig. 5Moderate bronchopulmonary dysplasia in 39.0-week-old male infant born at 29.9 weeks of gestation with birth weight of 620 g.
Chest radiograph (A) shows mild cardiomegaly, hyperexpansion (rib count: 15 1/2) and many abnormal strands (radiographic score = 5.5). Transverse HRCT scan (B) at level of carina shows hyperaeration (arrows) and parenchymal lesions in all segments of both upper lobes. Transverse HRCT scan (C) at level of liver dome shows hyperaeration in lateral and posterior basal segments of left lower lobe (arrows), and parenchymal lesions in lateral and posterior basal segment of left lower lobe (arrowheads). HRCT score was 24 with hyperaeration in 13 segments and parenchymal lesions in 11 segments, respectively. HRCT = high resolution computed tomography
|
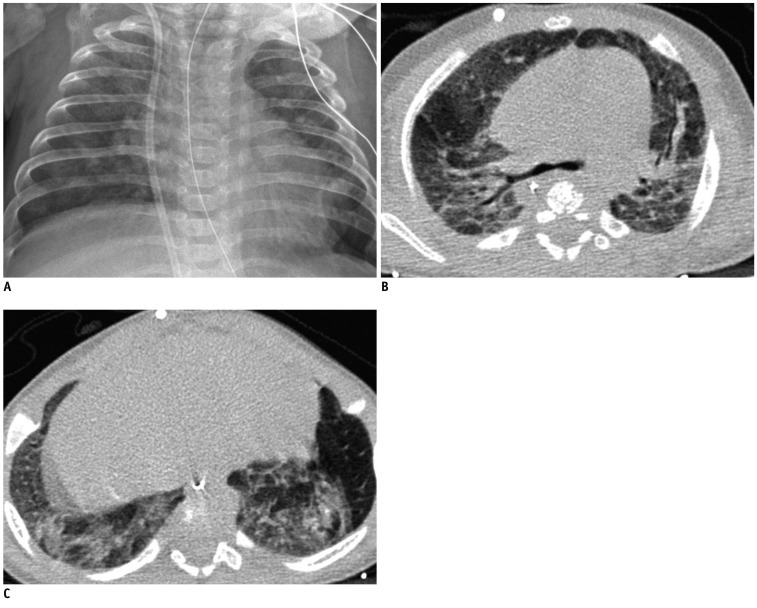 | Fig. 6Severe bronchopulmonary dysplasia in 54.7-week-old male infant born at 25.1 weeks of gestation with birth weight of 820 g.
Chest radiograph (A) shows mild cardiomegaly, hyperexpansion (rib count: 16), scattered small abnormal lucencies and many abnormal strands (radiographic score = 6). Transverse HRCT scans at level of carina (B) and liver dome (C) show hyperaeration and parenchymal lesions in all segments seen on scan. HRCT score was 36 with hyperaeration and parenchymal lesions in 18 segments, respectively. HRCT = high resolution computed tomography
|
The hyperaeration score showed a significant correlation (r = 0.738, p < 0.001) with the clinical severity of BPD (Fig. 3A). The parenchymal score also showed a significant correlation (r = 0.523, p < 0.001) with the clinical severity of BPD (Fig. 3B). The hyperaeration score showed a better correlation with the clinical severity of BPD than the parenchymal score (p < 0.001).
Relationship between Radiologic Scores and Clinical Severity at Follow-up
HRCT scores and chest radiographic scores were significantly higher (p = 0.0071 and p = 0.0155, respectively) in the infants discharged with supplemental oxygen (n = 19) (mean score, 26.8 ± 6.8 [range, 13.0-36.0], 6.2 ± 1.7 [range, 1.5-8.0]) than in those discharged without supplemental oxygen (n = 23) (mean score, 19.5 ± 8.7 [range, 7.5-36.0], 4.6 ± 2.1 [range, 1.5-8.0]).
HRCT scores were significantly higher (p = 0.02) in the infants who had been rehospitalized for pneumonia (n = 10) (mean score, 27.7 ± 5.4 [range, 20.0-36.0]) than who had not (n = 22) (mean score, 19.8 ± 8.3 [range, 7.5-35.5]).
The HRCT scores and chest radiographic scores were significantly correlated (p = 0.0001 and p < 0.0001, respectively) with the one-year follow-up chest radiographic scores, while such a correlation was not observed with the initial clinical severity of BPD (p = 0.375).
Go to :
DISCUSSION
In this study, we developed a new HRCT scoring system for infants with BPD, consisting of two categories of pulmonary abnormalities, hyperaeration and parenchymal lesions (Table 1). Areas of reduced lung attenuation, mosaic attenuation pattern and bulla/bleb, which have been described in previous studies on BPD (9-11, 18), were generically defined as hyperaeration in the present study. Because we thought hyperaeration was an important CT finding of BPD, we classified it as a separate category. Kubota et al. (9) reported that the ultrafast CT scores for hyperaeration were significantly correlated with the clinical score. We defined parenchymal lesions to encompass various pulmonary abnormalties that can be seen on CT scans: linear lesions (subpleural or interlobular lines, lobular or subsegmental atelectasis and triangular subpleural opacity), segmental atelectasis, consolidation, and architectural distortion. We simplified parenchymal lesions because the radiologic differentiation between the above-mentioned pulmonary abnormalities, which are variously described in previous studies (9-11, 18), was difficult in the interpretation of lung images of BPD patients in many instances and since their clinical significance has not been well understood.
We scored the extent of both hyperaeration and parenchymal lesions based on the number of involved bronchopulmonary (BP) segments. We thought that assessing the extent of pulmonary involvement would be more practical and reliable than differentiating and assessing the frequency of various lung findings, as described in previous CT scoring systems (9, 11). Kubota et al. (9) developed an ultrafast CT scoring system for assessing BPD by scoring the ratio of the number of lung fields having abnormalities to that of all the scanned fields. We believe that our scoring system based on the number of involved BP segments can better reflect the extent of BPD lesions in a quantitative manner compared to Kubota's scoring method. They also used CT parameters, such as 3 mm collimation, that are too thick for the evaluation of infant lungs. In a study of Ochiai and coworkers (11), their CT scoring system used observer's subjective assessment to determine the score of each category without considering the extent of the involved lung; for example, they assessed the mosaic pattern of lung attenuation, intercostal bulging, and consolidation as none (1 point), unclear (2 point), and obvious (3 point). We believe that our HRCT scoring system can better evaluate the lung involvement of BPD in an objective and reproducible fashion by assessing the presence of pulmonary abnormalities in each segment.
In our study, both the chest HRCT score and the radiographic score were significantly correlated with the clinical severity of BPD, but the HRCT score showed a better correlation with the clinical severity of BPD than the chest radiographic score (p = 0.003). Ochiai and coworkers (11) reported a significant correlation between the chest CT scores with the clinical scores at 36 weeks PMA. On the other hand, the chest radiographic scores at 36 weeks PMA did not correlate with the clinical scores in their study.
The hyperaeration score showed a better correlation with the clinical severity of BPD than the parenchymal score in this study. The pathophysiology of hyperaeration in infants with BPD is still unknown. However, the following hypotheses based on histopathologic examinations have been proposed: enlargement of the alveolar size due to partial airway obstruction (22, 23), "compensatory" alveolar enlargement because of impaired multiplication of alveoli during the acute period of the disease, and destruction of alveolar walls, i.e. emphysema in the strict sense (22). Under these circumstances, hyperaerated areas would probably function less satisfactorily than normal areas (10). The rest of the lung, which looks comparatively less aerated on CT scans, could correspond to healthy parenchyma compressed by the adjacent hyperaerated areas, as previously reported (10). In this study, we did not obtain additional expiratory images for the evaluation of air trapping by decubitus scanning (8, 24) due to the concern of additional radiation exposure to babies.
Although our study showed that the HRCT score is related to the incidence of home oxygen on discharge and that of rehospitalization for respiratory problems in BPD patients, a further study is needed to determine the correlation between our chest HRCT scoring system and prognosis.
In this study, we concentrated on obtaining good CT images of premature infants. Movement was controlled using restraints, sedation, and the shortest possible scan time available (8). Because sedation or falling asleep is associated with dependent atelectasis of the posterior portions of the lungs (25, 26) that obscures the underlying pulmonary changes of BPD, infants were laid prone and frequently patted on the back for at least 1 hour before CT examination.
Radiation exposure was particularly worrisome in dealing with infants because infants absorb radiation from CT in a more uniform fashion, resulting in a higher effective dose which leads to a higher risk of radiation-induced damage compared to adults (27-29). In order to achieve both radiation dose reduction and reasonably good CT images, the parameters of 90 kVp and 60 mAs were used. 90 kVp was the lowest available X-ray tube voltage provided by the CT scanner used in this study. The DLP values (mean, 2.67 mGy·cm ± 0.26) of this study were far below the UK national reference dose values of DLP, i.e. 200 mGy·cm for 0-1 year old infants (14). The HRCT dose of 0.10 mSv in our study was 17 times lower than that of 1.7 mSv used in the standard helical CT for newborns (12), 2.5 to 5 times higher than that of 0.02 to 0.04 mSv in a single infantogram for neonates (30, 31), and 3.2 to 10 times higher than that of 0.01 to 0.031 mSv in a single chest radiograph for neonates (20).
This study had several limitations. First, there was, on average, a 3.2 week (range, 0.1-18.7 weeks) gap between the assessment of the clinical severity of BPD at 36 weeks PMA and the actual performance of the HRCT scan, because we postponed HRCT examination until the condition of the patients had sufficiently improved for the examination. Therefore, the timing of CT examination was inevitably different among the patients. Second, in order to simplify the scoring system, the severity within each BP segment was not taken into account in the HRCT score. Third, we had no control group of normal neonates to specify the HRCT findings for BPD. Forth, there were no pathologic confirmation and correlation with regard to the HRCT findings which aslo were not mentioned in previous articles (9-11, 18) on the CT findings of BPD.
In conclusion, we developed a new HRCT scoring system for BPD based on the quantitative evaluation of pulmonary abnormalities of BPD consisting of the hyperaeration score and the parenchymal score. The HRCT score showed a better correlation with the clinical severity of BPD than the radiographic score. The hyperaeration score showed a better correlation with the clinical severity of BPD than the parenchymal score.
Go to :
 XML Download