

 PDF
PDF ePub
ePub Citation
 Print
Print


INTRODUCTION
The incidence rate of prostate cancer has risen sharply over the last two decades. The latest estimates indicate that prostate cancer has become the third most common cancer in men, globally, with half a million new cases each year (1-3). Prostate cancer is typically diagnosed via transrectal ultrasonography (TRUS)-guided prostate biopsy and conventional magnetic resonance imaging (MRI). Despite the advancements in these technologies, prostate cancer detection rates remain unsatisfactory (4-6).
Diffusion-weighted imaging (DWI), as a functional MRI technology, has potentially improved the detection of prostate cancer (7). Several studies have shown that DWI has a high sensitivity and specificity for the detection and location of prostate cancer (8, 9), and a recent research also proved that the apparent diffusion coefficient (ADC) values of tumors were significantly correlated with that of tumor necrosis and microvessel density in high-grade prostate cancer, suggesting that DWI might be further used for the noninvasive evaluation of microscopic structures of the tumors (10).
Typically, b-factors used for diffusion imaging of the abdominal and pelvic organs range between 0 and 1000 s/mm2. The associated ADC values are calculated, assuming that the signal decay with b-factor is a monoexponential decay function. However, previous studies of normal (11, 12) and pathological brain tissue, including tumors (13) and post-stroke tissue (14), have revealed that signal decay with b-factors over an extended b-factor range is better modeled using biexponential decay functions, offering include the fast and slow components of ADC value, or the fast and slow ADC values, as well as their apparent relative fractions. A recent study revealed that signal decays from the normal-appearing peripheral zone (PZ) and the central gland (CG) tissue from patients with prostate cancer were better described, using the bi-exponential model over an extended b-factor range, compared to that of the monoexponential functions (15). A separate study concluded that the bi-exponential model provided additional, unique tissue characterization parameters for both normal and cancerous prostate tissue, which may aid in the detection of prostate cancer (16).
Despite the potential impact of incorporating bi-exponential models, previous studies evaluating this technique in patients with prostate cancer have included a relatively small sample size. In addition, the results were partially contradictory in that the results differed based on the region of interest. Mulkern et al. (15) suggested that the slow ADC value in the CG region was significantly higher than in the PZ region. This contrasted the results from the study by Shinmoto et al. (16), which revealed that the slow ADC values in the PZ region was greater than in the CG region, although, these authors did not mention whether the difference between regions was significant.
Therefore, the aim of this study is to further characterize and compare the biexponential nature of the diffusion-related signal decay with multiple b-factors for different prostate tissue status. In particular, we planned to examine the biexponential apparent diffusion parameters of normal prostate tissue, prostate cancer, and the most common benign lesions, including prostatitis and benign prostatic hyperplasia (BPH), and we hypothesized that biexponential decay functions would better differentiate prostate cancer from benign lesions, compared to the monoexponential ADC.
MATERIALS AND METHODS
Study Population
Eleven healthy volunteers with no clinical symptoms or history of prostate disease (mean age 40 years, range 35-46 years) and 91 patients with elevated prostate-specific antigen (PSA) level were prospectively examined using DWI. These subjects were all recruited over a two year period, between February 2009 and February 2011. The protocol in this study was approved by our institutional review board, and informed consent was obtained from all patients before participating in any facet of this study. Within 3 weeks of the MR examination, 58 patients received an extended 10-core TRUS-guided biopsy procedure, and 3 patients with a previous negative biopsy from a previous evaluation received a 16-core biopsy.
Twenty-three patients (mean age 65.3 years, range 45-83 years; median total PSA 33.2, range 8-727 ng/mL) were confirmed to have prostate cancer (median Gleason score 7; range 6-9), while 20 patients (mean age 55.5 years, range 40-67 years; median total PSA 13, range 9-65 ng/mL) had prostatitis and 18 (mean age 65.2 years, range 45-70 years; median total PSA 11.3, range 4.1-22 ng/mL) had BPH. Fourteen of the cancer patients received a radical prostatectomy and 4 of the patients with BPH underwent a transurethral prostatic resection within a month of diagnosis. Nine patients with confirmed prostate cancer patients did not receive a radical prostatectomy because of the large volume of the tumor that extended beyond the prostate capsule. All patients with prostatitis and BPH were followed up with PSA tests for at least one year, and decreased PSA levels were observed in all the patients with prostatitis patients and 14 of the patients with BPH. The PSA levels of the remaining 4 patients with BPH were stable at follow-up (median total PSA 6.1, range 4-9.2 ng/mL).
Image Acquisition
All examinations were performed using a 3.0-T MRI system (Signa HDx; GE Healthcare, Milwaukee, WI, USA) with an 8-channel phased-array surface coil.
The entire prostate gland and seminal vesicles were imaged in axial, sagittal and coronal slices, using a T2-weighted Fast-Recovery Fast Spin Echo sequence (Repetition [TR]/Echo Time [TE] 5000 msec/87.9 msec, number of excitations [NEX] 4, slice thickness of 5 mm, space 1 mm). T1-weighted images were performed with a fast spoiled gradient-echo (FSPGR) sequence (TR/TE 150 msec/3 msec, slice thickness of 5 mm, space 1 mm), with a matrix of 512 × 512. The conventional DWI was performed using a single-shot echo-planar imaging (SS-EPI) with b values of 0 and 1000 s/mm2, TR/TE 4000/71.9 ms, field of view (FOV) of 260 × 260 mm, NEX of 2, a matrix of 512 × 512, 5 mm slice thickness, 1 mm space. A parallel imaging technique, array spatial sensitivity encoding technique (ASSET), was applied to reduce the magnetic susceptibility, with an ASSET number of 2. The extended b-factor DWI was performed by SS-EPI with b values of 0, 300, 600, 900, 1200, 1500, 1800, 2100, 2400, 2700, and 3000 s/mm2, TR/TE 4000/71.9 ms, FOV of 260 × 260 mm, NEX of 6 in a direction, a matrix of 512 × 512, 5 mm slice thickness, 1 mm space, and an ASSET number of 2. The acquisition time was about 6 minutes.
Histopathologic and MR Imaging Analysis
Magnetic resonance imaging-histopathologic correlation was performed by two radiologists, with 5 and 15 years of experience in prostate MRI plus additional urology experience. Analyses were performed by both investigators together on a workstation (AW4.3, GE Healthcare, Milwaukee, WI, USA) at our institution. The normal tissue and the locations, edges, and contour characteristics of the lesions on T2-weighted images were evaluated. Positive lesions were confirmed on the basis of biopsy results, and consultation with a pathologist with 10 years of experience in genitourinary pathology. Discrepancies in the image analysis and pathology results were resolved by discussion and consensus of the investigators.
In the 10-core biopsy, two sets of 3-core biopsies were taken from the mid-lobar parasagittal plane (base, mid-gland and apex) between the midline and the lateral edge of the prostate, and another four biopsies were obtained in the lateral peripheral zones at the base and mid-gland area, just medial to the lateral edge of the prostate on each side. In the 16-core biopsy, besides the 10-core above, 6 additional biopsies were taken from the more lateral peripheral zone of the base, mid-gland and apex regions. On the T2-weighted images, the prostate was divided into two parts, the PZ area and the CG (composed of the hypertrophied periurethral glandular tissue, transition zone and central zone) (17). For tumor localization, the prostate of each patient was further divided into 10 regions that corresponded to the sites of the 10-core prostate biopsy: right and left apex, right and left CG, right and left PZ in both the base and mid-gland regions.
Prostate cancer was defined as a lesion with focal or diffuse hypointensity on T2WI images at a site of biopsy-proven carcinoma, with corresponding lower value on ADC maps or hyperintensity on DWI images relative to the rest of the prostate gland. The criterion for prostatitis was an area with focal or diffuse low signal in the PZ. BPH was defined as a well or ill-defined lesion of the CG, with heterogeneously high signal intensity, or homo- / heterogeneously low signal intensity.
Twenty-three patients with prostate had a total of 230 core prostate biopsies, and 82 of these biopsies yielded prostate cancer, 87.8% (72/82) of biopsy-proven sites of prostate carcinoma were detected on T2WI and DWI or ADC map. Further, in other patients, 93% (68/73) biopsy-proven sites of prostatitis, and 94.9% (56/59) of the biopsy-proven sites of BPH were visible on T2WI. Thus, in total, 29 prostate cancer (24 in PZ and 5 in CG), 28 BPH, and 24 prostatitis lesions were included in this analysis. Normal PZ and CG tissue, from healthy volunteers (22 PZ and 22 CG tissue samples), as well as normal-appearing tissue in patients confirmed by the biopsy, were included in the analysis. Twenty-one PZ and 24 CG tissue samples from patients with cancer and 31 PZ and 23 CG tissue samples from patients with prostatitis or BPH were also included.
Data Processing
The measurement and calculations of the parameters for the tissue was also performed by the two radiologists. All regions of interest (ROI) were generated in prostate tissue and lesions on b = 0 DWI images with reference to the high-spatial-resolution T2-weighted images and the histopathological findings. The ROIs were then automatically placed in the same part of the prostate on the DWI images with different b value, ADC and biexponential parameters maps.
The signals on the DWI images with different b values and ADC values for the lesions were assessed three times within the same site, and then the values were averaged. The ROI circles of lesions were made in the area of the suspected lesions and the sizes of ROIs were chosen to be as large as possible and with minimal contamination from unintended tissues.
Regions of interests were also drawn into the images of the normal-looking tissue of the PZ and CG on the right and left sides from the volunteers and patients. The signals on the DWI images with different b values and ADC values were obtained at three different sites for these normal samples, and the values were then averaged. Each ROI had an area of 7 to 20 mm2. The signal to noise ratios (SNR) for the cancerous, BPH, prostatitis and normal tissues was calculated, according to Gilbert (18). For the 8-channel coil, the SNR was calculated by the following equation:
Mtissue was the signal of the tissue on DWI with different b value, and the STDair was the standard deviation of the noise of the air. Noise measurements were made from an ROI within the air, just left and dorsal to the prostate and outside the body, along the phase encoding direction.
The ADCf, ADCs, and f of these tissues were calculated for all slices voxel-by-voxel, with a custom-built software package according to the following equation:
Here, S is the signal intensity and S0 is the signal intensity on the b = 0 image; b is the b-factor; and ADCf and ADCs are the respective fast and slow components of the ADC value, while f and (1-f) are their fractions derived from the ADC value. Three maps for ADCf, ADCs and f were also constructed and simultaneously displayed to facilitate the ROI drawing and to allow for the observation of the variety of different tissue.
Statistical Analysis
All statistical analyses were performed using STATA software version 10.0 (StataCorp LP, College Station, TX, USA). Statistics for all continuous and ordinal data were reported as the mean ± SD. One-way analysis of variance (one-way analysis of variance) test was performed to check whether the means of monoexponential and biexponential parameters of all the tissue types are all equal or not, and the means of each parameter of different tissues were considered all equal at a p value ≥ 0.05. Once the p value was lower than 0.05, a Bonferroni comparison was further performed for the multiple comparisons of monoexponential and biexponential parameters differences between the tissue types. To avoid the type I error, a p value of 0.05/4 = 0.0125 or less was considered significant. For the purposes of this study, statistical significance was set to p < 0.01. The ability of biexponential parameters to discriminate cancer from benign lesions was compared to the ADC with area under the curve (AUC) of the receiver operating characteristic analysis. For this analysis, a p value less than 0.05 was considered significant.
RESULTS
The ADC value of conventional DWI was obtained from all volunteers and patients. The PZ tissue had a significantly higher ADC value than CG (p < 0.01) and the prostate cancer revealed a lower ADC value than all other tissues (p < 0.01). Compared with the normal PZ, the prostatitis lesions showed a lower ADC (p < 0.01). The ADC value of BPH lesions was significantly lower than that of CG (p < 0.01) (Table 1).
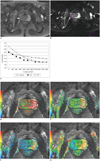
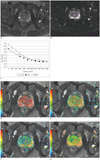
Detailed diffusion datasets, using multiple b-factors ranging up to 3000 s/mm2, were also acquired from all volunteers and patients. The mean SNR of the different tissues on DWI images decreased as the b value increased, and the SNR of all the tissues declined to a considerably low level when the b value was raised to 3000 s/mm2 (Table 2). Despite the low SNR on high b value, the values of the biexponential parameters were still successfully calculated for all tissues (Table 1). The characteristic signal decay and parameters were observed in the different tissues (Figs. 1, 2).
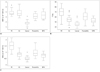
The PZ tissue exhibited a remarkably higher f and ADC than CG (p < 0.01); however, there was no significant difference between the ADCf of the two tissues (p > 0.01). The areas containing prostate cancer revealed lower ADCf and ADCs than other tissues (all p < 0.01), and a smaller fraction of ADCf (all p < 0.01). Compared with the normal PZ tissue, prostatitis tissue showed a lower ADCf, ADCs and smaller f. When compared to the CG tissue, BPH showed a significantly lower ADCf (p < 0.01); the ADCs and f were also lower, but did not reach statistical significance (both p > 0.01) (Table 1, Fig. 3).
When discriminating prostate cancer from BPH, the AUC of ADC was 0.92, yielding a sensitivity of 92.7% and specificity of 72.4% at a cutoff of 0.91 × 10⁻³ mm2/s. The AUC of ADCf reached 0.93, which was not significantly different than that of the ADC (p > 0.05), a cutoff of 2.32 × 10⁻³ mm2/s resulted in a sensitivity of 85.7% and specificity of 89.7%. However, both f and ADCs were significantly lower than ADC, in terms of AUC, sensitivity and specificity (p < 0.05). When making a distinction between prostate cancer and prostatitis, the AUC of ADC was 0.99, with a sensitivity of 100% and specificity of 96.6% at a cutoff of 1.13 × 10⁻³ mm2/s. The AUC of ADCf was 0.98, which was not significantly different than the ADC (p > 0.05). The sensitivity of ADCf was 91.7% and specificity was 89.7% at a cutoff of 2.45 × 10⁻³ mm2/s. Both f and ADCs were also significantly lower than ADC, in terms of AUC, sensitivity and specificity (p < 0.05) (Table 3).
DISCUSSION
The results of this study add to the knowledge of biexponential diffusion modeling in pathologic prostate tissues. Although the SNR of the tissues on DWI images were relatively low, when the b value was raised to 3000 s/mm2, the biexponential apparent diffusion parameters were successfully calculated for the prostate tissues, and revealed significantly discrepancy among the different tissues.
Diffusion-weighted imaging has been proposed as a useful tool to accurately and effectively diagnose prostate diseases (8, 9, 19), and now, most DWI exams are analyzed via a monoexpontial model with two b values. However, more detailed measurements of diffusion decay curves for prostate cancer and normal tissues revealed that monoexponential analyses were insufficient to characterize the diffusion decay curves of prostate tissues, when sampled over an extended b-factor range (15, 16). Our results supported the previous work, and we found that decay curves from normal prostate tissues and lesions sampled over an extended b-factor range were all well suited to biexponential fitting functions. These results underlie an important need to have appropriate parameters for tissue characterization updated, including the fast and slow components of ADC values, or ADCf and ADCs and their relative fractions.
Although there is still no definitive interpretation on the exact nature of biexponential diffusion signal decay, Le Bihan (20) suggested that the slow diffusion component may represent water associated with cell membranes and associated cytoskeleton structures, while the fast diffusion component represents the remaining, less restricted water in both the intra- and extracellular spaces. Based on the structure of the prostate (21), we hypothesize that the slow diffusion component mainly represents the water bound to connective tissue, cell membranes and cytoskeleton structures in the stroma, while the fast component represents the fluid in glandular tissue, as well as the free water in cells, vessels, and extravascular or extracellular space of the stroma.
This hypothesis would support our findings that high ADCf, f, and ADCs would be present in the in normal prostate tissue because of the loose structure of the foci and stroma. The PZ and CG exhibited similar ADCf, but different ADCs and f for the two tissues have similar acini structures, but the CG has more compact stroma tissue (21). Moreover, the ADCf, f, and ADCs were all significantly lower in the tumor tissue, compared to the other tissues. This is attributed to the fact that prostate cancer consists of densely packed malignant cells and small back-to-back glands, resulting in a significant decrease in the space available through which water could diffuse. The high cellularity and smaller cell volume in the cancerous tissue may also cause more binding of water to cell membranes.
The benign lesions also displayed particular characteristics parameters. Prostatitis lesions exhibited lower ADCs and ADCf, and a smaller f compared to the healthy PZ. This finding may be explained by the infiltration of inflammatory cells and tissue reconstruction in prostatitis tissue (22), which could reduce the fraction of free water and limit the water diffusion.
The BPH revealed a significantly lower ADCf in BPH compared to CG. Although the f and ADCs were also lower, the differences in these parameters did not reach statistically significant levels. The CG tissue in patients with BPH may contain more stroma tissue and concomitantly less glandular components than healthy CG tissue (23). Additionally, both the prostatitis and BPH tissues had higher ADCs, ADCf and f than cancer tissues, which indicate that these parameters can serve as a useful tool to distinguish cancer from other pathologies of the prostate, including prostatitis and BPH.
Although the biexponential parameter provided more information about the different prostate tissues and the ADCf was comparable to ADC in differentiating cancerous from benign lesions, we failed to find a similar accuracy in the ADCs and f. This may be attributed to the fact that differences of water diffusion between cancerous and benign lesions remain in the fast component rather than the slow component. This is supported by Tamura et al. (24), who suggested that the fast component has longer T2 value and higher signal intensity than the slow component. Even if the components are of equal amounts, the contribution of the slow component to the signal intensity tends to underestimate the actual slow component. It is reasonable to infer that the slow component in our study could be affected by such bias, leading in a relatively lower accuracy of f and ADCs for the diagnosis of prostate disease.
Our study is partly consistent with the findings of Shinmoto et al. (16) in that 1) the fast and slow ADC values were lower in the tumor than in the normal tissue, and 2) the fraction of the fast diffusion component was lower in cancerous tissue than the PZ. However, these authors did not find any significant difference in f between the cancerous tissue and the normal CG. In a study by Mulkern et al. (15), no differences in the ADCf and ADCs were found between the CG and PZ. Additionally, these authors found that the f values were higher in the CG than PZ, which contradicts our findings. These differences may be explained by two reasons. First, both previous studies employed an Line-Scan diffusion imaging (LSDI) sequence and in a 1.5T MRI, which was different than our methodology. Since ADC values could be affected by magnetic strength, sequence and other factors, the discrepancy of the biexponential parameter may partially be explained by these methodological differences. Secondly, the previous studies included relatively small sample sizes, which may limit the generalizability of the previous findings.
Riches et al. (25) examined biexponential apparent diffusion coefficients in prostate tissue, but used much lower b-values (0, 1, 2, 4, 10, 20, 50, 100, 200, 400, 800 s/mm2). These authors had results that were exceptionally different from the Shinmoto et al. and Mulkern et al., as well as ours (15, 16). These differences were apparent in both prostate and other tissues, with the differences in the fraction of the two components being the most disparate. This study also failed to distinguish cancerous from normal prostate tissues, based on the diffusion coefficients. These differences may be partly explained by the low b values and the way in which the b values were arranged, suggesting that higher b values are essential for future research investigating the benefits of biexponential diffusion modeling of the prostate tissue.
Some limitations exist in the current study. First, although our sample was larger than the previous studies, it still is too small to perform a comprehensive sensitivity and specificity analysis for the accurate diagnosis of prostate cancer using biexponential diffusion parameters. Larger patient populations with a broader range of tumor grades are needed before a definitive conclusion can be made pertaining to the clinical benefits of this method. Second, because the bulky prostate cancer lesions on T2-weighted images have been examined in this study, it is impossible to fully exclude the possibility that benign prostate tissues partially contributed to the ROI selected within the tumors. Third, since some of the pathologic results in our study were based on only TRUS-guided biopsies, it should be noted that TRUS-guided biopsies can have some false negative results. We could neither differentiate glandular and stromal BPH by pathological results since the percentage of the stomal could not be accurately assessed on the basis of biopsy. Thus, our results need to be confirmed by additional analyses, including radical prostatectomy and whole-mount step-section examination.
In conclusion, biexponential analysis of high b-diffusion data reveals characteristic ADCf, f and ADCs in the normal and pathological tissue, including prostatitis, BPH, and cancerous tissues. All of the parameters in prostate cancer were significantly lower than in noncancerous prostate tissue, and the ADCf provided comparable accuracy with ADC in differentiating prostate cancer from that of benign lesions. Therefore, the biexponential parameters may offer new and unique information pertaining to the tissue characterization and aid in differentiating prostate cancer from benign prostate tissues.


 XML Download