

 PDF
PDF ePub
ePub Citation
 Print
Print


INTRODUCTION
Contrast enhanced coronary CT-angiography (CTA) is a well-established method for the detection of coronary artery disease (1-4). The clinical value of myocardial CT perfusion (CTP) alone (5) or in combination with CTA are the subject of current research (6-8). Due to its excellent safety profile, adenosine is a favored substance for stress induction in cardiac imaging (9, 10). With the presence of flow limiting coronary artery stenoses the additional assessment of CTP bears the potential to comprehensively evaluate coronary artery disease (11). Next to the visual assessment of the reader, CTP analysis software should exhibit good agreement in the repeatability of results regarding segmental myocardial attenuation in order to rule out or to localise perfusion defects and to enhance diagnostic accuracy. An automated detection of the myocardium with precise delineation of epi- and endocardial contours therefore would be advantageous for CTP analysis. However, the reading time of combined CTA and CTP datasets might be potentially prolonged. While CTA offers detection of intracoronary transluminal attenuation gradients to further characterize stenosis severity (12), the currently available software solutions focus mainly on automated vessel detection and anatomic stenoses quantification (13, 14). Similarly, CTP is either only evaluated visually (15) or manually and semi-quantitatively (16), hence software solutions with automated and precise detection of myocardial contours are needed to slow down attenuation quantification.
The aim of this study was to compare two CTP analysis software releases with automated epi- and endocardial contour detection. The time efficiency and the agreement of resulting perfusion parameters should quantitatively be compared and precision in myocardial contour detection should be subjectively rated. Furthermore, diagnostic accuracy should be evaluated against conventional coronary angiography as the reference standard.
Go to : 
MATERIALS AND METHODS
Design and Patients
We prospectively performed rest and stress CTP in patients with known coronary artery disease who exhibited a clinical indication for conventional coronary angiography as part of an approved, single-center prospective clinical study. CTP was done using 320-row CT in 30 patients (4 female, 26 male) and analysis of images during both rest and stress was performed randomly in all patients with two recent software releases for myocardial perfusion analysis (version 4.6 and novel version 4.71GR001, Toshiba, Tokyo, Japan). Written informed consent was given by each patient and the ethics board approved the study. The patients' average age was 64.2 ± 11.0 years, the average height was 175.3 ± 6.5 cm, the average body weight was 82.3 ± 11.9 kg and the average body mass index (BMI) was 26.7 ± 2.8. All patients had previously described coronary artery disease with at least one coronary stent (mean 2.6 ± 2.2 stents). The clinical presentation of the patients were atypical angina pectoris (n = 13), typical angina pectoris (n = 7), chest pain (n = 4) and six patients were without symptoms but had positive stress tests that led to the clinical indication for coronary angiography. Exclusion criteria included renal insufficiency (creatinine serum level > 2.0 mg/dL), cardiac bypasses, cardiac arrhythmias or contraindications for adenosine application.
Rest and Stress Perfusion Imaging
Imaging was performed on a 320-row CT (Aquilion ONE, Toshiba, Tokyo, Japan) and tube currents were adapted depending on the patients' BMI as shown in Table 1. In both rest and stress imaging a fixed number of R-R intervals (segments) was used for image acquisition depending on the patients' heart rate: 1 segment for up to 65 beats per minute (bpm), 2 segments between 66 bpm and 79 bpm, 3 segments between 80 bpm and 117 bpm, 4 segments between 118 bpm and 155 bpm, and 5 segments at 155 bpm or above. Rest imaging was performed using prospective CTA from 70-80% for 1 segment, prospective CTA from 40-80% for 2 segments and cardiac function analyses mode for 3 or more segments, according to current guidelines (17). Stress imaging was performed using prospective acquisition with "target CTA" at 85% of the R-R interval with one segment for ≤ 65 beats/min, two segments for 66-79 beats/min, and three segments for ≥ 80 beats/min.
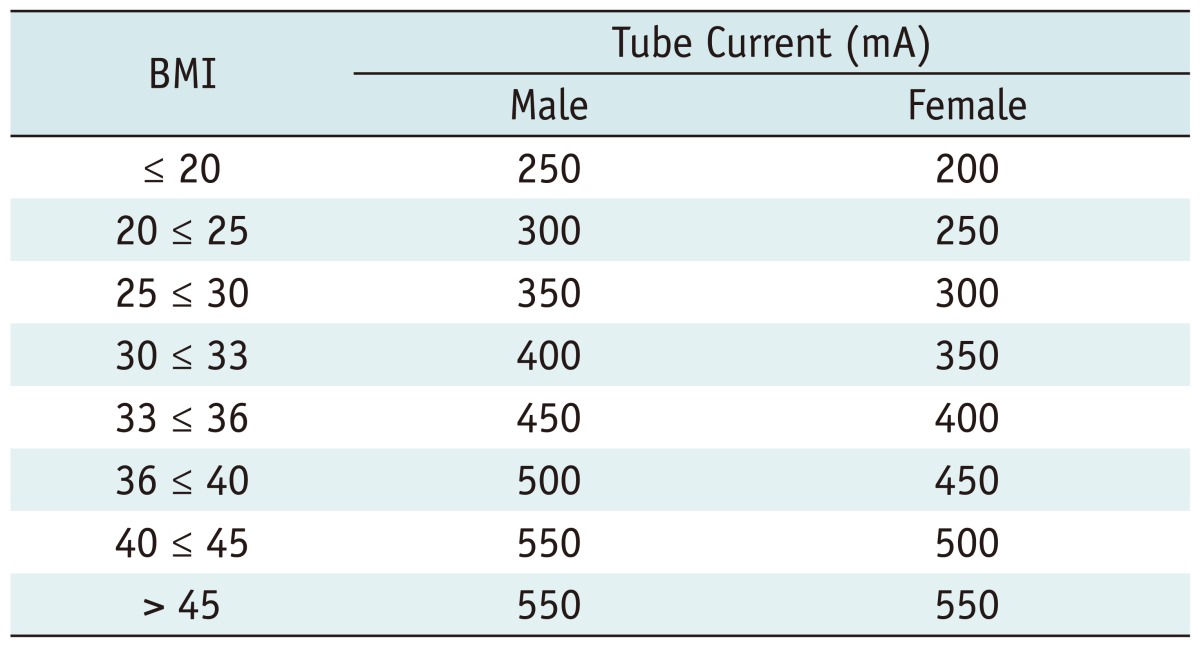
In the patient cohort of the present report, a tube voltage of 120 kV and tube currents from 250 mA to 400 mA were used. An iodinated contrast agent (iomeprol-400, Iomeron, Bracco Imaging SpA, Milan, Italy) was administered for rest and stress imaging through an intravenous line in the antecubital fossa of the right arm according to body weight as follows: 50 mL with 4 mL/s for < 60 kg, 60 mL with 5 mL/s for 60 kg - 80 kg, and 70 mL with 5 mL/s for > 80 kg; plus a saline flush of 40 mL with the same flow. An automated breathhold command ("breathe in and hold your breath", 4-second breathhold) was given for rest and stress imaging when an absolute increase of 200 Hounsfield units (HU) in the descending aorta after contrast agent injection had been detected with the automatic sure-start option of the CT. Patients who received long term medication with calcium channel blockers were asked to discontinue the intake of medication 48 hours prior to CT imaging. Patients with chronic use of beta-blockers were allowed to participate in the study and each patient received an oral beta-blocker (atenolol) one hour before the CT if the heart rate was 60 bpm or more and if no contraindications for beta-blockers were present. If the BMI was below 30 an atenolol dose of 75 mg was administered and if the BMI was 30 or above, 150 mg was administered. Two minutes before rest imaging sublingual nitroglycerine (Nitrolingual forte, Pohl-Boskamp, Hohenlocksted, Germany) was given at a dose of 0.8 mg. With a delay of at least 20 minutes after nitroglycerine application, adenosine was administered (140 µg/kg/min) through an intravenous line in the antecubital fossa of the left arm. Stress imaging was performed using an iodinated contrast agent as described above 4:30 min after initiation of the continuous adenosine infusion. After the examination all images were reconstructed on a field-of-view of 180 mm with 0.5-mm slice thickness in automated "BestPhase" (PhaseXact, Toshiba, Tokyo, Japan), a software tool that automatically selects the series with the least motion artefacts of the coronary arteries (18). Further reconstructions in 5% intervals were performed from the R-R interval available, and additional intervals were reconstructed if necessary.
Image Analysis and Reading
Volume data sets of rest and stress perfusion imaging were uploaded on a commercially available workstation with myocardial perfusion software version 4.6 and on a research workstation with version 4.71GR001 W.I.P. (Toshiba, Tokyo, Japan) for automated CTP analysis. Version 4.6 uses a simple segmentation based on the k-means method and smoothing of the surface of the segmentation results excluding the papillary muscles to identify the endocardial boundaries. In contrast, the novel version 4.71 is based on active shape models (19) and the introduction of a machine learning approach to estimate the left ventricular coordinate system. A pattern model based on the averaged intensity values of training datasets is used to optimize the myocardial shape in the left ventricular coordinate system in which the position, rotation, and scale of the ventricle is normalized. Therefore, version 4.71GR001 should expose an improved accuracy in myocardial contour detection. To compare the datasets of rest and stress imaging in the former software version manual angulation of the cardiac axes was performed in the axial, coronal and sagittal planes, including in plane rotation, if necessary. These steps are fully automated in the novel software version. For both rest and stress CTP evaluation times necessary for angulation of the cardiac axes, automated epi- and endocardial contour detection with the following manual correction, and short axis documentation were recorded manually by each reader. The resulting short-axis view was documented by screenshots in steps of 3 mm and a slice thickness of 8 mm with a "black and white" preset (window level [wl] of 100 and a window width [ww] of 200; as proposed by Rogers et al. [20]) and "rainbow-red" preset (wl 200/ww 350). Using the black and white short-axis view, the subjective evaluation of automated epi- and endocardial contour detection was performed based on necessity for manual corrections. Rating was excellent if 0 to 4 corrections had to be performed, good (5 to 9), fair (10-14), poor (15-19), and very poor (20 or more). A 5-point scale was used from 1 (very poor) to 5 (excellent) for measuring image quality. The transmural perfusion ratio (TPR) and myocardial attenuation (measured as HU) were previously described by Valdiviezo et al. (21) as semi-quantitative CTP analysis parameters and they were recorded based on the 17-segment myocardial standard model of the American Heart Association (22). Criteria for an accurate myocardial contour detection were congruent delineation of epi- and endocardial borders with the exclusion of trabecular structures and papillary muscles.
Three readers with different levels of experience in cardiac imaging performed the analysis for all thirty patients using both software versions in random order. Because the two software versions are installed on two different workstations, a blinding towards the software version was not possible. However, the reading was performed in random order of cases in order to avoid bias and carry over effects. Reader 1 (AK) had one year cardiac CT experience (with approximately 40 CTP cases) and started with the first 15 patients on the former software version and continued with the consecutive 15 patients on the novel version, and the remaining 15 patients were evaluated consecutively on the novel and former version, respectively. Reader 2 (FS) had two years experience (approximately 80 CTP cases) and performed all analyses first on the former version followed by the novel version. Reader 3 (MR) had four years of experience (approximately 150 CTP cases) and performed all analyses first on the novel version and afterwards on the former version.
The analysis included 17 myocardial segments per patient in both software version 4.6 and version 4.71GR001 W.I.P. (Toshiba, Tokyo, Japan), evaluated by three readers. Taken together, both myocardial attenuation and TPR of rest and stress CTP in 30 patients resulted in a total of 4080 segment data for each reader and 12240 data points overall.
Conventional Coronary Angiography
All patients underwent clinically indicated conventional coronary angiography. A coronary artery diameter stenosis of 50% or more as detected by quantitative coronary analysis (QCA) served as the reference standard.
Statistical Analysis
Statistical analysis was carried out using Statistical Package for the Social Sciences Statistics 20.0 (SPSS Inc., Chicago, IL, USA). Numerical values are expressed as means and standard deviations unless otherwise stated. For evaluation of differences in reading time the Friedman test and Wilcoxon test were used for repeated measures analysis of variance by ranks. Subjective evaluation of myocardial contour detection was evaluated using the Wilcoxon test. The intraclass correlation coefficient (ICC) (23) was assessed as a two-way, random, and single-measure for myocardial attenuation and TPR measurements. Agreement was considered strong if ICC was ≥ 0.75. Diagnostic accuracy was compared using the Cochran-Mantel-Haenszel test. P values < 0.05 were considered statistically significant.
Go to :
RESULTS
Reading Time
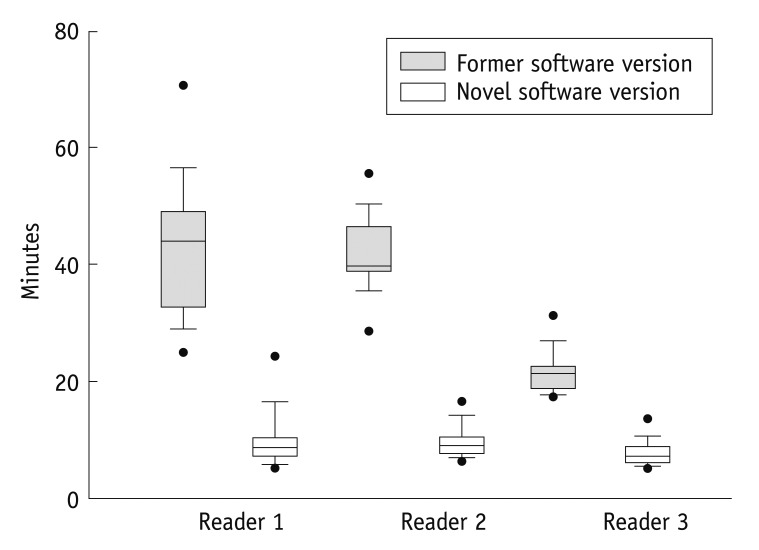
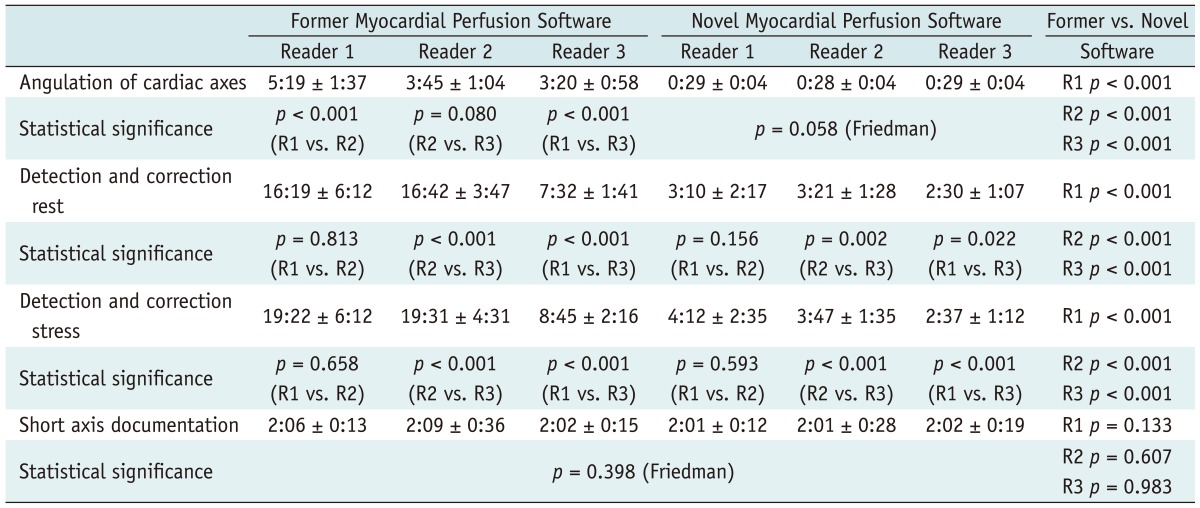
For all three readers the overall reading time was significantly reduced by the novel automated software when compared to the former version: Reader 1: 43:08 ± 11:39 min vs. 09:47 ± 04:51 min, Reader 2: 42:07 ± 06:44 min vs. 09:42 ± 02:50 min and Reader 3: 21:38 ± 3:44 min vs. 07:34 ± 02:12 min; p < 0.001 for all (Fig. 1). The overall reading times between Reader 1 and 2 were not significantly different within the former software version (p = 0.781) or within the novel software version (p = 0.727), however the more experienced Reader 3 had a significantly decreased overall reading time when compared to Reader 1 or 2, within the novel software version and within the former software version (p < 0.001 for each). The angulation of axes, and automated contour detection for rest and stress imaging, including manual corrections, was significantly shorter with the novel automated software (p < 0.001 for each of the three readers; Table 2). The short-axis documentation was performed manually in both versions and the times needed for documentation were fundamentally unchanged in all readers (p = 0.398, Friedman test). Furthermore, angulation of cardiac axes was performed automatically in the novel software version, and no significant differences between the three readers (p = 0.058, Friedman test) was observed. In contrast, the Reader 1 with least experience needed significantly more time for the manual angulation of the cardiac axes in the former software version (p < 0.001, Table 2). Further, Reader 3 was significantly faster compared to the other readers in detection and correction of rest and stress datasets in both software versions.
 | Fig. 1
Overall reading time. For novel software, overall reading time was significantly reduced (white boxplots) compared to former version (grey boxplots, p = <0.001 for all readers). Median (horizontal bar within boxplot) analysis time of Reader 1 and Reader 2 was equivalent, however Reader 3 with more experience had significantly less reading time in both novel and former software version compared to Readers 1 and 2. Black dots represent 5th/95th percentile.
|
Contour Detection
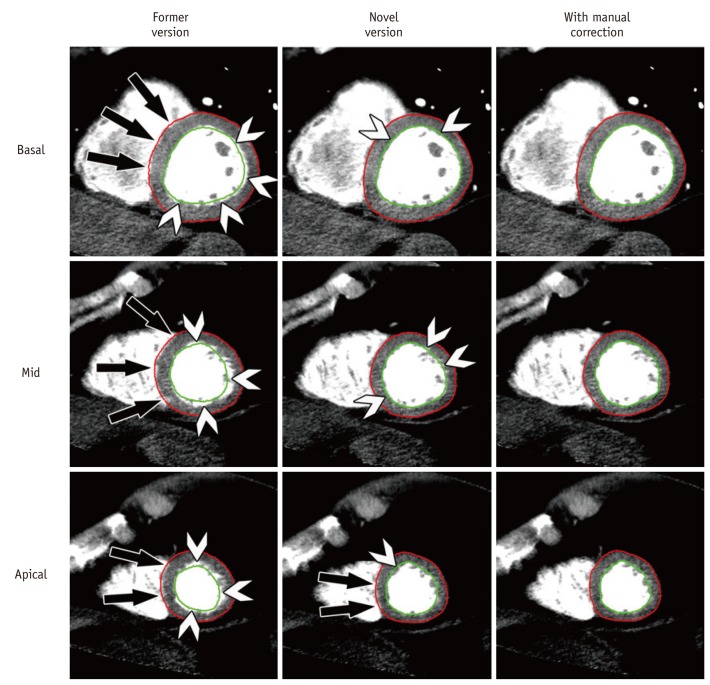
For detection of epi- and endocardial contours for both software versions a short axis example with three slices is given in Figure 2. Here, the former version shows the necessity for extensive corrections of epi- and endocardial contours, which finally resulted in longer correction times (Table 2), however this was not the case for the novel automated software. Epi- and endocardial contour detection of the former version demonstrated the following ratings, excellent (n = 0), good (n = 2), fair (n = 4), poor (n = 20) and very poor (n = 4). For the novel version, results significantly improved (p < 0.001) to excellent (n = 6), good (n = 18), fair (n = 4), poor (n = 2), and very poor (n = 0).
 | Fig. 2
Myocardial contour detection. Effects of improved automated contour detection by novel software version are shown in column 2 where precise epicardial (red) and endocardial (green) delineation is present. Only few endocardial regions need manual correction (arrowheads) and especially epicardium had to be manually corrected only in septal area of apical third of heart (bottom row, image in middle with arrows). In contrast, detection was poor (column 1) in former software version and required extensive, almost circumferential contour corrections (arrows and arrowheads) in total of 18 slices. Results after manual correction are represented in column 3 showing congruent delineation of epi- and endocardial borders with exclusion of papillary muscles and trabecular structures. All images (wl 100/ww 200) are taken from rest CTP, slice thickness is 8 mm.
|
Agreement of Myocardial Perfusion Parameters
On a per patient level, the agreement for myocardial attenuation was strong (ICC ≥ 0.75) in 93% and for TPR in 82%. On a patient level TPR was negative in 10% of patients in stress and 18.9% of patients in rest imaging. Patients found with positive TPR in one to five segments accounted for 78.9% in stress imaging and 75.6% in rest imaging. Six or more positive segments were found in 11.1% of patients in stress imaging and in 5.6% in rest imaging.
Diagnostic Accuracy
The prevalence of significant coronary artery stenoses was 80% on the patient level, as detected by QCA. Adenosine dependent TPR measures of the former version resulted in a sensitivity of 96% and a sensitivity of 92% was achieved with the novel software version. The positive predictive values were 81% vs. 85%, respectively. These results have to be judged in the context of the rather higher prevalence of disease in this cohort. In addition, when comparing diagnostic accuracy between the two software versions, no significant difference was found (p = 0.169).
Radiation Exposure
Using a conversion factor of 0.017, the effective doses estimated based on the dose-length products for the rest and stress CT were 3.2 ± 1.3 mSv and 5.6 ± 1.9 mSv, respectively.
Go to :
DISCUSSION
This evaluation of CTP analysis software first demonstrates that automated software facilitates myocardial contour detection for readers with different levels of experience. Second, quantitative results of myocardial attenuation and transmural perfusion ratios from readers with different experience levels show good agreement. Automated CTP analysis software leads to improved time efficiency with an average reduction of overall analysis time by a factor of approximately 4. One explanation is the fully automated angulation of cardiac axes with the novel version, which already decreased analysis time in the first step. The major factor, however, appears to be the improved and more precise myocardial contour detection in the novel software version, which revealed less necessity for manual corrections both in rest and stress CTP datasets. On a per patient level, the resulting semi-quantitative parameters of CTP myocardial attenuation and TPR were in strong agreement between both software versions and among readers, regardless of their level of experience, which points out the robustness of this technique. Furthermore, the diagnostic accuracy was not significantly different with both software versions with conventional coronary angiography as the reference standard.
Robust and time efficient automated software has been recently introduced in the context of automated 3-dimensional (3D) quantification for coronary plaques and showed very good agreement with expert manual plaque quantification as well as excellent correlation to coronary intravascular ultrasound plaque volumetry (24, 25). The latest software developments aim to further improve myocardial contour detection (26).
However, to the best of our knowledge the present study is the first that investigates the time efficiency of automated CTP analysis software including automated myocardial contour detection. In the context of right (27) and left ventricular (28, 29) function assessment in CT, myocardial contour detection has been the subject of previous research and studies have shown that manual myocardial contour tracing is a time consuming method (30, 31) and that automated myocardial contour detection leads to a faster analysis (32, 33). These findings go in line with our observation, where extensive manual correction of myocardial contours was necessary, especially in the former software version, which impaired both the time efficiency and accuracy of the CTP analysis.
In CT, decreased myocardial attenuation and hypoenhancement is known to occur after myocardial infarction (34). CT post-processing techniques for the detection of perfusion defects in patients with acute myocardial infarction were introduced in a recent study (20). Here, the myocardial attenuation between infarcted and normal regions showed a relative difference of around 34% to 96%, depending on the technique that was applied. An approach on volumetric quantitative analysis in regards to the defects of CT myocardial perfusion was proposed in another study (35) as an alternative post-processing technique. This technique, which used semi-automated identification of 3D regions of interest (ROI) to avoid time consuming manual tracing, was also applied in a study to test whether lowering the tube voltage from 120 kV to 100 kV still offers the ability to detect myocardial segments with perfusion abnormalities. The distinction of normal and abnormal myocardial segments was shown to be significant in both groups, but absolute differences in attenuation were reported only as low as 7% and 10% (36). Taken together, the relative differences of myocardial attenuation between normal and hypoperfused segments are possibly large in several cases, but the absolute differences are sometimes small and not easy to detect. Thus, next to the readers experience level, an objective measurement tool should provide a basis for the discrimination between normal and hypoperfused myocardial segments. In the present study, in addition to myocardial attenuation as a semi-quantitative measure the TPR (37) was used. For TPR, the software equally divides the myocardium into a subendocardial, a midmyocardial, and a subepicardial layer. The software calculates the mean attenuation of each myocardial layer within each segment and finally, the ratio between subendocardial and subepicardial attenuation is computed. According to a pilot study by George et al. (37) a TPR is considered abnormal if it is < 0.99 or more than one standard deviation below the mean TPR in the group having normal patients.
In our patient cohort both myocardial attenuation and TPR showed strong agreement between the readers, independent of the level of experience. Thus, a reliable semi-quantitative parameter measurement is provided and anticipated as a prerequisite for discrimination of segments with variable myocardial attenuation. Manual semi-automated assessment of the perfusion deficit by CTP using commercially available software (16) has been shown to closely match the measured perfusion deficit using an automated computer-based analysis of single-photon emission computed tomography (SPECT) myocardial perfusion imaging (MPI). Here, two experienced readers manually assigned regions with perfusion abnormalities in consensus on axial CT images and the measurement was described to be tedious and dependent on reader interaction. From magnetic resonance MPI it is known that inter-observer variability depends on the experience level of readers (38), further pointing out a need for software solutions that result in reader-independent results. Thus, we want to mention the necessity of continuative inter-observer variability studies in CTP.
In our present study we show that the novel automated software for CTP analysis reduces the need for reader interaction. A discrimination between myocardial segments, which show that ischemia and normally perfused myocardial segments are considered as clinically important, was investigated in preclinical (39) and clinical CT studies (8).
However, for both quantitative (5) and semi-quantitative CTP-MPI analysis, no reference standard has been given up to now and so we chose conventional coronary angiography as a reference and that should be acknowledged as a limitation. Further, the diagnostic accuracy of results could not be related to reference modalities like myocardial SPECT or myocardial magnetic resonance perfusion imaging. However, the primary aim of the present study was to evaluate the time efficiency of CTP analysis in readers with different experience levels and to compare the agreement of semi-quantitative results.
In conclusion, recent automated CTP analysis software offers corresponding diagnostic accuracy in parallel with improved myocardial contour detection, enhanced time efficiency, as well as reader independency and might serve as a reliable tool to characterise myocardial perfusion during rest and stress.
Go to :
 XML Download