

 PDF
PDF ePub
ePub Citation
 Print
Print


INTRODUCTION
Within 6 months of Röntgen's discovery of X-ray in 1895, physicians were already utilizing the resulting technology to diagnose and treat diseases (1). Nonetheless, there were still many barriers to achieving its full use. In October, 1920, 13 technicians established the American Association of Radiological Technicians (AART), the first national society of its kind, to overcome these obstacles by sharing ideas and skills on radiologic techniques (1). Since the founding of the AART, radiology has developed rapidly and plays an increasingly important role in the diagnosis of diseases in various clinical settings.
In the recent decades, there have been many new radiologic imaging modalities, including ultrasound, computed tomography (CT), and magnetic resonance imaging (MRI), with numerous applications to clinical practice. The first CT device was invented in 1972 by British engineer, Sir Godfrey Hounsfield, who worked at Electronic & Music Industries Ltd., and South African physicist, Allan Cormack, of Tufts University. The first clinical CT scanners were installed in Atkinson Morley Hospital in Wimbledon, England, and the first patient brain scan was performed on October 1, 1971 (2). In 1979, 7 years after the announcement of their invention, Hounsfield and Cormack were awarded the Nobel Prize for their contributions to medicine and science.
Beyond developments in the types of imaging modalities, there have been additional megatrends in radiology that are of equal importance, including 'being digital,' new display and input devices for picture archiving and communication system (PACS), 3D intelligent and organ-specific workstations, functional and quantitative imaging for imaging biomarkers, imaging genomics, bionics, and robotic interventions for interventional radiology. The digitization of medical imaging allows unlimited data storage and sharing without substantial effort. Spiral CT and volumetric MRI enable 3D visualization and quantitative analysis at the diagnostic workstation, which has become organ-specific in order to more effectively respond to the clinical need at hand. At the present time, the digital state demands that decision support systems based on clinical knowledge modeling, such as computer-aided detection/diagnosis (CAD), are seamlessly integrated into PACS. In addition, the introduction of new display and input devices, including stereovision, holograms, 3D mouse, and stereo cameras, are expanding the ability of the radiologist, who can now efficiently deal with very large amounts of radiologic information.
Molecular, functional, and quantitative imaging is an increasingly important capability in the field of radiology. Oncologic imaging is the clearest example in which functional and quantitative image metrics such as tumor diameter, tumor volume, standard uptake value, and permeability must be determined to assess treatment response. These functional and quantitative data, accessed by the interpreting radiologist in many cases using automated software tools, yield more definitive and ultimately more accurate diagnostic conclusions. From an engineering point of view, the final objective is to establish processes and profiles of the following, which, are accepted by the imaging community, the clinical trial industry, and regulatory agencies: imaging biomarkers as proof of biology, indicators of alterations in the underlying pathophysiology, and surrogate endpoints for changes in the health status of patients.
Imaging genomics is very likely to become another megatrend in radiology. The recent completion of human genome sequencing promises to provide unprecedented opportunities to explore the genetic basis of individual differences, which specifically requires radiologic imaging devices. These may offer a complementary strategy in the examination of genotype-phenotype relationships. Deciphering the complex nature of these relationships will require sophisticated computational methodologies.
The megatrend toward minimally invasive image-guided interventions has also created new challenges in the introduction of robotic technology. For example, the use of master-slave robot control technology and accurate pre-planning support may reduce radiation exposure to operators and patients. In addition, micro-imaging devices and various sensors will improve the safety of image guided interventions.
In this review, we introduce many of these promising megatrends in radiology, i.e. those with the potential to change the future of radiology, and provide insight into their applications from an engineering perspective.
Go to : 
Digitization of Medical Imaging
Unlimited data storage and sharing capabilities, which have rapidly become routine, reflect the digitization of medical imaging (Fig. 1). Consequently, PACS solutions have become an important component of radiology departments, with respect to the infrastructure responsible for medical image management according to the well-known standards elaborated in Digital Imaging and Communications in Medicine (DICOM) (3), Integrating Healthcare Enterprise (4), and Health Level Seven International (5). Since most imaging modalities transmit their images through these standard routes, all such images can be stored in a single PACS solution and then retrieved by physicians using their own desktop imaging software. Although PACS solutions are a vital and well-established commodity in diagnostic radiology, they are still expected to provide an innovation platform in radiology (6). Thus, regardless of the many functions already integrated within state of the art PACS solutions, upgrades by the major vendors continue to enhance productivity relying on medical images based on the following megatrends:
Firstly, PACS is now expanding the territory of its applications beyond the radiology department. Many clinical departments, such as cardiology, dentistry, and radiation therapy, are incorporating medical imaging modalities into their workflow (7). Recently, the DICOM standards have been extended to incorporate medical specialties, such as radiotherapy, cardiology, pathology, and ophthalmology, such that the images can be viewed with respect to their specialty-specific information (8, 9). This has necessitated a wide range of modifications in the pre-existing radiology PACS, since each specialty has its own specific workflow, in addition to the fact that the primary nature of the various imaging modalities differs. So far, most large hospitals have implemented separate and independent PACS solutions for each department, although this is an unnecessarily complex and inefficient way to share images. Instead, it would be preferable for one given PACS solution to manage all patient-relevant images in a unified manner, with server-side components and storage commonly shared by all departments, and optimized access for client viewers according to the requirements of each clinical department.
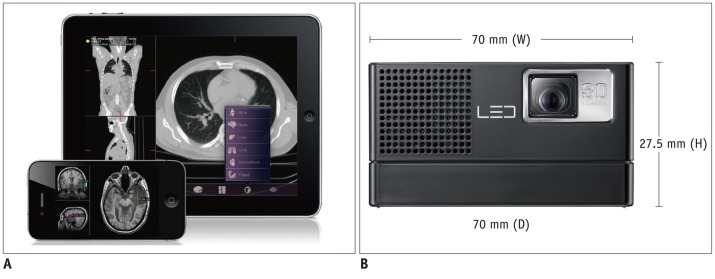
Secondly, PACS viewing is adopting a growing number of image processing algorithms and 3D/4D visualization technologies to support the intuitive and quantitative analyses of clinicians. Nowadays, most PACS are equipped with the advanced visualization and image processing algorithms that, until recently, were available for high-end workstations only. For example, doctors can use PACS with CAD to detect or diagnose suspicious regions more easily and productively (10). Such functions must be available within the PACS viewer itself, as separate workstations are unable to significantly enhance daily routine workflow, due to the computational complexity, network bandwidth limitation, and the lack of hardware capabilities at the client workstations. To overcome these obstacles, server-side computing technologies, such as the thin-client approach, have been used intensively for PACS implementation (11). Transmission of the images to the central PACS solution allows its computing machines to be configured, such that computer-intensive image processing is performed automatically. Doctors can then view the pre-processed results, including those related to segmentation, registration, quantification, or CAD. In addition, thin-client technology will enable doctors to make use of the full range of complex image processing and visualization techniques anywhere and at anytime. These technologies will be the key foundation in a mobile environment, in which the development of devices such as smartphones and tablets, including Google Android™ devices, Apple iPhone™, and iPad™, are already recognized as one of the most significant developments in the IT world.
Go to :
Computer-Aided Detection/Diagnosis
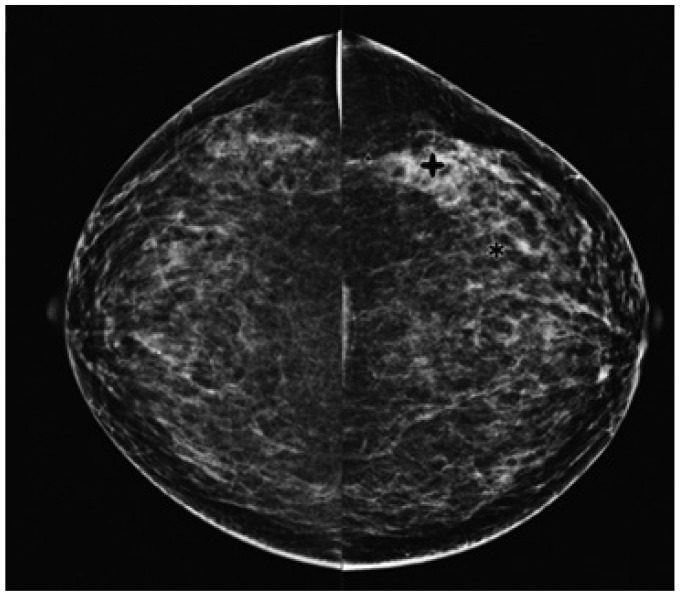
Clinical intelligence and knowledge must be integrated into PACS solutions to support daily radiology tasks. Although attempts at computerizing the analysis of medical images (12, 13) were previously made in the 1960s, serious and systematic investigations into the possibility of CAD began in the 1980s, paralleling a fundamental change in the concept of computer output utilization, from computer-automated to computer-aided diagnosis (14-17). While those efforts were initially hindered by the difficulty of digitalizing medical images (14), CAD has since become a major focus of research, and developments in this field have been incorporated into the routine diagnostic radiology approach to the detection of breast cancer on mammograms (Fig. 2) (18-24). The motivation and philosophy guiding the early development of CAD was the application of intelligence and knowledge to PACS, based on medical images being digital. With CAD, radiologists are able to use computer decision supports as a second opinion in reaching a final diagnosis, which means that computer performance compliments decision making by physicians. In fact, in addition to the aforementioned application in breast cancer detection (18-23), CAD has the potential to improve overall performance in the detection of lung nodules (25-29) and vertebral fractures. The latter can be reliably detected by CAD on lateral chest radiographs (30), thus improving the early diagnosis of osteoporosis (31). In MR angiography, a CAD system has been developed to detect intracranial aneurysms (32, 33). Interval changes on successive bone scan images, such as those obtained from patients with suspected bone metastases, can also be detected using a CAD system, based on the subtraction images (34).
Many different types of CAD systems have been recently implemented as part of PACS solutions (10, 35-38). In chest radiographs and CT scans, the package for chest CAD might include the automated detection of lung nodules, interstitial opacities, cardiomegaly, vertebral fractures, interval changes, etc., as well as the automatic differentiation of benign and malignant nodules, and the differential diagnosis of interstitial lung diseases. This seamless integration of CAD and PACS significantly increases reader sensitivity and reduces the average image reading time, thus vastly improving the efficiency of daily clinical practice (35). In the near future, it should be possible to use PACS to search for and retrieve lesion images that are similar in appearance to previously queried images, based on a set of primitive image characteristics which are not related to any specific diagnostic method able to visually characterize the image, by utilizing reliable and practical methods developed for quantifying the similarity of a pair of images for further visual comparison by radiologists (39-42). Similar content-based image search engines will no doubt be of interest to all medical specialties that make use of medical imaging or digital biomedical signals, drawing support from the information available in medical archives (40).
Go to :
Organ-Specific Diagnostic Workstations
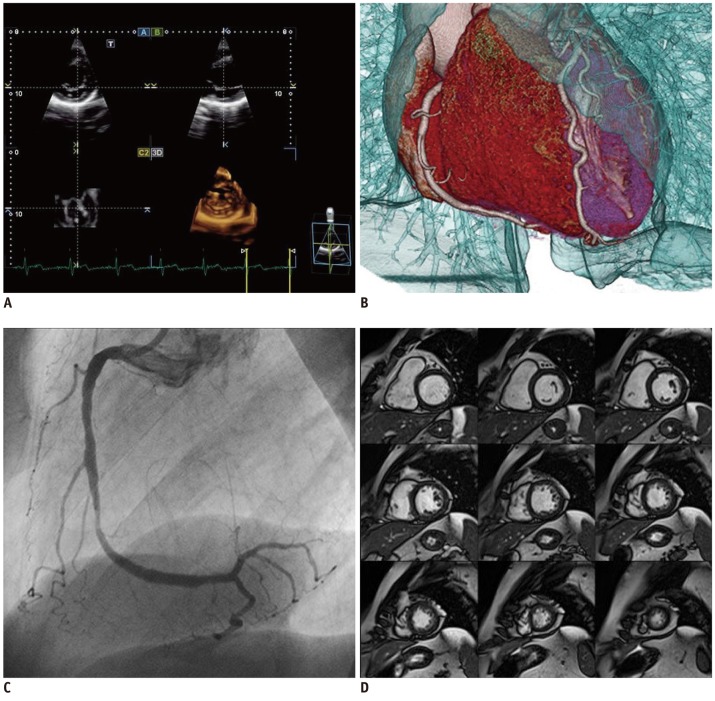
Beyond the simple display of medical images, radiologic diagnosis demands more specialized image processing, based on targeted organ types, organ-specific diagnosis, or organ-specific surgery procedures, in order to increase the accuracy and the efficiency of the workflow. Therefore, not only major modality vendors (Siemens Healthcare, Erlangen, Germany, GE Healthcare, Milwaukee, WI, USA, Toshiba Medical Systems, Tokyo, Japan, and Philips, Best, The Netherlands) (Fig. 3), but also 3D medical image visualization and processing software companies (e.g., TeraRecon, MeVis, Aze, and INRIA) have been expanding their 3D visualization platforms to include organ-specific workstations. In particular, Aze has developed organ-specific workstations with more than 50 organ-specific modules, while software companies such as EDDA Technology and Diagnostics focus on specific organs, such as liver and lung, respectively. The organ-specific capabilities of these workstations are detailed as follows.
Cardiology workstations differ from general radiology workstations. In the latter, the workflow for viewing and reporting study cases is primarily driven by an imaging request, whereas the cardiology workstation must access all cardiology imaging data for each patient, which may be stored across a number of different storage systems. Thus, data recorded during a cardiac catheterization procedure would also be available for viewing on a cardiology workstation.
Brain-imaging workstations require advanced visualization techniques to allow the interpretation of images from the various MRI imaging (anatomic, perfusion, diffusion, functional, etc.). Some commercial stand-alone workstations, e.g., BrainVoyager and BrainMagix, are specifically devoted to brain imaging. In addition to commercial workstations, a number of academic open source programs have been developed and distributed for various purposes such as brain segmentation, functional imaging analysis, and diffusion tensor imaging (DTI). Well-known systems include Harvard University's FreeSurfer, for the analysis of the cortical thickness of the brain (43, 44); the University of Birmingham's Brain Imaging Lab, for general neuroimaging analysis (45); and the University of Pennsylvania's DTI-TK, for atlas construction (46).
Mammography also requires a workstation with a specialized functionality, because the ability to detect fine details in mammography images is vital to their effective use in diagnosis. Therefore, image analysis software must be capable of resolving micro-calcifications, the appearance of which can be a clinical indicator of pre-cancerous changes in the breast. Currently, there are several commercial systems that offer the required functions, such as IDI Mammography Workflow Solutions (GE Healthcare, Milwaukes, WI, USA), IDS7/MX (Sectra: Linköping, Sweden), and the BX Mammography Workstation (Neusoft Neusoft, Shenyang, China).
Finally, lung workstations also require special processing algorithms, such as lobar segmentation, airway segmentation, airway tree labeling and wall measurement, parenchymal density analysis, and emphysema analysis. The pulmonary workstation developed by VIDA Diagnostics has been widely adopted. The GE Advantage Workstation™ has advanced lung analysis modules, while the TeraRecon Aquarius workstation includes lung nodule tracking and analysis functions. In addition, some academic labs in South Korea and Netherlands have developed in-house software for lung specific workstations (47-55).
Go to :
Functional, Molecular, and Quantitative Imaging
Despite the many advantages offered by these technologies, the differential diagnosis together with the standard qualitative reporting procedure is very likely to remain the heart and soul of radiology. However, radiology is gradually embracing functional and quantitative metrics, which provide vital information in an increasing number of radiology settings.
In general, functional imaging means functional magnetic resonance imaging (fMRI) to detect blood-oxygen-level-dependent contrast material, as an indicator of brain neuronal activity. Following the groundbreaking discovery of fMRI by Ogawa et al. (56), it was applied in a large number of studies aimed at discovering the 'secrets' of the brain. Thus far, fMRI has been used to study not only neuroscience with respect to memory, cognition, brain-robot interfaces, etc., but also to obtain evidence of the diagnosis-specific patterns of brain activation in various neurologic diseases (57-61).
The management of oncology patients increasingly depends on medical imaging to reach a diagnosis, as well as to monitor treatment response and follow-up. The clinical applicability of combined functional and anatomical imaging modalities, which integrate the benefits of visualizing tumor biology with high-resolution anatomical imaging, has revolutionized the clinical management of cancer patients (62). High-resolution anatomical imaging modalities such as CT and MRI provide detailed structural information regarding lesion location, size, morphology, and morphological changes, but they do little to further the understanding of tumor physiology. With the increasing focus on molecularly targeted therapies, imaging radio-labeled compounds with positron emission tomography (PET) and single-photon emission tomography (SPECT) are often carried out to gain insights into the biology and surrounding environment of the tumor (63, 64). The availability of multimodality imaging with PET/CT, SPECT/CT, and PET/MRI has the potential to improve lesion characterization, treatment decision-making, and patient management, to name just a few of its potential advantages. In addition, continual developments in instrumentation and imaging agents will improve the ability to non-invasively evaluate disease processes (64).
Based on these developments, the Radiological Society of North America (RSNA), has committed to help transform patient care by making radiology a more quantitative science (65-68). Quantitative imaging is the extraction of quantifiable information from medical images to define the normal condition or to measure the severity, degree of change, or status of a disease, injury, or chronic condition relative to normal. This requires the development, standardization, and optimization of anatomical, functional, and molecular imaging acquisition protocols, data analyses, display techniques, and reporting systems. This information will allow the validation of accurately and precisely obtained image-derived numerical metrics with anatomically and physiologically relevant parameters, including treatment response and outcome, and the use of such metrics in research and patient care.
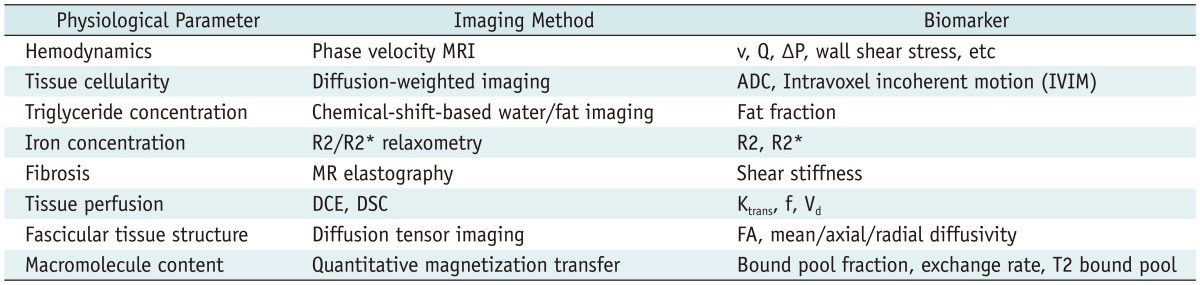
Efforts to accumulate public resources and open source tools in order to qualify longitudinal volumetric CT imaging for use with imaging biomarkers (Table 1), i.e., reproducible biologic features detectable by imaging modalities (69), were re-invigorated in 2005 by an informal alliance between the US Food and Drug Administration (FDA), the National Cancer Institute, the National Institute of Standards and Technology (NIST), and the National Institute of Biomedical Imaging and Bioengineering (NIBIB) (70-74). The preliminary initiative of this inter-federal agency led to the organization of a public workshop, which was held at the NIST headquarters in 2006 and modeled on the Integrating Healthcare Enterprise. The Scientific Advisory Board of the RSNA met in 2006 and consequently established a Quantitative Imaging Biomarker Alliance (QIBA), with the aim of advancing quantitative imaging and the use of imaging biomarkers in clinical trials and clinical practice by engaging researchers, healthcare professionals, and industry members (67). RSNA was awarded a two year, $2.4 million contract from the NIBIB to support QIBA. This contract encouraged a coordinated effort to establish an infrastructure for collecting and analyzing imaging biomarker data. The purposes of QIBA are two-fold: collaborating to identify needs, barriers, and solutions to develop and test consistent, reliable, valid, and achievable quantitative imaging results across imaging platforms, clinical sites, and time; accelerating the development and adoption of hardware and software standards needed to achieve accurate and reproducible quantitative results from imaging methods (75). In terms of engineering, QIBA could resolve major problems, including differences between vendors or between different machine versions of the same vendor.
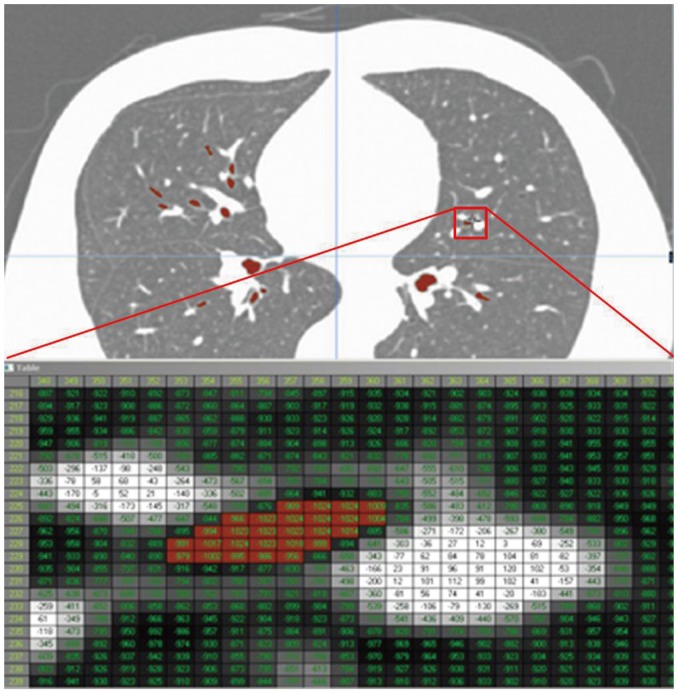
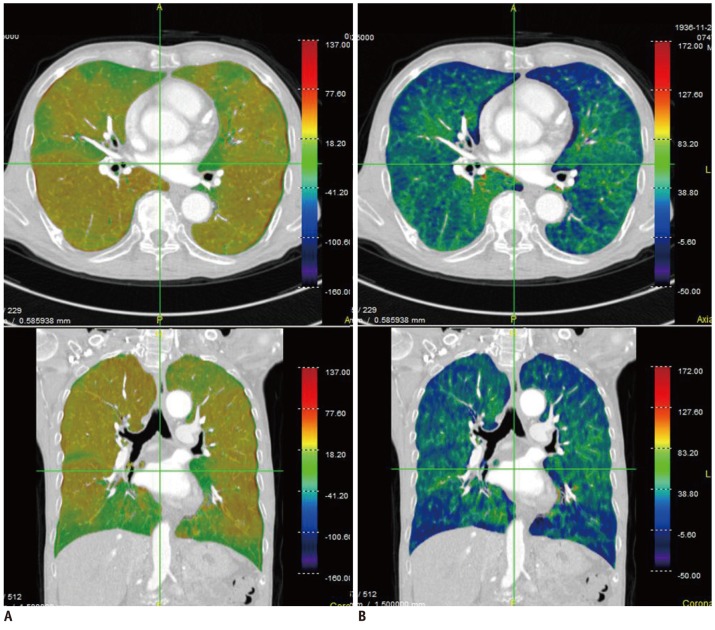
Extensive research has also been carried out in the field of pulmonary functional and quantitative imaging. In the former, xenon ventilation (76, 77) and iodine perfusion (47) using dual-energy CT have been evaluated (Fig. 4). In quantitative imaging, lung segmentation, airway measurement, textural analysis of the parenchyma, automatic quantification, follow-up analysis, and clinical applications were examined (47-53).
Go to :
New Display and Input Devices
With the goal of diagnosing and evaluating patients non-invasively, medical visualization is a highly intuitive approach, and its applications are being continually extended. Effective visualization of the disease region to determine its position is likely to go beyond the realm of diagnosis to include minimally- or non-invasive examination and treatment. The emerging technologies to display the products of visualization and the input devices for seamless interaction with users are introduced in this section.
One of the trends of display devices is to show more realistic depictions by making use of 3D depths, such as stereovision (78). When combined with a 3D diagnostic workstation, surgical planning software, simulation, and a robot-master console, there are benefits in terms of usability, as relative depths are displayed among the complex 3D anatomical shapes, the different organs, and the end effectors.
In general, while most stereovision systems require special glasses, 3D virtual scenes can be generated without them if the user's typical viewing distance and viewing direction are within the specified range, such as is demonstrated by the small mobile devices (79, 80). Another option is holographic technology, which generates 3D objects rather than a virtual model. Pennsylvania based Ark Media shows a cylindrical holographic example of the lungs (81) that can be viewed 360° (82).
While realistic virtual reality or holography has many technical limitations, augmented reality offers greater opportunities and feasibility. In the operating room, separate 2D monitors are generally used to show pre-operative and intra-operative medical images, with the positions of current surgical devices obtained via surgical navigations. However, viewing distracts visual attention from the surgical field to the display monitors, thus disturbing the surgeon's concentration and requiring a substantial amount of imagination and attention in the interpretation of the displayed images. Accurately and effectively displaying the image directly on the patient's body would obviate the need for a mapping process between the monitor and the patient. These technologies could be useful to the interventional radiologist in determining entry points and the direction of needle insertion.
In this context, Kutter et al. (83) developed a real-time volume-rendering system that is set up over the patient's body and makes use of the head mount display devices shown, while Werkgartner et al. (84) explored a 3D model overlay on a 2D image plane. Although their clinical applicability awaits further testing, these novel systems may provide an alternative method, allowing intuitive and seamless access to displays in the operating room.
Another trend in display devices is portability. High-resolution portable devices and thin-client software systems via networks allow diagnoses to be made on demand. The limited size of the mobile display devices can be solved by small pico-projectors such as the one shown in Figure 5.
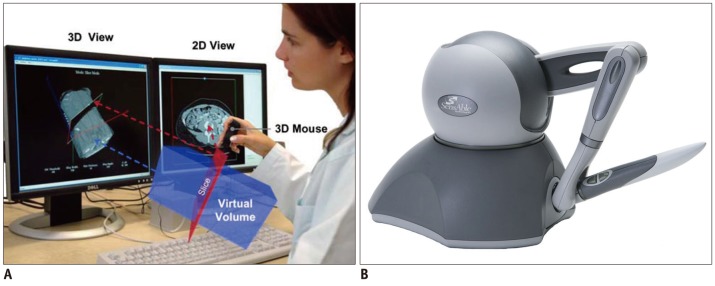
As the popularity of 3D display devices continues to grow, the requirements for new, compatible input devices will also grow. Figure 6 shows 3D input devices allowing the control of medical images and a haptic device. A 3D mouse is an input device with more than 3 degrees of freedom (DOF) about a rigid-body transformation. Typically, there are 6 DOF: 3 related to translation, and a maximum of 3 related to rotation. The 3D mouse shown in Figure 7A is used to interact with the medical image browser (85). Sometimes haptic devices that provide force feedback, including 6 DOF positioning and remote robotic control, are used for special purposes.
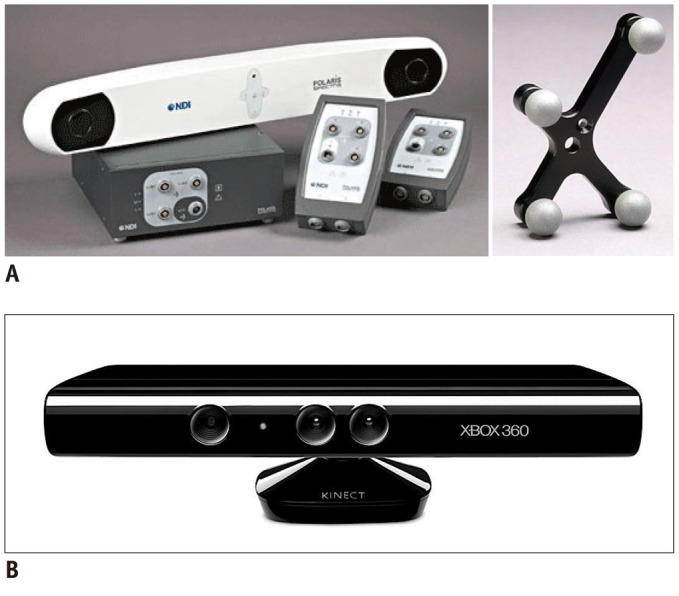
In reality, as opposed to virtual space, stereo acquisition systems are generally used to obtain depth information. Similar to human vision, the depth information can be calculated using the difference perceived by binocular vision. Figure 7B shows a low-priced general-purpose stereo camera, Kinect™, developed by Microsoft Corp. Since its software development toolkit includes a human motion analysis function, a visual sensor for the detection of human gestures has attracted attention. However, the current version is plagued by the problems of latency and relatively large spatial errors when used for images. For fast and accurate 3D tracking, special markers are often adopted, as shown in Figure 7A. These have been widely employed in medical applications as a navigation system.
Go to :
Imaging Genomics
Imaging genomics is defined as an association analysis between genes and a physiological response of the brain during specific information processing, which is captured in images (86). It is a field of study that integrates molecular genetics, represented by the Human Genome Project, with neuroscience, based on recent progress in neuroimaging modalities, since approximately 70% of all genes are expressed in the brain (86). Closely related to bioinformatics, imaging genomics has advanced rapidly because of the increase in scanning data obtained from individuals using structural and functional MRI, and the emergence of voxel-wise methods that search every location in the brain for statistical analysis (87, 88).
Many genes expressed in the brain are important in disease, including behavioral disorders, not only with respect to understanding disease mechanism but also in the diagnosis of patients with suspected pathologies, as well as in the identification of individuals at risk and in the development of new treatments. Even if genes are not solely responsible for disease, twin studies have shown 40-70% heritability in cognition, personality, and other human behavioral patterns (86). In addition, genes are known to be the only consistent risk factor for psychiatric disease. The 3D neuro-anatomical patterns of gene effects can be visually assessed using DTI.
Magnetic resonance imaging-based methods including DTI and fMRI are regarded as the most fruitful modalities in imaging genomics. In addition, there may be related applications that benefit from nuclear medicine modalities, i.e., PET and SPECT. While magnetoencephalography and electroencephalography are also of interest in this setting, this paper will focus on the various MRI sequences.
To apply neuroimaging to a specific behavioral study, Hariri and Weinberger (86) suggested three general procedures: selection of candidate genes, control for non-genetic factors, and task selection. The first step involves the selection of the appropriate candidate genes, that is, those related to the behavior of interest. Depending on the gene, functional polymorphisms may be well known, circumscribed, or unknown. While candidate genes with identified single nucleotide polymorphisms are tractable in imaging genomics, studies based on genes which have poorly or not at all understood functional effects and their variations should be carefully designed. Second, non-genetic factors must be controlled for, as the effects of a single gene on the brain may be limited. Thus age, gender, or environmental factors may prevent the effects of a single gene from being detected unless a carefully matched control is included across genotype groups. Lastly, as the effects of single genes are relatively small, and potential gene effects are the detection targets of information processing, it is recommended that imaging tasks that are known to be effective for information processing are selected in order to maximize the sensitivity of those tasks.
For example, apolipoprotein E4 (APOE4) is one of the most studied polymorphisms in neuroimaging. The various APOE4 alleles are known to increase the risk for developing late-onset Alzheimer's disease (before the age of 75 years) by three-fold. A decrease in the volumes of grey and white matter in the brains of the elderly is also related to APOE4 levels (89-91). Children carrying this gene later show cortical thinning and trajectory changes; in addition, resting-state activity in the young brains of these gene carriers is modified (92, 93). Besides genes related to Alzheimer's disease and schizophrenia, mutations of the Parkin gene (PARK2) and the PINK1 gene (PARK6) are known to cause Parkinson's disease. Van Nuenen performed a neuroimaging study for individuals with PINK1 (94). In tumor evaluation, the gene expression patterns for a mouse tumor model have been attempted using MRI (95).
Imaging genomics is a promising field of study that has many advantages over earlier approaches to genetic research, especially in light of the steady advances in medical imaging technologies. Imaging genomics may be better than epidemiological studies, as the former can demonstrate the roles of genes in psychotic disorders, including schizophrenia, and requires fewer subjects with high behavioral accuracies (96).
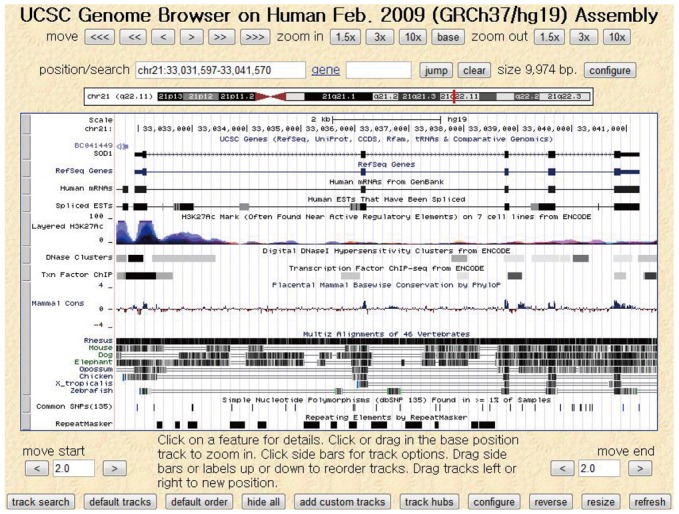
Active studies on imaging genomics began with the completion of the Human Genome Project in 2003 and are still ongoing (87). Many academic institutes have provided software, databases, and websites to facilitate gene studies. For instance, the University of California, Santa Cruz hosts an online genome browser service (Fig. 8), called the UCSC Genome Browser, in which users can access a database of genome sequences and download related documentation (97). Another example is the Galaxy platform, supported by multiple organizations including Pennsylvania State University and Emory University, which offers a scientific workflow, data integration, and analysis services with a graphical interface (98). In addition, international conferences such as the Imaging Genetics Conference at the University of California, Irvine continue to promote research on genes and medical imaging technologies. Imaging genomics has recently expanded from the brain to include the imaging of various organ-specific diseases, such as chronic obstructive pulmonary disease (99), cardiovascular disease (100), and cancer (101).
Go to :
Robotic Interventions
The word 'robot' was originally introduced in the play "Rossum's Universal Robot," written by the Czech dramatist Karel Capek in 1921, in which the meaning of robot was a laborer or servant (102, 103). It was in 1958 that robots were adopted in the real world for manufacturing automation, by the General Motors Company. Sometime later, robots began to be used in various fields.
The first medical robot was ROBODOC, released in 1992 by Integrated Surgical Systems; it was an automatic-drilling robot that inserted orthopedic implants in artificial-joint replacement surgery (104). However, as a fully automatic robot, obtaining FDA approval was a prolonged process which was not accomplished until 2008, at which point the company had partnered with a Korean company, Curexo Technology Corporation.
For laparoscopic surgery, human-controlled, master-slave robots were developed. In the 1980s, Scott Fisher carried out research in this field at the National Aeronautics and Space Administration (103). In the 1990s, Phil Green devised a tele-operated surgical system at Stanford Research Institute (SRI). Based on these developments, the US Department Of Defense invested tremendous amounts of money into the research and development of surgical robots (105, 106). Frederick Moll also acquired the technologies of a tele-operated surgical robot from SRI, and in 1995 he established Intuitive Surgical, which released the first version of the da Vinci surgical robot system (107, 108).
In this current technology, the surgeon's hand motions are used to manipulate robot arms and surgical instruments. Similar strategy has been applied to image-guided surgery, in which pre-operative or intra-operative CT/MR images are the basis for robot manipulation. With the development of the surgical robot, robotic intervention has been introduced, with remote manipulation systems for needle and catheter. Needle manipulation robots have a multi-joint actuation mechanism for instrument motion, which is controlled either by a computer that automatically analyses real-time images of the intervention or by a remotely located human operator with a master control device. This interventional real-time image can be obtained by ultrasound, X-ray fluoroscope, MRI etc. The motion of the master control device, guided by its human operator, is conveyed to the actual procedure slave robot. While needle manipulation robots have been intensively tested, they have not yet reached full-fledged commercialization, which means that more studies and innovative developments are required to prove their clinical efficacy. On the other hand, systems for catheter manipulation have been actively commercialized, and are drawing increasing interest in assisting catheter treatment. Meaningful success has been demonstrated both clinically and industrially.
Needle manipulation robots have a wide spectrum of clinical applications. As a general overview, the notable trends in their adoption can be summarized as follows. 1) Robots to assist needle biopsy under CT or X-ray fluoroscopy have recently re-gained research interest, possibly in accordance with the increasing interest in technologies for minimally-invasive treatments. 2) Numerous studies involving MR-compatible robotic biopsy are underway, in response to clinical demand for improvements in the diagnosis of prostate cancer. 3) One of the novel innovations in needle manipulation robots is steerable needle implementation.
In a few recent studies, active steering of the needle tip to achieve a curved insertion, in order to avoid vessels or dangerous regions, has been investigated. Nuebach and Shoham (109) reported a robotic system for flexible needle steering inside soft tissues, with real-time ultrasound imaging. An inverse kinematics algorithm based on a virtual spring model was applied to evaluate the needle base manipulations required for the tip to follow a predetermined curved trajectory. A closed-loop experiment with updated tissue stiffness parameters demonstrated a needle tip tracking error of less than 1 mm (109).
Recently, novel technologies have been explored by several research groups. Ganji et al. investigated the implementation of electromagnetic tracking of the spatial position of the catheter tip. The electromagnetic signal was used to achieve a kind of automatic control. The system automatically guides the motion of the catheter along a path specified by the operator (110). Patel et al. developed an actively controllable catheter, embedding a shape memory alloy. Through image processing and a visual-servo technique, the motion of the catheter is automatically controlled along a path determined by the visual signal (111). Plicchi et al. reported clear benefits for tele-control systems compared to conventional manual approaches, in that the operation time required for maneuvering the catheter is considerably reduced (112, 113).
Go to :
CONCLUSION
Since the discovery of X-ray in 1895, radiology has opened the gate to new technical developments in the field of medicine, with a broad range of clinical applications. In this review, written from an engineering perspective, we have pointed out some of the megatrends in radiology, including digitization, new display and input devices, and the rapid developments of various imaging modalities. Additional radiologic demands, including intelligent support and workflow-specific PACS, functional and quantitative imaging, and CAD and organ-specific workstations, may give rise to several new megatrends. Finally, robotic interventions for biopsy and theragnosis, as well as for imaging genomics, are likely to set off another such wave in the near future. These innovations will expand the role of medical imaging in both diagnosis and treatment.
Go to :
 XML Download