

 PDF
PDF ePub
ePub Citation
 Print
Print


INTRODUCTION
Breast cancer is the most common cancer among women worldwide. Although the survival rate of breast cancer patients has improved, survival remains poor for advanced-stage patients, especially for patients with locally advanced breast cancer. In patients with locally advanced breast cancer, treatment is usually initiated with neoadjuvant chemotherapy (NAC), followed by post-operative chemotherapy. Despite added toxicity and economic burdens, NAC can downstage breast cancer and eliminate micrometastases. Consequently, NAC can affect the overall survival. Evaluating the change in the tumor burden among locally advanced breast cancer patients during NAC is important in planning further treatments (1-8).
Several methods are used to evaluate the chemotherapeutic response of breast cancer patients, including clinical examination, mammography, ultrasound, computed tomography (CT), magnetic resonance imaging (MRI) and positron emission tomography-CT (PET-CT). Although PET-CT can evaluate the functional and metabolic changes, MRI is accepted as the best imaging modality for monitoring the response to NAC (4, 5, 9). Some reports have shown that dynamic contrast-enhanced MRI can reflect the tumor pathophysiologic response to NAC before any changes occur in the tumor volume (1-3, 9).
Two sets of response evaluation criteria have been established for solid tumors; the response evaluation criteria in solid tumor (RECIST) criteria and the World Health Organization (WHO) criteria. These criteria help to convert radiologic imaging observations into a quantitative assessment of a tumor's response to therapy (10-14). These criteria have been widely used for several decades and have undergone modification in the response to criticism. The RECIST criteria (version 1.1) have been recently revised to incorporate changes in several areas, including the following: the number of lesions measured; assessment of pathologic lymph nodes; definition of minimal diameter criteria for disease progression; application of 18F-fluorodeoxyglucose positron emission tomography (FDG-PET) imaging; and comments on new lesions included in the target lesions (4, 15-17).
The aim of this study is to compare the performance of the RECIST 1.0 criteria with the RECIST 1.1 criteria in evaluating the response of breast cancer patients to NAC using MRIs, and to ascertain the supplement points of a new version of RECIST.
Go to : 
MATERIALS AND METHODS
Patients and Treatments
This retrospective study included 79 patients with a pathologically proven diagnosis of locally advanced breast cancer, who were treated with NAC between February 2005 and March 2010. All patients underwent a baseline MRI before NAC. MRI was repeated after the completion of NAC within 1-4 weeks. Subsequent surgery was performed within 4 weeks after post-chemotherapy. Patients ranged in age from 29 to 78 years, with the mean age of 51.0 ± 9.3 years. The institutional review board approved the study protocol, and written informed consent was waived.
The clinical tumor-node-metastasis (TNM) stages of the pre-chemotherapy breast cancers were I (n = 4), IIA (n = 19), IIB (n = 26), IIIA (n = 25), IIIC (n = 4) and IV (n = 1). Most of the patients were treated with anthracyclinebased and taxane-based chemotherapy. Six patients were treated palliatively with anti-estrogen agents or Herceptin. The cycles of NAC are ranged from minimal of 2 to maximum of 7 cycles. The pre-chemotherapy MRI was performed before NAC, and the post-chemotherapy MRI was performed 1 to 4 weeks after NAC. All the patients underwent either breast-conserving surgery with axillary nodal dissection and adjuvant radiotherapy or modified radical mastectomy.
MRI Acquisition
The MR images were acquired with a 1.5 T scanner (Achieva, Philips Medical Systems, Best, the Netherlands) and a 3.0 T scanner (Magnetom Verio, Siemens Medical Solutions, Erlangen, Germany), equipped with a breast coil. MRI images with the Achieva scanner were acquired using the following sequences: 1) a sagittal, fat-suppressed, fast spin-echo T2-weighted imaging sequence with a repetition time (TR)/echo time (TE) of 6000/100, a flip angle of 90, 30 slices with an field of view (FOV) of 320 mm, a matrix size of 424 × 296, 1 number of excitation (NEX), a slice thickness of 4 mm with 0.1 mm interslice gap and an acquisition time of 2 minutes 56 seconds; and 2) a pre- and dynamic axial T1-weighted three-dimensional, fat-suppressed, fat-spoiled gradient-echo sequence with a TR/TE of 6.9/3.4, a flip angle of 12°, a slice thickness of 2.0 mm and an acquisition time of 1 minute 31 seconds. Images were obtained before contrast injection, as well as at 0, 91, 182, 273, 364 and 455 seconds after a rapid bolus injection of 0.2 mmol/kg body weight of gadolinium-diethylenetriamine pentacetic acid (Gd-DPTA) (Magnevist, Schering, Berlin, Germany).
The MR images from the Verio scanner were acquired using the following sequences: 1) an axial, turbo spin-echo T2-weighted imaging sequence with a TR/TE of 4530/93, a flip angle of 80°, 34 slices, a FOV of 320 mm, a matrix size of 576 × 403, 1 NEX, a slice thickness of 4 mm and an acquisition time of 2 minutes 28 seconds; and 2) a pre- and post-contrast, axial T1-weighted flash three-dimensional, volume interpolated breath-hold examination sequence with a TR/TE of 4.4/1.7, a flip angle of 10°, a slice thickness of 1.2 mm and an acquisition time of 7 minutes 7 seconds. These images were obtained before contrast injection and at 7, 67, 127, 187, 247 and 367 seconds after an injection of Gd-DPTA. We used the same modalities and imaging acquisition variables and field strength for the post-chemotherapy MRI, as for pre-chemotherapy MRI.
Radiologic Analysis
Two radiologists, who were experienced in evaluating MR images of the breast and unaware of the pathologic outcomes, interpreted all the cases in this study. According to RECIST 1.1, a lymph node with a short axis more than 1.5 cm was considered measurable, and these lymph nodes were assessed as target lesions. A maximum of two target lesions were assessed. The target lesions were selected on the first phase of dynamic imaging, and the measurement of those was performed mainly in maximal intensity projection (MIP) images for reducing the axial variation. The longest diameter of tumor masses or the short axis of lymph nodes greater than 1.5 cm was measured. After chemotherapy, the longest diameter of the tumor and the short axis of the visible lymph nodes were measured. If the lesions did not disappear completely, but still could not be precisely measured, then it was assigned a value of 5 mm. If the lesion was totally absent after therapy, then it was assigned a value of 0 mm. If the target lesion was split into fragments after chemotherapy, the longest diameter of fragments were added to the target lesion sum, as the RECIST recommendation (15).
The response to NAC, as assessed by MRI, was classified as follows; based on RECIST 1.1 criteria: complete response (CR) was defined as the disappearance of all tumor foci; a partial response (PR) was at least a 30% decrease in the tumor diameter; progressive disease (PD) was at least a 20% increase in the sum of all tumor diameters from the smallest tumor size; and stable disease (SD) was neither a PR nor PD. Patients with a complete or PR on MRI were considered to be responders, and the patients with stable or PD were considered to be non-responders.
Surgical Analysis
The maximal dimension of lesions in one plane was measured in all surgical pathology specimens. According to Sataloff's criteria, patients who had more than 50% tumor necrosis or fibrosis on pathology were defined as responders and those with < 50% necrosis or fibrosis were defined as non-responders (18).
Statistical Analysis
To compare the longest diameters of main tumors assessed on MIP images of post-chemotherapy MRI, with those of the surgical specimens, the bivariate correlation analysis was applied, and the Pearson's correlation coefficient (r) was calculated.
The sensitivity, specificity, accuracy, positive predictive value (PPV) and negative predictive value (NPV) of RECIST 1.0 and 1.1 were calculated with respect to the response evaluation, using the pathologic results as a reference. Additionally, receiver operating characteristic (ROC) analysis was performed as to a reduced diameter ratio to assess and compare the diagnostic performance of RECIST 1.0 and 1.1. To summarize the overall performances, the areas under the ROC curves (AUC) were calculated and compared. Statistically significant differences between the AUC values are reported in terms of the 95% confidence interval (CI).
The two-tailed Mann-Whitney test and Student's t test were used to assess the predictive role of the parameters among responders and non-responders. Statistical analysis was performed using SAS version 9.1.3 (SAS institute, Cary, NC, USA) and MedCalc ver.10.1.6 (MedCalc software, Mariakerke, Belgium).
Go to :
RESULTS
The pathologic characteristics of the patients in this study are summarized in Table 1. The tumor types were invasive ductal carcinoma in 72 patients (91.1%), invasive lobular carcinoma in 2 patients (2.5%), invasive micropapillary carcinoma in 2 patients (2.5%), metaplastic carcinoma in 2 patients (2.5%) and mucinous carcinoma in 1 patient (1.4%). Pathologic evaluation showed that there were 45 responders (57.0%) and 34 non-responders (43.0%).
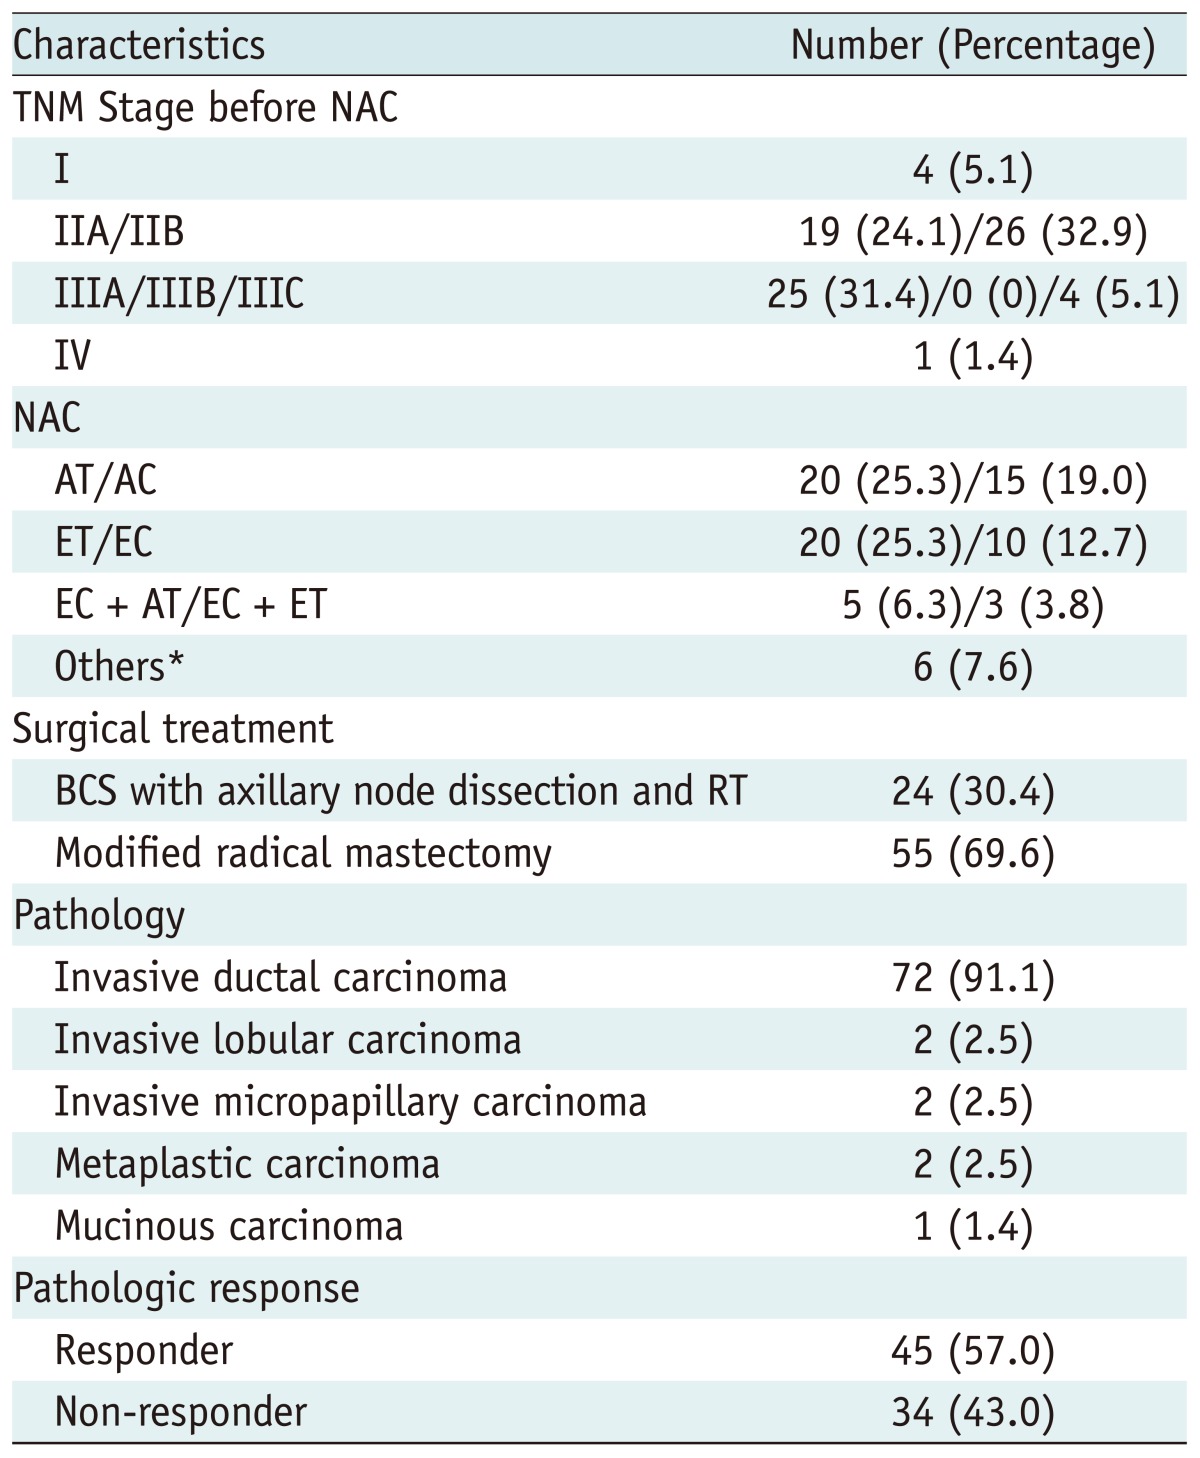
Table 1
Patient Characteristics
Note.- *Letrozole, navelbine, and herseptin. TNM = tumor-node-metastasis, NAC = neoadjuvant chemotherapy, AT = Doxorubicin (adriamycin)-taxotere (Docetaxel) combination therapy, AC = adriamycin-cycolophosphamide combination therapy, ET = epirubicin-doxetaxel combination therapy, EC = epirubicincyclophosphamide combination therapy, BCS = breast conserving surgery, RT = radiation therapy
![]()
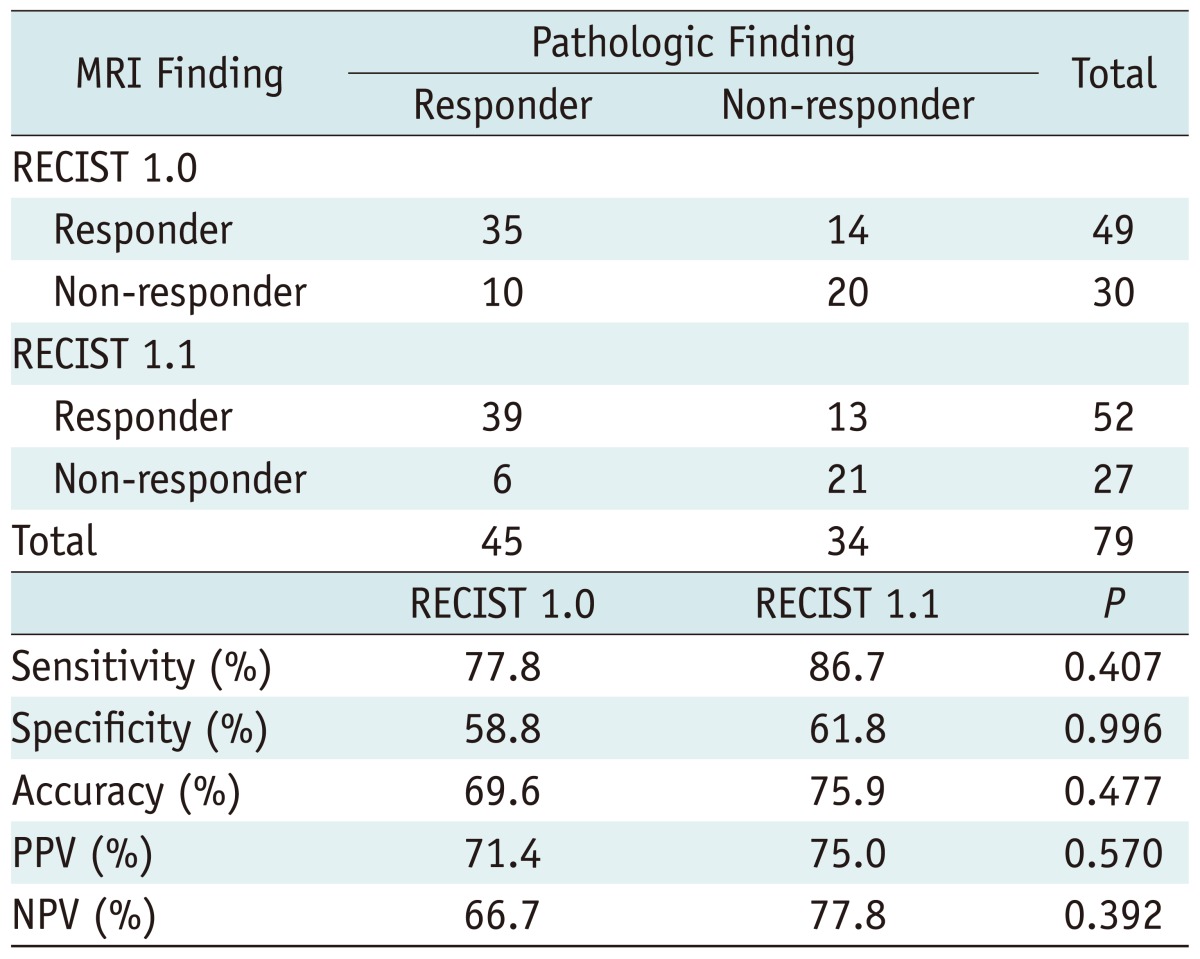
The diagnostic performances of RECIST 1.0 and 1.1 on MRI are summarized in Tables 2, 3. Forty-nine patients were classified as responders, based on the RECIST 1.0 criteria; this agreed with pathology in 35 of 45 cases (77.8%). In terms of predicting pathologic response, the sensitivity, specificity, accuracy, PPV and NPV of the RECIST 1.0 criteria were 77.8%, 58.8%, 69.6%, 71.4% and 66.7%, respectively. Fifty-two patients were classified as responders based on the RECIST 1.1 criteria; this agreed with pathology in 39 of 45 cases (86.7%). In terms of predicting a pathologic response, the sensitivity, specificity, accuracy, PPV and NPV of the RECIST 1.1 criteria were 86.7%, 61.8%, 75.9%, 75.0% and 77.8%, respectively. In terms of absolute numbers, the RECIST 1.1 criteria showed higher percentage in sensitivity, specificity, accuracy, PPV and NPV than the RECIST 1.0 criteria in predicting a pathologic response (Figs. 1, 2), but there was no statistically significant difference between the two methods, as shown in Table 2.
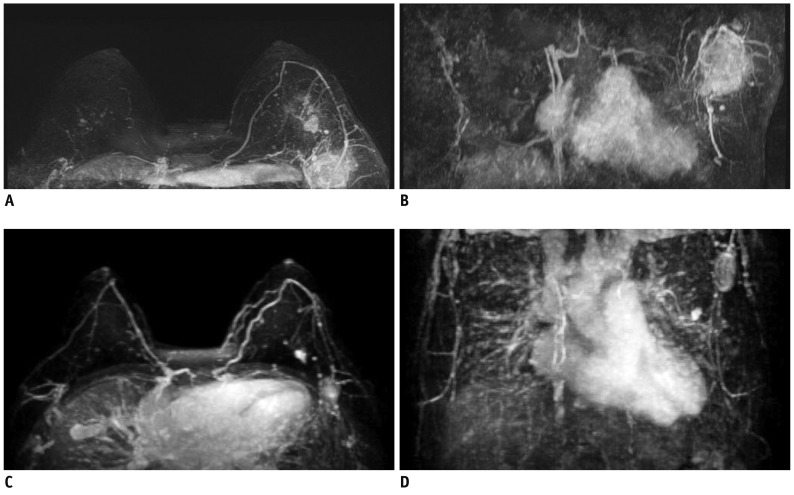 | Fig. 144-year-old woman with invasive ductal carcinoma in left breast underwent neoadjuvant chemotherapy (ET-epirubicin-doxetaxel combination therapy) four times.
Small main mass and large axillary lymph node metastasis were present on both pre-chemotherapy (A, B) and post-chemotherapy (C, D) maximal intensity projection (MIP) MR images. On RECIST 1.0, this case was classified into non-responder group. In contrast, this case was analyzed into the responder group on RECIST 1.1. This case turned out to be the responder in pathologic evaluation. RECIST = Response Evaluation Criteria in Solid Tumor
|
 | Fig. 250-year-old woman with invasive ductal carcinoma in right breast underwent four times neoadjuvant chemotherapy (AT-Doxorubicin [adriamycin]-taxotere [Docetaxel] combination therapy).
Huge main mass and metastatic axillary lymph node were present on both pre-chemotherapy (A) and post-chemotherapy (B) maximal intensity projection (MIP) MR images. Both RECIST 1.0 and RECITST 1.1 classified this patient into responder group. In addition, this case was confirmed as responder in pathologic evaluation. RECIST = Response Evaluation Criteria in Solid Tumor
|
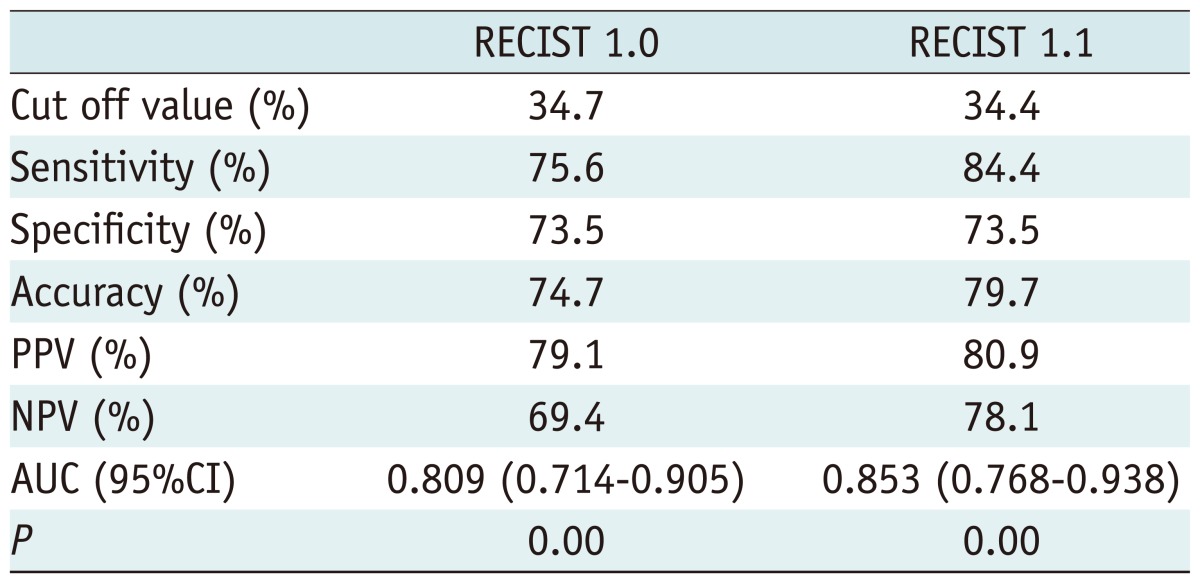
The AUC was 0.809 for RECIST 1.0 and 0.853 for RECIST 1.1. The sensitivity, specificity and accuracy of RECIST 1.0 were 75.6%, 73.5% and 74.7%, respectively, when the cutoff value of 34.7% was used. The sensitivity, specificity and accuracy of RECIST 1.1 were 84.4%, 73.5% and 79.7%, respectively, when a cutoff value of 34.4% was used. Although the cutoff value of RECIST 1.1 was closer to 30% as our criteria of this study, no statistical significance was present. The 95% CI was 0.714 - 0.905 for RECIST 1.0 and 0.768 - 0.938 for RECIST 1.1. There was no statistical difference in AUCs between RECIST 1.0 and RECIST 1.1.
We also compared the correlation between the longest diameters of tumors measured on the post-chemotherapy MRI and those of the pathologic specimens, and they were correlated with high statistical significance (p = 0.000). Tumor diameter on post-chemotherapy MRI showed a strongly positive linear correlation with the pathologic tumor diameter as assessed by both the RECIST 1.0 and RECIST 1.1 criteria. The Pearson's correlation coefficient (r) was 0.787 for RECIST 1.0 (p = 0.00) and 0.791 for RECIST 1.1 (p = 0.00).
Go to :
DISCUSSION
Because the rate of metastatic dissemination is correlated with the stage of the primary tumor and the involved lymph nodes, the survival rates remain poor for patients with advanced-stage breast cancer (7). For patients with locally advanced breast cancer, defined by the 2002 TNM classification of the American Joint Committee on Cancer as stages IIB, IIIA and IIIB, treatment usually starts with NAC. Chemotherapy is typically followed by surgery and postoperative chemotherapy (4). Despite associated toxicities and increased economic burden, NAC can downstage breast cancers and eliminate micrometastases. NAC can therefore affect the overall survival rate, and it is clinically important to assess the response to NAC in order to plan further treatment (1-8).
Clinical trials of cancer therapy use both tumor shrinkage and the time to disease progression as endpoints. Assessment of the change in tumor burden is therefore important for the clinical evaluation of cancer therapy. Currently, surrogate endpoints, based on radiological measurement, are increasingly being used to assess tumor response to therapy. The WHO criteria, published in 1981, were the first tumor response criteria. These criteria have been widely used for several decades (11-14). The WHO criteria use bi-dimensional lesion measurements and were the first to use the concept of assessing tumor burden by summing the lesions' measurements and determining a response by comparing any changes with the baseline study. These criteria also introduced the four current tumor response definitions: CR; PR; PD; and SD. Because the WHO criteria have been used with modifications in many studies, different conclusions have been reached due to the variable application of these response criteria.
In 2000, new criteria, called the RECIST (version 1.0), were published (12-14). Since then, the RECIST criteria have largely replaced the WHO criteria. RECIST 1.0 presented recommendations for the minimum size of measurable lesions, determination of the number of target lesions (up to ten lesions; a maximum of five lesions per organ site) among the measurable lesions, and the use of unidimensional measurements. Although RECIST 1.0 also recommended restricted evaluations of non-measurable lesions, the presence or absence of non-measurable lesions should be noted for the determination of PD. Since the RECIST criteria have increasingly replaced the WHO criteria, the RECIST criteria have been criticized regarding a number of issues, including the total number of lesions to be assessed, lymph node assessment, the utility of new imaging techniques (FDG-PET or MRI) and the use of RECIST in trials of targeted, non-cytotoxic drugs (15-17).
The revised RECIST criteria (version 1.1) were introduced in 2009. The revised criteria include key changes, such as the number of lesions measured, assessment of pathologic lymph nodes, minimal diameter criteria for disease progression, application of FDG-PET imaging, and the fact that comments on new lesions can be included in the target lesions. At first, RECIST 1.1 reduced the target lesion number from ten to five (from a maximum of five lesions per organ site to two lesions per organ site) (15, 16). Several studies have suggested that assessments of three or five lesions are not related to the overall response rate or progression-free survival. Additionally, statistical simulations model have shown that there is little apparent difference between the response assessment based on the five lesions compared with that of the assessment of ten lesions (17, 20, 21). In general, RECIST 1.1 showed better diagnostic performance in our study. In the cases with large mass with small lymph nodes, the diagnostic performance of these two set of criteria was little different. But in the cases with small mass with large metastatic lymph nodes, RECIST 1.1 showed better diagnostic performance. Also, we suppose the statistical significance be present because the number of cases, which had the small mass with large metastatic lymph nodes, was small. We thought this means that the reduced number of target lesions has not significantly affected the efficiency of the measurement of tumor burden on our study, and that assessing fewer lesions may be more convenient to assess the overall disease burden in a clinical setting.
Lymph node involvement determines cancer staging. Nodal stage also affects the patient survival rate and the time interval to development of distant metastasis (4, 7, 22, 23). Therefore, an evaluation of the lymph node stage is important to precisely assess the cancer burden and to correlate the tumor burden with the tumor stage. RECIST 1.1 also added the assessment of pathologically enlarged lymph nodes, as target or non-target lesions with a threshold of 10 mm. If the short axis of a lymph node was less than 10 mm, then it was considered to be non-pathologic (15-17, 22). Several assessment methods for lymph nodes are used, including size, a fatty hilum, shape or calcification. However, size criteria are mainly used to detect malignant lymph nodes, although different studies have reported variable sensitivity and specificity of lymph node enlargement on CT scans (22). Several studies have reported that the short axis of a lymph node may be less sensitive to the node's spatial orientation than the long axis and that the short axis is the most reproducible and optimal predictor of malignancy (22, 23). Schwartz et al. (22) compared RECIST 1.0 with RECIST 1.1, but assessed only the lymph nodes. The results showed a shift to a CR on RECIST 1.1 from a PR on RECIST 1.0, as well as a shift to PR on RECIST 1.1 from SD on RECIST 1.0. In our study, which used both mass lesions and lymph nodes, there was no statistically significant difference the in diagnostic performance between RECIST 1.0 and RECIST 1.1.
Other modifications were made to the RECIST 1.1 criteria. To avoid false assessment of a response, if the target lesion was still visible, but too small to measure on the follow-up images, then the size of the lesion was assumed to be 5 mm. PD required at least a 5 mm net increase in the total diameter. RECIST 1.1 also includes measurements of lesions that were considered to be non-measurable in RECIST 1.0, including cystic lesions, bony lesions and lesions in the site of previous radiation therapy. In addition, RECIST 1.1 introduced FDG-PET imaging in the assessment of PD. Because the RECIST criteria are based on anatomical measurements, the criteria for including FDG-PET imaging to assess tumor response are not currently available (14-17). However, several approaches are currently being researched for the metabolic assessment of tumor response by FDG-PET imaging, such as the PET Response Criteria in Solid Tumors and PET-CT (4, 5, 14, 16). Additional incorporation of PET-CT imaging into the tumor response criteria, reflecting the metabolic and anatomical evaluation of a tumor response, and volumetric/3-dimensional measurement may be considered in the future (8, 14-17).
In conclusion, although the difference was not statistically significant, the response assessments based on the RECIST 1.1 criteria, which revised RECIST 1.0 to simplify, optimize and objectify the original criteria, were slightly more likely to have a pathologically verified tumor response than those based on the RECIST 1.0 criteria. In addition, the correlation between tumor diameter on post-chemotherapy MRI and pathologic diameter suggests that MRI may be a valuable method for assessing chemotherapeutic response in breast cancer patients.
Go to :
 XML Download