

 PDF
PDF ePub
ePub Citation
 Print
Print


INTRODUCTION
Pediatric radiography is a challenging procedure from the perspective of image quality and radiation dosage. Firstly, pediatric images inherently have relatively low contrast. Secondly, it is well-known that the dose of radiation is an extremely important issue in children, who are significantly more radiosensitive and more likely to manifest radiation-induced changes over their lifetimes. Children are approximately ten times more sensitive to radiation-induced cancer than middle-aged adults and three times more sensitive than the population average (1).
Over recent decades, a shift has taken place in digital radiography (DR). The radiation dose given to patients should be as low as is reasonably achievable (ALARA), while still providing an image quality that is adequate to enable an accurate diagnosis (2, 3). The reduction of the radiation dose according to the ALARA principle requires not only selecting the most appropriate X-ray technology, but also optimizing the whole imaging procedure through the selection of optimal imaging parameters.
To date, however, most data has been obtained from phantom studies (4-8), and only a few reports are available that describe a clinical pediatric experience (9-11). DR has been shown to provide good resolution with no significant difference in diagnostic quality at reduced radiation doses (12, 13). Volk's study suggested that dose reduction of approximately 50-75% had no significant impact on image quality (14). However, a more efficient detector on its own is not sufficient to ensure a consistent low-dose operation in routine clinical practice. Hence, the purpose of our study was to assess optimized radiation dosages and image quality by altering the tube voltage settings for digital chest radiography in a large cohort of children, subdivided according to age.
MATERIALS AND METHODS
A large sample of patients was collected for this triple blinded, randomized controlled trial, which was approved by the local institutional review board (ethics approval No.: 2007-X2-02). In this study, patients or guardians provided written informed consent. The study was successfully registered in the Chinese clinical trials registry (registration number: ChiCTR-DT-00000026).
Study Population
All subjects gave their informed consent after receiving a full explanation regarding the nature of the study. The inclusion criteria were as follows: 1) patients were aged from birth to 14 years old, 2) written informed consent was obtained, and 3) anteroposterior (AP) or posteroanterior chest imaging was performed. The exclusion criteria were as follows: 1) the patient withdrew from the study after submitting the written informed consent; 2) written informed consent could not be obtained; or 3) DR examinations of other types were performed.
This prospective study was conducted at the Medical Imaging Research Center of the First Affiliated Hospital of the Xinjiang Medical University. Between January 2008 and October 2010, 4500 pediatric patients underwent DR chest imaging at our institution. Pediatric patients were arbitrarily categorized into the following five age groups: 0-1 year (yr), 1-3 yr, 3-7 yr, 7-11 yr and 11-14 yr. Sixty-seven patients were excluded, thus the study was conducted with pediatric radiographs from 4433 cases.
Study Design
Details regarding the study design are shown in Figure 1. Children were randomly divided into four groups: A) lower kilovoltage potential (kVp) group, B) intermediate kVp group, and C) higher kVp group, and the fixed high kVp group (controls). Following the guidance of the European Commission reference for tube voltage in pediatric imaging (15) and the work by Yakoumakis et al. (16), we designed protocol A to be 50 kV, 55 kV, 60 kV, 70 kV and 80 kV in the five age groups (0-1 yr, 1-3 yr, 3-7 yr, 7-11 yr and 11-14 yr, respectively). Protocol B was 60 kV, 65 kV, 70 kV, 80 kV and 90 kV, respectively and protocol C was 70 kV, 75 kV, 80 kV, 90 kV, and 100 kV, respectively. The controls received 102 kV, which is the routine value for adult radiography. All subjects were completely randomized into groups and their assignation was blinded to the radiologists. SPSS software was used to generate 4500 random numbers in a random sequence; these were marked A, B, C or D and the numbers were placed into individual envelopes. The test designer managed the envelopes. The Medical Imaging Research Center clinicians who collected subjects depending on the inclusion criteria were allocated into four groups according to the randomized sequence. Clinicians were responsible for recording the name and serial number of subjects. Subjects underwent DR for the corresponding tube voltage according to the group marked inside the envelope. Two assistants recorded the data. Prior to the data being statistically analyzed, patients, researchers and statisticians caught completely blinded to patient allocation.
Radiography Equipment
Two Philips Digital Diagnost TH systems (Philips, Eindhoven, the Netherlands) with direct digital image intensifiers were respectively equipped with a display for computing the dose area product (DAP). The automatic exposure control (AEC) of the flat-panel detector system was adjusted to a speed class of 400. An AEC with a center chamber was used throughout the clinical setting. Automatic exposure was utilized in every patient. The Philips flat-panel detector has a nine pixel matrix size, where each pixel is 143 µm, and the actual region detector testing area is 43 × 43 cm. The plate material of both systems was non-crystalline silicone. The two systems had moving grids, with a ratio of 1 : 8 and 1 : 12, respectively. We performed phantom weekly equipment testing and calibration for both DAP and AEC to ensure the stability of the systems.
All images displayed soft reading films, where the display was BarcoMed 5MP2 (dual), and the resolution was 4096 × 2560. The picture archiving and communication system was a new communication (Syngo, erlangen, Germany) image workstation of information management systems (Siemens Medical Systems, erlangen, Germany).
Radiation Dose Measurement
Dose area product is a product of the surface area for patients exposed to radiation at the entrance to the skin (in square centimeters or square meters) multiplied by the radiation dose at this surface in grays (17). The DAP reading was taken from the DAP meter, which was mounted on the tube collimator. A corresponding dose index that could be correlated with field size was the DAP.
Image Evaluation
Five readers having 3-20 yrs of experience in chest radiology independently evaluated all the images. Two of the readers had 3 yrs of radiology experience while the remaining three readers had 8, 10, and 20 yrs of experience, respectively. They were blinded to the observer with which the images were obtained. The time for reading the images was not limited, and each observer was allowed to select window levels and window widths on the monitor screen. Before the tests, the radiologists were trained with five representative cases that did not belong to the observational study.
Clinical image quality was assessed by five radiologists using a visual grading analysis score (VGAS) technique based on the revised Commission of European Communities imaging criteria (18). The quality of the exposure criteria included: A) position and symmetry of the scapula and sternoclavicular joint: a. sternoclavicular joint symmetry; b. scapulas spin out; B) lung fields: a. within the zone; b. in the zone; c. take-away; C) Trachea shows: a. pipe; b. carina; c. left main bronchus; d. right main bronchus; e. segmental bronchus; D) mediastinum, a: between one and four thoracic vertebrae; b: most thoracic vertebrae; c: all thoracic vertebrae; d: sections of the aorta; e: right cardiac border; f: left cardiac border; E) ribs: a. bone cortex; b. trabecular bone; and F) chest wall: a. soft tissue; b. fat line; c. breast tissue. For parameters A-F, one point was given if each point was shown, and 0 points were given if they were not displayed. Parameter G represented noise, and noise was usually defined as the visibility of an image by CCD/CMOS or digital signal system made of the errors information. Noise was rated as follows: a: free of noise (3 points); b. scarce noise (2 points); c. significant noise, but did not affect diagnosis (1 point); d: obvious noise, no diagnosis possible (0 point). 0 point signifies significant noise and no display of indicators from A to F, and 24 points means no noise and display of all indicators from A to F. Image evaluation was therefore rated as excellent with a composite score of 18-24 points, good with a score of 14-17 points, moderate with 10-13 points, and poor if the image had less than 10 points.
Statistical Analysis
The mean values for DAP and VGAS of four groups were compared with one-way analysis of variance (ANOVA). Differences with p < 0.05 were considered statistically significant. When the overall differences were statistically significant, post hoc analysis was performed with the least significant difference (LSD) method. We used the mean DAP and VGAS obtained in control subjects as the control for the LSD method and compared them with protocols A, B and C. The mean DAP and VGAS of all age groups were then compared with the LSD method. These data were normally distributed. All statistical calculations were performed using Statistical Package for the Social Sciences (SPSS) software (version 17.00) for Windows (SPSS, IL, Chicago, USA).
RESULTS
Radiation Dose
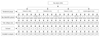
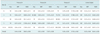
The mean DAP values for each tube voltage group were shown in Table 1. Using one-way ANOVA, the mean DAP in the age subgroups was statistically significant (F = 11.4, p < 0.001). The mean DAP for protocol A was significantly higher than the controls (p < 0.001), and it was not statistically significantly different between protocol B and the controls (p = 0.75). Differences in the pair-wise comparisons indicated that the radiation dose of protocol C was the lowest in four groups; and the reduction of the radiation dose was approximately 18.75% compared with the controls. Thus, the overall difference of the mean DAP across the four groups was statistically significant (F = 44.4, p < 0.001). Also, there were significant differences between the mean DAP in patients aged 1-3 years and those in the other age groups (p ≤ 0.002 for all), indicating that the radiation dose in children aged 1-3 years was higher than other ages (Table 2).
Image Quality
The mean VGAS for each group is shown in Table 1. Using one-way ANOVA, the overall difference of the mean VGAS between the four groups was statistically significant (F = 32.7, p < 0.001). The mean VGAS was not significantly different between the five age groups (F = 1.872, p = 0.180). The mean VGAS was significantly lower for the controls than protocols A, B and C (p < 0.001 for all), indicating that the image quality for all three protocols surpassed the standard adult radiation dose. Further, there was no significant difference between the mean VGAS of protocol A and protocol B (p = 0.334). The image quality was lower in protocol C than in protocol A (p = 0.008) and protocol B (p = 0.049) (Table 2).
DISCUSSION
This study demonstrated that the optimization of tube voltages for digital chest radiography in children, in accordance with the ALARA principle, had lower radiation doses and better diagnostic image quality. Protocol C (higher kVp) gave the lowest radiation dose. That being said, clinical research is necessary to fully exploit the potential of DR systems for dose reduction in pediatric examinations. Lower kVp settings are often used in DR in order to achieve the optimal contrast-to-noise ratio and increase tissue contrast. Potential advantages include the increased contrast for not only pathologies, but also for soft tissue compared to bones.
Pediatric imaging techniques vary greatly due to the extremely large differences in patient size and weight. Therefore, different parameter settings may be necessary to gain optimal results for the same anatomical regions, according to the child's age. However, pediatric disease states can mimic radiographic noise, so optimal and consistent image acquisition processes are essential in order to distinguish physical disease from poor image quality. Pediatric images inherently have relatively low contrast. Thus, lower kVp settings are often used in DR in order to achieve the optimal contrast-to-noise ratio and increase tissue contrast. The results of previous studies (2, 7, 19) have suggested better image contrast or an improved signal-to-noise ratio for images. At identical effective radiation doses for patients, low kVp settings have been found to increase the signal-to-noise ratio and significantly increase image quality.
Previous investigators have suggested that tube potential should be increased (20) or decreased (9, 21-23) in order to reduce the radiation dose to the patient. Clinical evaluations (24, 25) using the visibility of anatomical structures revealed that flat-panel detectors can produce images that were of equal or superior quality at 50% of the radiation dose compared to screen-film (SF) systems. Other studies (4-6, 10, 26) indicated the possibility that by decreasing tube voltage, image quality could be improved. In this study, the clinical radiation dose is measured with DAP, which has become increasingly used as it provides a convenient and accurate method for measuring the dose radiation (1, 19). Sæther et al. (10) studied the comparable data regarding age-related DAP from thoracic and pelvic radiological examinations of children where two sets of DR systems was used as an input to estimate diagnostic reference levels. The present study only used a single type of DR system. Billinger et al. (27) reported DAP values for chest, skull and abdominal X-ray procedures in neonates and children aged 1 yr, 5 yr, 10 yr and 15 yr.
There were limitations to our study. Firstly, the present study did not evaluate the image quality for different chest pediatric diseases. Secondly, we only performed a subset analysis of our cohort based on patient age, and excluded any possible effects that might be present as a result of sex and body mass index when evaluating radiation dose protocols.

 XML Download