

 PDF
PDF ePub
ePub Citation
 Print
Print


INTRODUCTION
Dynamic contrast enhanced magnetic resonance imaging (DCE-MRI) has shown its potential in improving the differentiation of benign from malignant musculoskeletal tumors (1-4). It has also been shown to improve differentiation in the prediction of malignancy, when compared with nonenhanced magnetic resonance imaging (MRI) parameters, combined with static contrast-enhanced MRI (3). Unlike static contrast-enhanced MRI, DCE-MRI samples MR signal intensity (SI) values at many time points after contrast media injection, offering information not only what areas show enhancement, but how those areas show enhancement, according to time. These enhancement changes represent information about tissue vascularity and perfusion (2). Pathological angiogenesis is a hallmark of cancer, and will affect these parameters (5).
Unfortunately, not only are there considerable differences in the DCE-MRI protocols used in the published literature, but the parameters used for evaluating the musculoskeletal tumors vary significantly from study to study. Due to the large amount of dynamic data, mostly time-SI curves and semiquantitative parameters have been used for analyzing and differentiating benign from that of malignant tumors. In the breast washout, seen on time-SI curves, are important for differentiating benign from malignant lesions. Therefore, DCE-MRI protocols in the breast should be sufficiently long enough to evaluate the washout (6). However, it is not clear whether washout is as important in the evaluation of the musculoskeletal tumors, and whether relatively shorter length protocols would be sufficient (3, 4). Also, the temporal resolution of DCE-MRI in the literature varies from 1.5 to 30 seconds (4, 7), and will affect the values and calculations used in semiquantitative parameters for evaluating the benign and malignant tumors.
In our study, time-signal curves and multiple semiquantitive parameters are evaluated for differentiating benign from malignant soft tissue tumors. They are compared with previously published results and protocols.
MATERIALS AND METHODS
Patients and MR Imaging
Consecutive patients between June of 2009 and March of 2010, who underwent routine MR imaging, including DCE-MRI at 3.0T (Magnetom Verio, Siemens Medical Solution, Erlangen, Germany) and had pathologically confirmed soft tissue tumors, were included in this study. Patients without DCE-MRI or pathological confirmation of tumors were excluded from the study. Thirteen patients (median age, 43 years; range 19-86 years, 8 male, 5 female) met the criteria.
Dynamic contrast-enhanced magnetic resonance imaging is part of our routine sequence for musculoskeletal tumor evaluation at our institution, and institutional review board approved this retrospective study and waived the requirement of informed consent.
Standard nonenhanced MRI sequences included axial turbo spin echo T1, T2, and fat suppressed T2-weighted images in all patients, with at least one T2 or fat suppresses T2-weighted longitudinal scan. Using these images, one of the authors selected three planes and locations that showed the tumor at best advantage for dynamic imaging. For dynamic imaging, a 2D fast low angle shot gradient echo sequence was obtained, at these three selected planes. The following dynamic imaging parameters were used: flip angle 8 degrees, preparatory pulse delay 178 ms, slice thickness 10 mm, repetition time 333 ms, echo time 1.31 ms, one signal acquired, matrix 192 × 109, bandwidth 770 Hz/Px, and pause of measurements 0 ms. This resulted in a temporal resolution of 1 second. A total of 300 sections in each selected plane were obtained for a total of 900 dynamic images, during 5 minutes. 0.1 mmol per kilogram of body weight gadopentetate dimeglumine (Magnevist, Schering, Berlin, Germany) was injected, at a rate of 2 mL/sec, using an automatic injector (Spectris Solaris EP MR Injection System, Medrad, Volkach, Germany), followed by a 20 mL saline flush. The onset for contrast injection and data acquisition were triggered, simultaneously.
Image Analysis
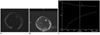
Subtraction images of dynamic contrast enhanced images at 1 minute subtracted by nonenhanced images (S1-0 min), dynamic images at 2 minutes subtracted by nonenhanced images (S2-0 min), dynamic images at 5 minutes subtracted by nonenhanced images (S5-0 min), and dynamic images at 2 minutes subtracted by 5 minutes images (S2-5 min) were created using the workstation. S2-5 min subtraction images were used to represent the washout. When the artifacts were noted in the first dynamic image, the second dynamic image was used to represent the nonenhanced images. Using these images, two authors in concordance selected a region of interest (ROI) in one of the three planes of the dynamic images, which showed the most prominent early enhancement or washout in the tumors. An ROI was drawn on the first dynamic image, using a freehand tool or elliptical tool using a commercial workstation (Leonardo MR Workplace; Siemens Medical Solution, Erlangen, Germany), in addition, an ROI was drawn in an artery within the same field of view. ROI areas for the tumors and arteries were between 20-200 mm2 and between 1-30 mm2, respectively. The ROIs were propagated, automatically, to all subsequent dynamic images. Time-SI curves were drawn, using the workstation, and raw numerical data were exported for external processing through custom built software.
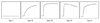
The progression of tumor enhancement was subjectively evaluated, according to the shape of the time-SI curve: type I, no enhancement; type II, gradual increase of enhancement; type III, rapid early enhancement followed by plateau phase; type IV, rapid early enhancement followed by washout; and type V, rapid early enhancement followed by sustained delayed enhancement (Fig. 1) (3). The enhancement pattern on subtraction images was subjectively evaluated as diffuse, peripheral, or absent. Subjective analysis was performed by the two authors in concordance.
A custom computer program was developed, and the average SI values of the above-defined ROIs were imported and analyzed. The following enhancement parameters were calculated: maximal relative enhancement at the first (maximal peak enhancement [Emax]/1) and second (Emax/2) minute, Emax, steepest slope calculated using various time intervals (5, 30, 60 seconds), and start of dynamic enhancement (time interval between start of arterial and tumor enhancement). Emax/1, Emax/2, and Emax were defined as the relative percentage of increase in SI, compared with that of nonenhanced SI, which reached within the first minute, reached in second minute, and reached in full study time, respectively. Emax/1 was calculated using the following formula, where SImax1 is the highest SI reached within the first minute and SIpre is the nonenhanced SI:
Emax/2 and Emax were calculated using a similar formula. The steepest slope of the enhancement curve was calculated by the following formula, using time intervals of 5, 30, and 60 seconds, where SIend and SIprev are the SI values that differed most on the dynamic enhancement curve with Tend and Tprev, corresponding to the time points of SIend and SIprev, respectively:
Three steepest slope values were calculated using Tend - Tprev values of 5, 30, and 60 seconds. Start of dynamic enhancement was calculated, using the following formula:
Start of lesion enhancement and arterial enhancement was defined as the start of time that the next four consecutive SIs showed an increase in over 15% of SI compared to SIpre. This ensured that small changes, due to noise and artifacts showing a transient change of over 15% in SI, would not affect the study. All values were visually checked with corresponding time-SI curve data and raw data numbers to ensure that the artifacts did not significantly impact the values.
Statistical Analysis
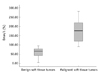
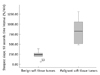
Dynamic contrast-enhanced magnetic resonance imaging parameters were grouped into benign and malignant soft tissue tumor groups, and analyzed using a descriptive analysis, including mean, median, and lower and upper quartiles. These descriptive parameters were used to draw box plots, showing benign and malignant group parameters, side-by-side. The box plot whiskers represented the highest and lowest values that are not outliers or extreme values. The outliers (values that are between 1.5 and 3 times the interquartile range) and extreme values (values that are more than 3 times the interquartile range) are represented by circles beyond the whiskers.
The differences of DCE-MRI parameters between benign and malignant tumor groups were analyzed with nonparametric tests. The Mann-Whitney U-test was used to check for statistically significant difference between the benign and malignant group parameters, and a p value of less than 0.05 was used to indicate significant difference. A receiver operating characteristic curve analysis and area under the curve (AUC) comparison was also performed.
RESULTS
Tumors were diagnosed as 7 benign tumors and 6 malignant soft tissue tumors. Benign soft tissue tumors (n = 7) were pathologically confirmed as hemangioma (n = 2), neurilemmoma (n = 2), myxoma (n = 1), parachordoma (n = 1), and elastofibroma (n = 1). Malignant soft tissues tumors (n = 6) were metastasis (n = 1), malignant fibrous histiocytoma (n = 1), multiple myeloma (n = 1), fibrosarcoma (n = 1), lymphoma (n = 1), and leiomyosarcoma (n = 1).
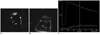
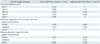
Table 1 shows the time-SI curve shapes and patterns of enhancement on subtraction images. Type IV time-SI curve was noted in 1 case (14%) of benign tumor and were noted in 3 cases (50%) of malignant tumors. These tumors with a type IV curve all showed a washout on S2-5 min subtraction images (Fig. 4). All the other tumors did not show washout on S2-5 min subtraction images (Fig. 5). Three benign cases (43%) and 4 malignant cases (67%) showed a diffuse pattern of enhancement on subtraction images. Four benign cases (57%) and 2 malignant cases (33%) showed a peripheral pattern of enhancement on subtraction images (Table 1).
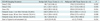
The mean, standard deviation, and p value of Emax/1, Emax/2, Emax, steepest slope, and start of dynamic enhancement grouped by benign and malignant soft tissue groups are shown in Table 2. Emax/1, Emax/2, Emax, and steepest slope, calculated using 5 seconds and 30 seconds time intervals, showed a significant difference between the two groups (Figs. 2, 3). All of the steepest slope values occurred within 2 minutes of the dynamic study. All the cases showing washout and type IV curves, in the malignant group, produced the high steepest slope, calculated using 5 seconds time intervals and a high Emax/1. AUC for the steepest slope calculated, using 5 seconds, showed a significant difference (p < 0.001) with Emax/1 and Emax/2. AUC for Emax/1 was greater than AUC for Emax/2, but did not show a significant difference. The steepest slope calculated, using 5 seconds time intervals, was the most discriminating factor with all the benign and malignant tumor groups being separated by a cutoff value of 434.0%/min. Emax/1 and Emax/2 both showed a sensitivity and specificity of 100% and 85.7%, when using a cutoff value of 93.6%/min and 128.2%/min, respectively. The steepest slope calculated using 30 seconds and Emax, both showed significant differences between benign and malignant tumors, but with a larger overlap between the tumors. Start of dynamic enhancement did not show a significant difference, but no malignant tumor showed a value greater than 14 seconds.
DISCUSSION
Dynamic contrast-enhanced magnetic resonance parameters appear to be helpful in discriminating benign from malignant soft tissue tumors in this study. Of the several DCE-MRI parameters, the steepest slope calculated using 5 seconds time intervals was the most discriminating DCE-MRI parameter in our study, with Emax/1 and Emax/2 also showing a significant difference (Figs. 2, 3).
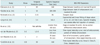
Using a 3.0 T MRI allowed our protocols to use the shortest temporal resolution in the published literature for DCE-MRI evaluation of musculoskeletal tumors. We used this short temporal resolution to calculate the various steepest slopes, and to compare them with the prior literature (Table 3). The advantages of a short temporal resolution appear to be mostly related to the increased sensitivity of the steepest slope parameters, while the main disadvantage would be that an increased imaging time is needed. Studies with a long temporal resolution showed a decreased sensitivity for the steepest slope parameters (2, 4). In the breast, short temporal resolution protocols do not seem necessary, but the results in our study suggest that short temporal resolution protocols are needed to use parameters, such as the steepest slope for discriminating benign and malignant musculoskeletal tumors (4, 8, 9). When using longer temporal resolution protocols, parameters, such as Emax/1 or Emax/2, are more helpful. When considering our results with that of the prior published studies, suggesting that the steepest slope and Emax/1 are helpful in making a distinction between benign and malignant tumors, it can be suggested that early enhancement within the first two minutes is a very important parameter (2, 3, 7, 10). These findings suggest that a shorter DCE-MRI protocol of about 2 or 3 minutes may be sufficient in the evaluation of the musculoskeletal tumors, especially considering that the type IV curves and washout, which require more lengthy protocols, appear to be of less diagnostic significance.
We used the same classification that van Rijswijk et al. (3) used for the time-SI curves (Fig. 1). van der Woude et al. (7) used a different classification using 3 types, where the type III and type IV curves in our study were combined into a single type. Since type IV curves are needed to evaluate the washout and have been shown to suggest malignancy in the breast, we opted to classify it separately (3, 6). In the study by van Rijswijk et al. (3) type IV curves were seen in 16% of the benign tumors and 23% of the malignant tumors, which showed a significant overlap. In our study, only one case of benign tumor showed a type IV curve, which is probably due to the small number of cases, but still both benign and malignant tumors showed type IV curves in our study, too. Subtraction images to visualize the washout, such as S2-5 min subtraction images used in our study, were not mentioned in the prior musculoskeletal DCE-MRI studies. However, as all cases with washout and type IV curves depicted the washout on S2-5 min subtraction images, they appear helpful for assessing the presence of a washout in tumors and placement of ROIs. During our study, we had initially missed a case with a type IV curve in the benign tumor group, but after reassessing S2-5 min subtraction images and placing the ROI appropriately, a type IV curve was noted. Since all the malignant tumors with type IV curves and washout, in our study, produced a high steepest slope calculated using 5 seconds time intervals and also a high Emax/1 and Emax/2, washout does not appear to have a significant additional value for diagnosis. In the previous study, peripheral enhancement, in soft tissue tumors, signified a more malignant nature, which was not as definite in our study (3, 7).
The DCE-MRI parameters and protocols, especially the number of slices obtained, temporal resolution, and dynamic sequence time significantly varied between the prior musculoskeletal studies (Table 3). When similar DCE-MRI parameters were used, such as slope, the calculation methods varied significantly (1, 2, 4, 11-13). The amount of contrast and start of dynamic enhancement also varied between the studies (1-4, 7, 10-14). As it can be noted by the results in our study, which uses various time intervals for calculating steepest slope, short temporal resolution is important for the calculation of more clinically significant steepest slopes. This is thought to be the cause of the difference in our results, and a study by Tuncbilek et al. (4) which used 30 seconds time interval DCE-MRI and showed Emax/1 to be more discriminating than the steepest slope, but their study also showed a favorable, but less significant, results in using the steepest slope to differentiate benign from malignant tumors. For calculating the steepest slope, we believe that our method is easier for applying in practice than several other calculation methods in the literature (1, 11-13).
In the previous literature, start of dynamic enhancement was assessed, subjectively, with an arbitrary threshold of 6 seconds, and showed some potential differences in benign and malignant tumors (3, 7). However, in our study, we used a more objective method and calculated the start of dynamic enhancement and found more overlap in the values, compared to the prior mentioned DCE-MRI parameters. No malignant tumor showed a value of greater than 14 seconds, suggesting that when the value is large, a benign tumor can be suggested. A temporal resolution of 1-3 second has been recommended when using the start of a dynamic enhancement as a DCE-MRI parameter (7).
The results of our study suggest that short length DCE-MRI protocols of about 2 to 3 minute length may be sufficient for the evaluation of the musculoskeletal tumors. Temporal resolution appears to have a very important effect on DCE-MRI evaluation parameters with the steepest slope being the most effective, with a short about 5 seconds temporal resolution. When using a longer than 10 seconds temporal resolution, dynamic evaluation parameters, such as Emax/1 or Emax/2, have an increased diagnostic yield than that of the steepest slope. When the start of dynamic enhancement is delayed for more than 14 seconds, a benign tumor can be suggested, while a fast start of dynamic enhancement can depict both benign and malignant tumors.
It is the aim of DCE-MRI to enhance the preoperative and prebiopsy diagnostic accuracy of soft tissue tumor evaluation. In a patient with borderline imaging findings, who strongly wishes to avoid biopsy, DCE-MRI may be helpful in determining the next step of patient management. However, DCE-MRI still has many limitations and should be used as an additional diagnostic tool that cannot yet replace a standard MR imaging or biopsy.
The limitations of our study include the following: a small number study cases which may not adequately represent the wide range of benign and malignant soft tissue tumors and the retrospective nature of the study. Tumors without pathological confirmation were not included in our study, which also would affect our results. We used 3 slice planes to evaluate the tumors, and due to the heterogeneity of tumors, it is possible that portions of the tumor that show other specific findings on DCE-MRI may have been missed. ROI areas are dependent on the operator and results may vary depending on the experience of radiologists with additional inter/intraobserver bias. Also, it is not clear whether it is appropriate to include vascular tumors, such as hemangiomas in the benign tumor group. Further research using various parametric imaging techniques that are less reliant on ROI areas and 3D sequences covering the whole tumor may overcome these deficiencies, while further correlation with quantitative pharmacokinetic DCE-MRI parameters is also warranted (15-18). Lastly, one must be careful when comparing DCE-MRI study results as dynamic MRI examinations from different measurement conditions or scanners are difficult to compare with each other (19).
Conclusions
The steepest slope and early relative enhancement has potential for differentiating benign from malignant soft tissue tumors. Short length DCE-MRI protocols may be adequate for the purpose, compared to the longer length protocols. Steepest slope parameters require a short temporal resolution, while the maximal peak enhancement parameters may be more optimal for longer temporal resolutions.
 XML Download