

 PDF
PDF ePub
ePub Citation
 Print
Print


INTRODUCTION
Liver fibrosis, a common feature of almost all causes of chronic liver disease, involves the accumulation of collagen, proteoglycans, and other macromolecules within the extracellular matrix. Ultimately, progressive hepatic fibrosis leads to cirrhosis, in which fibrous bands carve the liver parenchyma into nodules of regenerating hepatocytes. The available diagnostic tests, used in clinical practice, are not sensitive or specific enough to detect occult liver injury at early or intermediate stages (1). Liver biopsy is the standard of reference for the diagnosis and staging of liver fibrosis. However, it is an invasive procedure with possible complications. Histologic assessment of fibrosis is also an inherently subjective process, which is subject to sampling variability.
T1rho relaxation time, or spin-lattice relaxation time, in the rotating frame, stands for the time constant for transverse magnetization decay in a very weak B1 field strength, produced by a continuous wave radiofrequency (RF) pulse, called spin-lock RF pulse, which applied along the transverse magnetization. As the spin-lock field strength is much weaker than the main magnetic field strength B0, T1rho relaxation time is considered similar to the T1 relaxation time at very low B0, and is sensitive to low frequency motional processes in physiology. As a novel imaging mechanism, T1rho has been proposed for many clinical applications, involving various tissues of brain (e.g., for Alzheimer's disease and Parkinson's disease), knee (e.g., for assessment of cartilage), spine (e.g., for disc degeneration), breast (e.g., for differentiation of breast tissues), and muscle (e.g., for myositis) (2-7). With biliary duct ligation and carbon tetrachloride intoxication induced rat liver fibrosis models, recent studies showed that magnetic resonance (MR) T1rho imaging is able to detect liver fibrosis, and the degree of fibrosis is correlated with the degree of elevation of the T1rho measurements, suggesting that the liver T1rho quantification may play an important role for early detection and grading of liver fibrosis (8-10). Additionally, T1rho imaging has been applied for human liver and consistent liver T1rho measurement has been achieved for healthy volunteers at 3 Tesla (3T) with multiple spin-lock times (SLTs) (11). For traditional T1rho imaging applications, relatively stationary organs, like the brain and knee, are usually involved, so motion and scan time constraint are not critical issues. As such, multiple spin-lock times, often 5-6 SLTs, are preferable for T1rho imaging to ensure the accuracy and robustness of T1rho mapping. However, for organs like the liver, which involve substantial respiration-related motion, it will be advantageous to use fewer SLT points for the following reasons if comparable accuracy of T1rho mapping can be achieved. Firstly, patients are less likely to follow instructions precisely, and they are also less likely to have good breath-holds. As a consequence, severe respiration motion displacement may occur in T1rho-weighted images acquired at different SLTs. Secondly, if fewer SLT points are used, less time will be needed for each slice, and with the same amount of time, more slices could be acquired. In this study, we explored the feasibility of using three or two SLT points to measure liver T1rho relaxation.
Go to : 
MATERIALS AND METHODS
The study was approved by the Institutional Ethics Committee, and all the subjects provided informed signed consent. All subjects were clinically healthy with no history of liver disease or alcoholism. In total, 17 subjects took part in this study, comprising of 10 males and 7 females, with the mean age of 29.6 years (range: 20-44 years). Subjects were asked to undergo magnetic resonance imaging (MRI) two hours post standard evening meal, and/or early in the morning before having breakfast (fasting status), depending on their availability. It has been shown that there was no difference of liver T1rho value between the fasting status and post meal (11). In total, 36 examinations were performed. Six subjects were scanned once at the fasting status; six subjects were scanned once two hours post meal; three subjects were scanned twice at fasting status; and nine subjects were scanned twice two hours post meal. Eleven subjects, composed of two at fasting status and nine post meal, completed the examination twice, which allows the assessment of scan re-scan reproducibility.
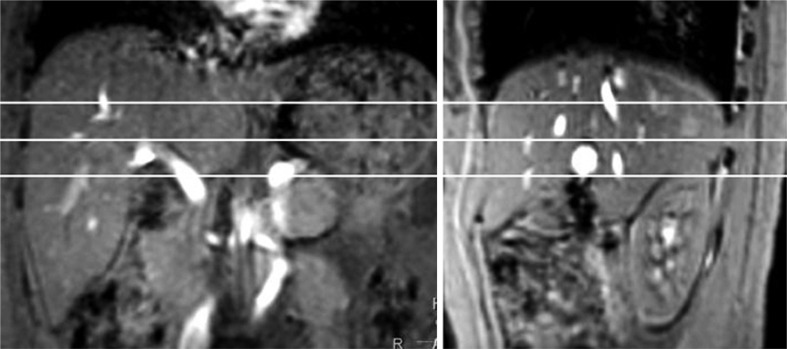
MRI data acquisition was performed on a 3T clinical scanner (Achieva, Philips Healthcare, Best, the Netherlands). An 8-channel cardiac coil was used as the signal receiver to cover the whole liver, and the built-in body coil was used as the signal transmitter. Subjects were examined in the supine position. Three representative axial slices were selected to cut through the upper, middle and lower liver for the T1rho imaging (Fig. 1). Volume shimming was employed to minimize the B0 inhomogeneity. For T1rho measurement, a rotary echo spin-lock pulse was implemented in a 2 dimensional single-shot fast field echo (FFE) sequence (12). Spin-lock frequency was set as 500 Hz, and the spin-lock times of 1 ms, 10 ms, 20 ms, 30 ms, 40 ms, and 50 ms were applied. Normal phase alternating FFE readout was used for the acquisition, and the phase encoding was in centric order. T1rho-weighted images were acquired during the transient status towards the steady-state, but with T1rho-weighted magnetization maintained (13). Time of echo and time of repetition for FFE acquisition were 1.16 ms and 2.3 ms, respectively. The FOV was 360 × 336 mm, and the matrix was 240 × 150. The apparent inplane pixel size was 1.50 × 1.50 mm3. The slice thickness was 7 mm. The flip angle was 40 degrees, and the number of signal averages was 2. A sensitivity-encoding factor of 1.5 was applied for parallel imaging to reduce the phase encoding steps, and hence, the acquisition time. The scan duration of a single spine lock time point for one slice was 38 seconds, including 30 seconds preparation time, primarily for the spin-lock pulse calibration, in which the period of time the subjects were allowed for free-breathing; and the subsequent 8 seconds for data acquisition, in which the period of time the breath was held. The whole body specific absorption rate (SAR) was smaller than 0.4 W/kg for this sequence as demonstrated on the scanner's console.
T1rho maps were computed on a pixel-by-pixel basis, using a mono-exponential decay model, implemented in a home-made Matlab program (Mathworks, Natick, MA, USA):
Where M0 and M (SLT) denote the equilibrium magnetization and T1rho-prepared magnetization with the spin lock time of SLT, respectively.
This mono-exponential equation was linearized by taking the logarithm and T1rho maps were generated by fitting all the pixel intensity data as a function of SLT time, using linear regression. T1rho was calculated as -1/slope of the straight-line fit. Maps of the coefficient of determination R2 were also generated for the evaluation of goodness of fit. Only T1rho values for the pixels satisfied with the goodness of fit to (R2 > 0.80) were included in the subsequent regions-of-interest (ROI) placement, and T1rho analysis to eliminate the unreliable poorly-fitted T1rho values due to the blood vessel contamination with fresh blood in-flow, as well as the respiration or pulsation induced artifacts.
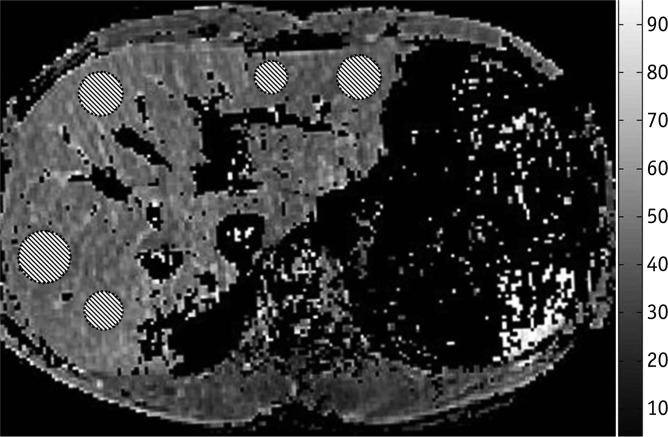
T1rho maps were constructed, using all 6 SLT points, three SLT points of 1, 20, and 50 ms, or two SLTs of 1 and 50 ms, respectively. The data were analyzed by one Radiology trainee with more than 3 years' experiences reading abdominal MRIs. To quantify liver T1rho value, five ROIs of approximately 100-200 mm2 were manually placed on liver parenchyma region of each slice's T1rho maps, with R2 > 0.80, excluding the observable artifacts and blood vessels (Fig. 2), leading to a total of 15 ROIs from each liver examination. The mean value of these 15 ROIs was regarded as the liver T1rho value for the subject.
Agreement of liver T1rho measurements, using different SLT points was assessed, using intra-class correlation coefficient (ICC) on an absolute agreement, as well as Bland and Altman plot. Scan-rescan reproducibility was also assessed with ICC. According to Fleiss (14), ICC values > 0.75 represent a good agreement, and values between 0.4 and 0.75 represent fair to moderate agreement. Paired comparison was carried out using a Student's t test. Statistical analyses were done using SPSS 14.0 (Chicago, IL, USA). A p value < 0.05 was considered statistically significant.
Go to :
RESULTS
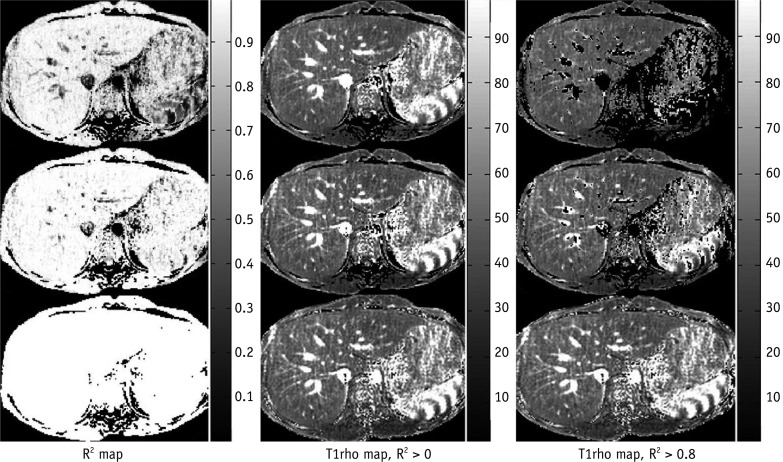
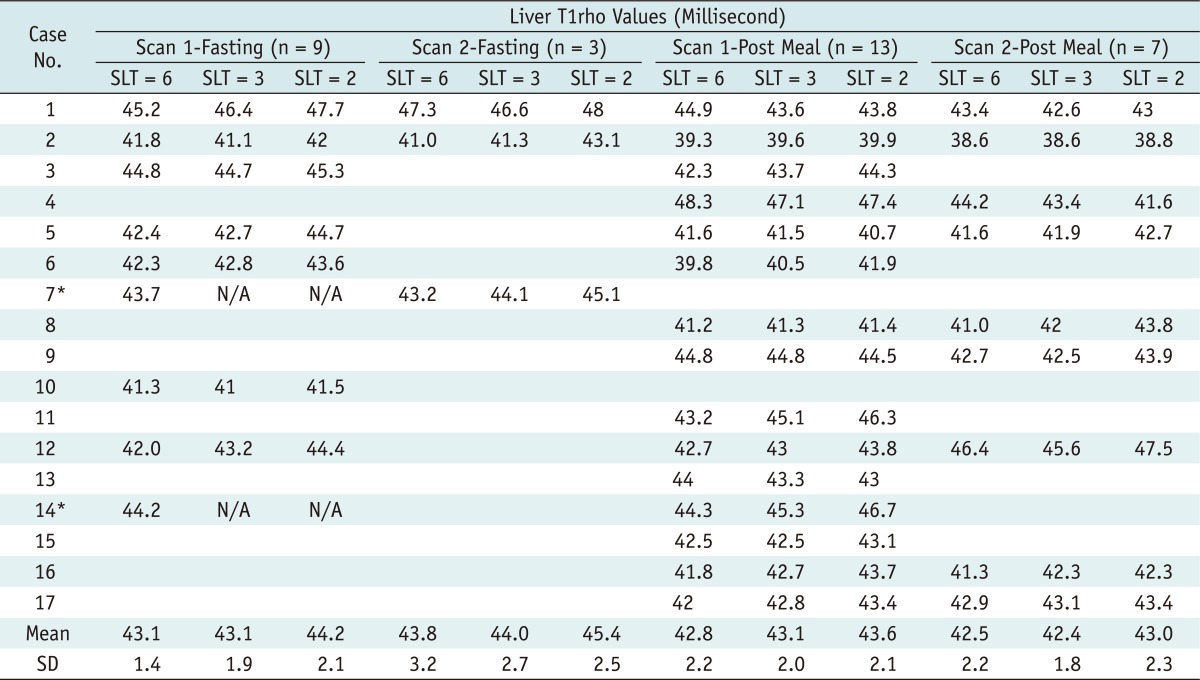
The liver T1rho values of these 36 examinations measured from T1rho maps constructed using six, three, or two SLT points are listed in Table 1. One typical case with T1rho maps constructed using six, three, or two SLT points is shown in Figure 3. Out of the 36 examinations, with two examinations (i.e. case 7 fasting status and case 14 fasting status) the liver T1rho maps of 3 SLTs and 2 SLTs were not constructed, due to severe bulk motion artifact at the SLT of 50 ms, and therefore, excluded for analysis.
 | Fig. 3
Example of one healthy volunteer's T1rho maps constructed with 6 SLTs, 3 SLTs or 2 SLTs. Left column: coefficient of determination (R2) maps, middle column: T1rho maps without R2 evaluation, right column: T1rho maps with R2 > 0.8 evaluation. Upper row: maps constructed with 6 SLTs, middle row: maps constructed with 3 SLTs, lower row: maps constructed with 2 SLTs. As SLT point decreases, R2 evaluation is less efficient to remove blood vessel contamination and artifact. Note that R2 is always equal to one, when SLT point = 2, so no pixels are excluded by criteria of R2 > 0.8. However, this does not seem to affect regions of interest placement, according to results in Table 1. Radiology trainee was able to identify and avoid regions with artifacts and blood vessels. SLT = spin-lock time
|
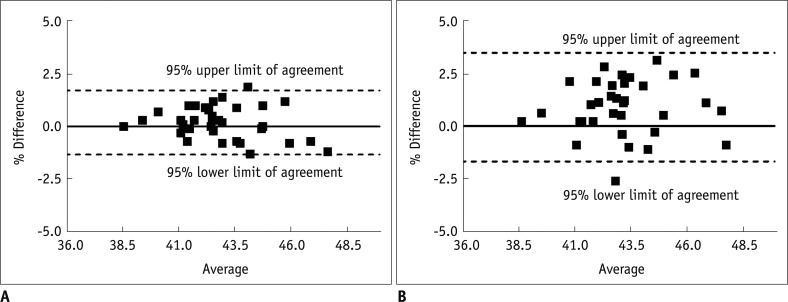
With the 34 examinations, where the liver T1rho maps were constructed, the ICC for 6-SLT T1rho measurement vs. 3-SLT T1rho measurement was 0.922, while ICC for 6-SLT T1rho measurement vs. 2-SLT T1rho measurement was 0.756. The Bland and Altman plots for the comparison are shown in Figure 4, with the mean difference of 0.19 (95% limits of agreement: -1.34, 1.73) for 6-SLT vs. 3-SLT T1rho measurement, and the mean difference of 0.89 (95% limits of agreement: -1.67, 3.45) for 6-SLT vs. 2-SLT T1rho measurement.
Eleven subjects allowed the assessment of scan re-scan reproducibility (Table 1). The ICC was 0.755 when 6-SLT was used, 0.727 when 3-SLT was used, and 0.528 when 2-SLT was used.
Pooled all 34 examinations together, the measured liver T1rho value (mean ± SD) was 42.8 ± 2.1 ms (range: 48.3-38.6 ms) for 6 SLT, 43.0 ± 1.9 ms (range: 47.1-38.6 ms) for 3 SLT, and 43.7 ± 2.2 ms (range: 48.0-38.8 ms) for 2 SLT. There was no significant difference between the measured liver T1rho values by 6 SLTs and 3 SLTs (p = 0.159), while, the difference between 6-SLT measurement and 2-SLT measurement was significant (p < 0.001).
Go to :
DISCUSSION
Accurate and precise T1rho mapping is challenging under the scan time constraint because multiple SLTs are usually required, and a long delay time is also often necessary in the spin-lock pulse sequence for the longitudinal magnetization restoration. The reduction of the applied SLT numbers is an apparent strategy to enhance T1rho imaging efficiency, as long as the accuracy and reliability of T1rho mapping could be maintained. In clinical practice, it will be always advantageous if accurate liver T1rho value measurement can be obtained with fewer SLTs, particularly for patients who experience difficulties in holding their breath. In addition, a high frequency spin-lock pulse is usually associated with high SAR and total RF energy deposition, which may be a safety concern for T1rho MR imaging, particularly at high fields, such as 3T (15). Examinations with fewer SLTs are also helpful to reduce the total RF energy deposition into the patient bodies, and mitigating the safety concern.
When fewer SLTs are used for T1rho imaging, careful selection of the applied SLTs is important to optimize the accuracy of the T1rho maps. If the applied SLTs are all much shorter than the true T1rho value of the target tissue, big fitting deviation of T1rho values can be introduced. On the other hand, much longer SLTs than the true T1rho value would result in images with very low SNRs, and hence reduce the fitting accuracy. The SLT of 1 ms was selected, in this study, as the T1rho-weighted image acquired at this SLT has the highest SNR. Theoretical analysis has shown that the highest precision of exponential decay constant fitting could be achieved if the second data point is measured around the true value of the exponential decay constant (16). Therefore, The SLT of 50 ms was selected because it was close to and slightly larger than the true T1rho value of human livers at 3T (11). Actually, by using two SLTs, T1rho and M0 could be explicitly solved from the mono-exponential equation with the R2 always equal to one. An additional SLT of 20 ms was included in the 3-SLT fitting to increase the degree of freedom for fitting, and thus, improve the robustness of T1rho mapping. Note that the selection of the third data point, 20 ms in this study, for fitting will be relatively robust, i.e. T1rho fitting accuracy and uncertainty, would not change much if the third data point is selected, as the other values like 30 ms or 40 ms. In the current study, with three slices acquired with 6 SLTs, 3 SLTs, or 2 SLTs, 11.4 minutes, 5.7 minutes or 3.8 minutes were required, respectively. In addition, some resting time is allowed after each breath-holding. By using 3-SLT approach, the T1rho imaging scan time for the liver could be reduced approximately by a factor of two, compared to an acquisition using six SLTs. On the other hand, T1rho fitting with fewer SLT numbers are more prone to outliers in the datasets. The outliers could be introduced by many factors, such as motion displacement and image artifacts. When 6 SLTs are used, a small number of outliers can be easily discarded, and the accuracy of fitting could still be ensured by the remaining data points. Even the outliers are not discarded from data fitting. Their influence on the fitting accuracy is still much lower than by using fewer SLTs because the error induced by the outliers could be compensated by many other data points. In our experiments, outlier-proneness accounted for two cases of failures (around 5.6% of the total 36 examinations) in T1rho map reconstruction, due to the severe bulk motion artifact in the acquisition at the SLT of 50 ms, when only two or three SLTs were used. This is a compromise to be taken when using fewer SLTs.
Because the main purpose of this study was to compare the agreement of 6-SLT vs. 3-SLT measurement, and 6-SLT vs. 2-SLT measurement, all the MRI data, including fasting status and post-meal status, were used for comparison. It was previously shown that there was no difference of liver T1rho value between fasting status and post meal (11). The ICC for 6-SLT vs. 3-SLT measurement and 6-SLT vs. 2-SLT measurement were satisfactory, according to Fleiss (14), though as expected, the ICC for 6-SLT vs. 3-SLT agreement was better than 6-SLT vs. 2-SLT agreement. There was a trend that when fewer SLTs were used for liver T1rho mapping, the measured liver T1rho values were higher. Though the difference between 6-SLT and 3-SLT measured liver T1rho values was minimal, the difference between 6-SLT and 2-SLT measured liver T1rho values reached statistical significance. The ICC for re-scan reproducibility was comparable with 6-SLT and 3-SLT measurements (= 0.755 and 0.727 respectively), while it was less optimal for 2-SLT measurement (= 0.528).
One limitation of the current study is that only healthy volunteers were studied, and whether the results from this study can directly be translated to application in patients with liver diseases remain to be further investigated. It is worth noting that the SLTs used in this study may not be appropriate for the measurement of very high or low T1rho values. Although the T1rho values for rats, with liver fibrosis or cirrhosis, have been reported to increase moderately, compared to that of the normal livers (8), the lack of true T1rho values for diseased liver in human subjects may restrict the limited SLTs used in this study, which was only valid and appropriate for healthy volunteers. The optimized SLTs for diseased livers in human subjects should be further determined, in future studies. In patients with pre-cirrhotic stages of the liver fibrosis, as well as patients with early cirrhosis, the liver parenchyma usually has a normal appearance or may exhibit only subtle, nonspecific heterogeneity on conventional imaging techniques (17, 18). Recently, a number of novel MR imaging techniques are being investigated to identify or grade liver cirrhosis, including double contrast-enhanced MR imaging (18, 19), MR elastography (18, 20), and diffusion-weighted imaging (18, 21). These techniques' sensitivity for early liver fibrosis and reproducibility have not been well established (9). T1rho MRI had the advantage that it does not involve additional intravenous injection or external driver. With further technical optimization, T1rho MRI may be a potential important biomarker for liver fibrosis early grading, evaluation of disease progression, and monitoring responses to drug treatment (22).
In conclusion, the preliminary results from this study suggest using 3 SLTs of 1, 20, and 50 ms may be an acceptable alternative when fast acquisition is desired for the liver T1rho imaging without compromising the precision of T1rho mapping; while 2 SLTs do not provide reliable measurement of liver T1rho relaxation.
Go to :
 XML Download