

 PDF
PDF ePub
ePub Citation
 Print
Print


INTRODUCTION
Hemangiomas are the most common benign tumors of the liver, and their characteristic imaging features have been well documented and widely accepted as a diagnostic on dynamic contrast enhanced computed tomography (CT) and magnetic resonance imaging (MRI) (1). However, some hepatic hemangiomas, with atypical imaging features, such as extremely slow or rapid contrast material filling-in during the dynamic imaging in addition to the internal hemorrhagic or sclerotic components, remain difficult to differentiate from other hepatic lesions (2).
The diffusion-weighted MR imaging (DWI) produces an image contrast depending on the movement of the extracellular water, and offers a means of quantifying the diffusion effects via the measurement of the apparent diffusion coefficient (ADC). Recently, the application of DWI in the upper abdomen has become practical and recommended as an adjunct to MRI of the liver that can be performed within an acceptably short amount of time. Several recent reports have suggested that ADCs on DWI are useful for the characterization of focal hepatic lesions (3-8).
Although there are large discrepancies in the reported ADC values in the abdomen, caused by variability in MR machines and applied MR parameters at each institute, most studies show lower ADC values in the malignant lesions than in the benign lesions, including cysts (9). Hepatic hemangiomas have shown various degrees of signal intensities and ADCs in several studies that have evaluated cystic and solid tumors (3, 5-9). In practice, some hepatic hemangiomas show relatively low ADCs on DWI, which significantly overlap with those of solid tumors, such as hepatocellular carcinomas or liver metastases (9). In a recent study by Goshima et al. (10), using DWI with b factors of 0 and 500 s/mm2, which consisted of only one trial to correlate DWI features with the pattern of intralesional blood flow in hepatic hemangiomas, early enhancing lesions showed higher ADCs than did the slowly enhancing lesions. In the meanwhile, by using the multiple b factors, we hypothesized that we could verify their results and separate the ADC changes from other factors besides the perfusion difference.
The purpose of our study was two-fold. First, we investigated the relationships between the speed of contrast enhancement during the dynamic imaging and the ADC values on DWI using multiple b factors to enhance the accuracy of the automatically calculated values on the ADC maps. Second, for cases in which the ADC varied with the speed of enhancement of the hemangioma, we manually calculated ADCs using several different combinations of two b factors to investigate the cause of the ADC differences.
MATERIALS AND METHODS
Patient Populations
The institutional review board at our hospital approved the retrospective study protocol and waived informed consent for the individual patients. Among the 780 consecutive patients examined, via a hepatic MRI with dynamic imaging and DWI during a two-year period (from March 2007 to March 2009), 47 patients (20 men, 27 women; age range 26-79 years; mean age, 53 years) with 69 hepatic hemangiomas (≥ 1 cm) were included. Regardless of the number of lesions in each patient, all of the hepatic hemangiomas were enrolled by the following criteria. Hepatic hemangiomas were diagnosed using the combination of pre-established typical imaging features, including a strong T2-weighted hyperintensity, in addition to the early peripheral globular enhancement and centripetal enhancement on a dynamic MRI and CT. For T2-weighted hyperintense lesions on dynamic imaging, which showed an early homogeneous and sustained enhancement similar to the intrahepatic vasculature, long-term (12 month or longer) follow-up imaging studies were added to confirm that the lesions were benign (1). Lesions with diameters of 1.0 cm or greater were enrolled because the measurements of smaller lesions would not be sufficiently reliable, due to the partial volume averaging effect, which can result in underestimation in the quantitative measurement of ADC values.
MRI Techniques
Magnetic resonance imaging was performed using a 1.5-T unit (Magnetom Avanto; Siemens Medical Solutions, Erlangen, Germany), equipped with high-performance gradients (maximum amplitude 45 mT/m) and a six-element phased-array surface coil. After determination of the optimal timing for the arterial phase imaging, using the timing bolus technique, dynamic contrast-enhanced imaging was obtained after the administration of a bolus injection of the gadopentetate dimeglumine (0.1 mmol/kg of Magnevist; Bayer Schering Pharma, Leverkusen, Germany), at a rate of 2 mL/sec. We used a 3D gradient echo sequence (VIBE; Siemens, Erlangen, Germany) with ultrafast image reconstruction, using the parallel imaging algorithms (GeneRalized Autocalibrating Partially Parallel Acquisitions [GRAPPA] factor = 2) in the axial plane (Repetition Time [TR] = 4.4 ms, Echo Time [TE] = 2.1 ms, flip angle = 10°, matrix = 448 × 224, field of view [FOV] = 271 × 379 mm, slice thickness = 5 mm, slice spacing = 2.5 mm, slices = 72) during a 20 s breath-holding period. A dynamic series consisted of one precontrast series, followed by three successive postcontrast series, including an early arterial, late arterial, and portal phase imaging, at 34 s intervals (20 s for image acquisition with breath-holding and 14 s for rebreathing), at the start of each phase imaging followed by a 5-minute delayed phase imaging.
Diffusion-weighted MR imaging was performed before the dynamic imaging, using a single-shot spin-echo echo planar imaging (EPI) sequence with the b factors of 50, 400, and 800 s/mm2 along the three orthogonal directions. The sequence was obtained within a single breath-holding period for the upper half of the liver and another single breath-holding period for the lower half of the liver. Other technical parameters included: TR = 1000 ms, TE = 69 ms, matrix = 128 × 192, FOV = 30 to 40 cm adapted to individual body size, nine slices for each b factor for each half of the liver (total 18 slices for entire liver), thickness = 6 mm, interslice gap = 30%, average = 2, bandwidth = 1735 Hz/pixel, and acquisition time = 22 s for each breath-holding period. The parallel imaging algorithms (GRAPPA), with an acceleration factor of 2, were added to reduce the acquisition time. Spectral fat saturation was employed systematically to suppress the chemical-shift artifacts. ADC maps regarding isotropic images were automatically acquired and all mean ADCs of the lesions were measured on those maps. To improve the signal-to-noise ratio and for patient convenience, DWI, under free-breathing, was alternatively performed. Imaging parameters, different from the above breath-holding sequence, were as follows: TR = 3900 ms, TE = 75 ms, matrix = 156 × 192, slices = 78 (26 slices for each b factor), thickness = 6 mm with interslice gap = 20%, and the average = 4. Acquisition time for the entire liver using the three different b factors was 80 seconds, and all other parameters were the same as those in the breath-holding technique.
Data Analysis
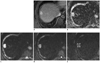
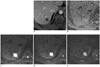
Three radiologists classified each lesion into three groups, according to the speed of intratumoral enhancement determined by consensus. Classification was determined using the visually-estimated proportion of contrast enhancement in the entire tumor volume on portal phase images (group 1, > 75% [rapid, n = 26]; group 2, 25-75% [intermediate, n = 28]; group 3, < 25% [slow, n = 15]). Automatically, the calculated mean ADCs using all three b factors were obtained in operator-defined regions of interest (ROI) on the ADC maps (Figs. 1, 2). Additionally, through ROI drawing directly on the diffusion images with three different b factors (Figs. 1, 2), two ADCs were manually calculated with two different b factors (e.g., mADC50-400 with b = 50 and 400 s/mm2; mADC400-800 with b = 400 and 800 s/mm2) using the following equation: mADC = (ln[SI1/SI2])/(b2-b1), where b1 is the smaller b factor, b2 is the larger b factor, and SI1 and SI2 represent the corresponding signal intensities, which were obtained in the regions of interest on each b factor image. All of the measurement processes were performed by each of three independent radiologists, who already determined the speed of enhancement, during the dynamic imaging, but temporarily blinded for the pre-determined classification of each lesion, and all three measured values were averaged for further analyses.
Statistical Analysis
One-way analysis of variance (ANOVA) was used to compare the size differences among the different groups of hemangiomas. Pearson's correlation test was used to evaluate the relationship between the lesion size and ADC. Student's t test was used to compare the automatically calculated ADCs and mADCs to define a multiple paired group-to-group differences. The differences between mADCs for each group were also evaluated. All statistical analyses were performed using a software package (SPSS 13.0. for Windows; SPSS, Chicago, IL, USA), and differences were considered as significant when the p value was less than 0.05.
RESULTS
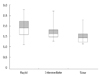
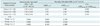
Regarding the mean lesion size, group 1 (n = 26, 1.64 ± 0.80 cm) was similar to that of group 3 (n = 15, 1.53 ± 0.66 cm), and smaller than group 2 (n = 28, 2.44 ± 1.87 cm); however, these differences were not significant (p = 0.064). There was no significant correlation between the ADCs measured on the automatically calculated ADC maps and the sizes of the lesions (r = 0.148, p = 0.226). The mean ADC (× 10-3 mm2/s) measured on the ADC maps was significantly higher in group 1 (1.91 ± 0.44) than were the mean ADCs of group 3 (1.48 ± 0.34) (p = 0.002) and group 2 (1.70 ± 0.35) (p = 0.046) (Figs. 1-3) (Table 1). There was no significant difference in the mean ADCs between groups 2 and 3 (p = 0.052).
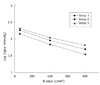
Among the manually calculated ADCs, there were significant differences between group 1 and 3 (mADC50-400, 2.12 vs. 1.48, p = 0.008; mADC400-800, 1.68 vs. 1.22, p = 0.010) (Table 1). Between group 1 and 2, there was a significant difference in mADC50-400 (2.12 vs. 1.79, p = 0.049), but not in mADC400-800 (1.68 vs. 1.52, p = 0.222). There were no significant differences with regard to mADCs, between groups 2 and 3 (mADC50-400, 1.79 vs. 1.48, p = 0.187; mADC400-800, 1.52 vs. 1.22, p = 0.085). We observed a significant difference between mADC50-400 and mADC400-800 in group 1 (2.12 vs. 1.68; p = 0.001), but this difference was not seen in the other groups (group 2, 1.79 vs. 1.52, p = 0.096; group 3, 1.48 vs. 1.22, p = 0.433) (Fig. 4).
DISCUSSION
Apparent diffusion coefficients on DWI permit quantification of the combined effects of the microcirculation of blood (perfusion) and molecular Brownian motion of water (diffusion) within the tissue (8, 9). In the majority of the malignant lesions, increased cellularity and distortion of the extracellular space lead to a restriction of diffusion, thereby decreasing the ADC. Cystic lesions, including the common benign cysts and liquefied necrosis in solid lesions, contain free moving protons that allow for free diffusion and result in high ADCs. Meanwhile, the hepatic hemangiomas consist of cavernous vascular spaces that allow for free diffusion of water molecules and intervening interstitial septa that restrict molecular motion. The ADCs of hemangiomas demonstrated an inhomogeneous appearance in some cases, higher values overlapped with those of some cysts, and the lower values overlapped with those of some metastases or, rarely, other solid tumors, making it difficult to distinguish hemangiomas from other hepatic tumors on DWI (3, 5-7, 11).
In the early period of DWI use in liver imaging, it had been already found that ADCs depend on the sizes of the b factors (6, 11-14); when a large b factor is used, ADCs approximate the true value of the tissue, whereas, a small b factor results in the influence of intravoxel perfusion on the ADCs, which are then usually overestimated. Considering the variability, in contrast to the enhancement speed on dynamic CT or MRI, which reflect the variability of blood flow in the cavernous spaces of hepatic hemangiomas, we tried to identify a relationship between the enhancement speed and ADCs of hepatic hemangiomas via quantification of the signal intensity attenuation, during DWI, using multiple small and large b factors. We presumed that a manual calculation of the ADCs with two smaller b factors (mADC50-400) would be more affected by an intralesional blood flow, and might be different from the ADCs calculated using the two larger b factors (mADC400-800), which are relatively unaffected by the perfusion effect. In the present study, the mean ADCs, measured on the ADC maps in the different groups of hepatic hemangiomas, were well correlated with the speed of contrast enhancement, similar to the results of a previous study by Goshima et al., who used a single intermediate b factor (500 s/mm2) (5). Manually calculated mADCs demonstrated that the rapidly enhancing hemangiomas have significantly higher ADCs, when they are calculated with the smaller b factors (50 and 400 s/mm2), compared with the ADCs calculated with the larger b factors (400 and 800 s/mm2); this effect was not observed in the slowly enhancing hemangiomas (Fig. 4). Our results suggest that only the rapidly enhancing hemangiomas are grossly influenced by the intralesional vascular perfusion, while the others are hardly affected by the sizes of the b factors for their ADCs.
When we compared mADCs with the use of the same b factors, among the three groups, it was interesting that there were significant differences not only for mADC50-400, but also for mADC400-800 between the rapidly enhancing and the slowly enhancing groups. On a logarithmic plot of the signal intensity versus the various b factors (Fig. 4), rapidly enhancing hemangiomas showed a stiffer slope of the signal attenuation representing a higher mADC than did the other, more slowly enhancing hemangiomas, even at larger b factors, which are relatively free from the effects of vascular perfusion. Depending on this observation, besides the speed of the blood flow in the cavernous spaces, there should be other factors to determine ADC of hepatic hemangiomas, showing a different speed of contrast enhancement.
In a previous study dealing with the correlations between the dynamic imaging and pathology of hepatic cavernous hemangiomas, Yamashita et al. (15) suggested that the lesions with wider cavernous spaces are more slowly enhancing because of the longer duration for complete intralesional contrast material filling-in. Additionally, intralesional fluid-fluid level, suggesting a separation of blood cells and serous fluid by the stagnant blood flow in the wide cavernous spaces, has been observed in some extreme cases of slowly enhancing hemangiomas (16-19). In such situation, we could suggest that this effect may contribute to the lower mADC400-800 values of the slowly enhancing hemangiomas from the restricted water diffusion at the area of cellular aggregation in the wide cavernous spaces. Considering a different opinion by Yu et al. (20), which opposes the suggestions of Yamashita et al., however, there could be a different explanation for the restricted diffusion for the slowly enhancing hemangiomas; the hemangiomas with narrower cavernous spaces would have relatively more abundant and thick irregular intervening septa, which could disturb molecular diffusion, resulting in lower ADCs in addition to higher resistance to vascular inflow to the cavernous space. Using this line of thought, wider cavernous spaces would allow more free molecular motion, as well as richer perfusion, due to the effects of low resistance of the thinner septa on the arterial inflow, resulting in higher ADCs.
Our study has several limitations. First, due to the lack of pathologic specimen, we could not correlate the DWI feature with the histological characteristics. Besides the structural differences of the cavernous space, some degenerative processes, like the internal hemorrhage, calcification or sclerosis, could affect the ADC of hepatic hemangiomas. Most of the rapidly and slowly enhancing hemangiomas (group 1 and 3 cases) of our study were smaller than 2 cm, showing a homogeneous hyperintensity on T2-weighted images throughout the lesion, and there was no grossly defined isolated unenhancing component until the 5-minute delayed phase post-contrast images. Even though there was no gross suggestive finding of internal degeneration, however, the presence of microscopic hemorrhagic foci or sclerotic components, lowering the ADC, could not be excluded without histological information. Second, there were some inevitable technical limitations, despite the use of updated DWI technology to improve image quality and lesion conspicuity. Even though we excluded the sub-centimeter lesions, there could have been some section misalignment or partial volume artifact, which leads to an inaccurate measurement of the ADC. When the lesion is located on the left lobe of the liver, cardiac motion can result in increases in the ADC, due to signal loss on images using the larger b factors. In the present study, at least 10 lesions were located in the left lobe of the liver, and among the rapid enhancing hemangiomas, only 7% were the left lobe lesions; therefore, we feel that the cardiac motion effect had a minor, if any, influence on our results. Third, we used two different DWI data acquisition techniques and there could be variability in the ADC measurement between the two techniques. In a previous study, however, there was no significant difference of the measured ADCs between the breath-holding and free-breathing techniques, while the respiratory-triggered technique, which we did not use in the present study, could show higher ADC values by the pseudo-anisotrophy phenomenon (21, 22). Last, we did not perform DWI with b = 0, and the early component of signal loss with b factors under 50 mm2/s, which is considerably affected by the vascular perfusion effect (11), was not reflected in our results, in this retrospective study. If we had another mADCs data using b = 0 and b = 50 mm2/s, we might obtain higher mADCs, which emphasizes the perfusion effect for rapidly enhancing hemangiomas. We would like to see further studies that includes DWI data, using b = 0 mm2/s or prospective study with the use of multiple small and large b factors for biexponential fitting to generate the intravoxel incoherent motion parameters (11) to reinforce the results of our study.
In conclusion, as compared with slowly enhancing hemangiomas, rapidly enhancing hepatic hemangiomas have higher ADCs that are considerably dependent on their rapid attenuation of signal intensities on DWI, using the smaller b factors, suggesting that the higher speed of blood flow in the cavernous space may significantly contribute to the tendency toward higher ADCs. On the other hand, the differences of manually calculated ADCs, using the larger b factors, which are hardly affected by vascular perfusion, suggest that the differences in molecular diffusion could be rather related to the differences of the intralesional architecture with or without internal degenerative processes, among the different speed groups of hemangiomas. Regarding the practical implications, such DWI features of hepatic hemangiomas could be helpful in the differential diagnosis of focal hepatic lesions. For example, hypervascular solid tumors can be distinguished by their low ADCs, from the rapidly enhancing hemangiomas, showing high ADCs; meanwhile, centrally necrotic, cystic or mucinous metastatic tumors would show high ADCs and can be distinguished from the very slowly enhancing hemangiomas with low ADCs. For verification of the relevant issues, further studies should be followed.
 XML Download