

 PDF
PDF ePub
ePub Citation
 Print
Print


INTRODUCTION
On chest posterior-anterior (PA) radiographs, pericardial effusion usually shows the water-bottle appearance of an enlarged heart, without pulmonary edema. The pericardial recess and the sinus showed varying appearances, ranging from the bands to mass like densities that could be misinterpreted as mediastinal lymph node enlargements, cystic mediastinal masses and aortic dissections on CT scans (1-4). With the advent of fast imaging modalities, which provide high temporal and spatial resolution, more and more recesses have been observed on imaging studies of the mediastinum (5-9). Knowledge of the anatomic details of these recesses is helpful in the interpretation of CT scans because pericardial effusion, or cysts within them, can simulate mediastinal or intracardiac lesions (10-12).
Small amounts of effusion in the pericardial sinuses and recesses have been reported in patients without obvious pericardial effusion in the pericardial cavity proper (10-12). In these cases, chest PA radiographs showed normal findings. However, large amounts of fluid collection in the sinus or recesses in the pericardial space may mimic mediastinal masses on chest PA radiographs, in rare cases. Winer-Muran et al. reported a case that mimicked a mediastinal mass on a chest PA radiographs, due to a distended right superior pericardial recess, by pericardial effusion (13). Shin et al. (14) reported a case that left a mediastinal mass on a chest PA radiographs, due to the fluid collection in the left pulmonic recess of the transverse sinus.
There is a paucity of data regarding the fluid collection in the right lateral portion of the superior aortic recess (rSAR) of the pericardial space on a CT scans mimicking a right anterior mediastinal mass on a chest PA radiographs. Therefore, the purpose of this study is to assess the characteristic features of the right anterior mediastinal mass like opacity, due to the fluid collection assessed by chest PA radiographs and CT scan features.
MATERIALS AND METHODS
Institutional Review Board exemption was obtained to perform this retrospective study. We retrospectively evaluated 9 patients, in whom the fluid collection in the rSAR mimicked a right anterior mediastinal mass on chest PA radiographs, at our hospital between September 2000 and March 2011. All the patients were women, ranging in age from 52 to 87 years old (mean age, 68 years). The diagnosis for these patients was acute pericarditis (n = 2), tuberculous pericarditis (n = 1), angina (n = 1), end stage renal disease (n = 1) due to diabetes mellitus, malignant gastrointestinal stromal tumor of rectum (n = 1), non ST elevation myocardial infarction (n = 1), lacunar infarction in right basal ganglia (n = 1) and thoracic spine fracture (n = 1).
Chest PA and contrast enhanced CT scans were obtained for all patients. CT scans were obtained using a multidetector CT scanner (LightSpeed 16, General Electric Medical systems, Milwaukee, WI, USA) and Hispeed Advantage scanner (Somatom Plus-S; Simens, Erlangen, Germany). Contrast material enhanced CT was started 30 seconds after the initiation of intravenous injection of 100 mL of contrast material (300 mg/mL), at the rate of 2 mL/sec by automatic injector.
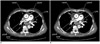
Fluid collection in the rSAR was diagnosed by no visible mass on previous chest PA radiographs, and 1) disappearance of the right anterior mediastinal mass like opacity on a follow-up chest PA radiographs or 2) cyst like lesion connection between the rSAR and the pSAR on CT scans. All chest PA radiographs and CT scans were retrospectively analyzed by the two radiologists on a consensus basis; for the presence of pleural effusion, pulmonary edema and heart size (cardiomegaly = more than 50% cardiothoracic ratio) on the chest PA radiographs and for the portion of fluid collection in the superior aortic recess (anterior, posterior, right lateral portion = anterior portion of the SAR [aSAR], posterior portion of the SAR [pSAR], rSAR) and a connection between the rSAR and the pSAR on the CT scans (Fig. 1A). To clarify the term of pericardial sinus and recess, we chose the terms as defined by Vesely and Cahill (15), as well as Kubota et al. (5) On the basis of the work of Vesely and Cahill (15), the transverse pericardial sinus was divided into superior and inferior aortic recesses, and left and right pulmonic recesses. The superior aortic recess was further divided into anterior, posterior, and right lateral portions, as defined by Kubota et al. (5) (Fig. 1A).
We measured the distance between the right lateral margin of the rSAR and the right lateral margin of the superior vena cava (SVC) on a chest CT.
RESULTS
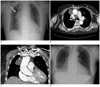
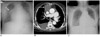
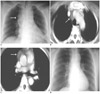
All patients showed cardiomegaly on chest PA radiographs (Figs. 2-4). The results on the portions of the fluid collection, as well as the presence of edema or effusion, are summarized in Table 1. Five patients had pleural effusion. Two patients had mild pulmonary edema. Fluid collection in the right lateral portion of the superior aortic recess, on a CT scan, caused a right anterior mediastinal mass or a bulging contour on chest PA radiographs in all patients (Figs. 2-4). Six patients showed fluid collection in three portions in the superior aortic recess (Figs. 2-4). As the distance between the right lateral margin of the rSAR and the right lateral margin of the SVC increased, on a CT, any right anterior mediastinal mass on chest PA radiographs showed a more greatly bulging contour (Fig. 2). In these patients, increased fluid collection of the rSAR caused an anterior mediastinal mass on the chest PA radiographs. Acute pericarditis (n = 2) and tuberculous pericarditis (n = 1) patients also showed fluid collection in the pericardial space anterior, posterior and inferior to the ventricle. A total of 8 patients showed a connection between the rSAR and the pSAR on a CT scan (Figs. 2, 3). One patient (T spine compression fracture) showed a high riding superior pericardial recess (Fig. 4).
DISCUSSION
The purpose of this paper is to report the fluid collection in the rSAR on a CT scan mimicked a right mediastinal mass on a chest PA radiograph. Kubota et al. (5) reported that physiologic effusion in pSAR was observed in 38% of the 131 patients without pericardial effusion. Physiologic effusion in aSAR was observed in 40% of the 131 patients without pericardial effusion (5). However, physiologic fluid collection in rSAR was not observed in the 131 patients, without pericardial effusion, and was observed in two patients with moderate pericardial effusion. Groell et al. (7) has reported normal pericardial recesses and sinuses on patients without pericardial effusion and pericarditis, using electrocardiographically triggered electron-beam CT scans. Figure 1A showed a slit like fluid connection, between the rSAR and the pSAR in patients without pericardial effusion. The right lateral margin of the rSAR ended in the middle anterior portion of the SVC.
We suggest that the connection between the rSAR and the pSAR may be helpful in differentiating it from a pericardial cyst. Our cases showed this connection in 8 patients. Due to the fluid collection, the right lateral margin of the rSAR migrates into the right lateral margin of the SVC, which wraps one half of the SVC (Fig. 1B). We think that the rSAR portion may be a more expansile space than that of the pSAR and the aSAR. However, we do not exactly know why the rSAR may be a more expansile space than the pSAR and the aSAR. However, the superior pericardial recess, especially, the rSAR is largely surrounded by a movable fatty tissue, which makes it more delineated and expandable (7).
The more portions of fluid collection in the SAR, the greater amount of fluid collection in the SAR, and the more distance between the right lateral margin of the rSAR and the right lateral margin of the SVC increases, and thus, the more anterior mediastinal mass like opacities were shown the on chest PA radiographs. The distance between the right lateral margin of the rSAR and the right lateral margin of the SVC on a CT scan may be the most important factor among these, which determines the bulging contour on a chest PA radiograph.
In our case, 7 patients did not show pulmonary edema and 2 patients showed mild pulmonary edema. But 2 patients pulmonary edema due to renal failure and myocardial infarction. Therefore, the characteristic features of these patients on their chest PA radiographs were the right anterior mediastinal mass like opacities, cardiomegaly regardless of pulmonary edema. A follow-up chest radiography or previous radiography can help to obtain the differential diagnosis.
A T spine fracture patient showed a high-riding superior pericardial recess, indicating a high positioned pSAR. Choi et al. (16) reported that the pSAR extended cephalad ("high-riding") into the right paratracheal region. In these patients, differentiation of mediastinal lymphadenopathy or the mass was difficult. Visualization of a connection between the high-riding and inferior portions of the superior pericardial recess on the CT scans should facilitate the differentiation from bronchogenic cysts or lymphadenopathy.
This study had some limitations. First, only a small number of patients were included in this study. Second, the study was limited by its retrospective design.
In conclusion, the characteristic features of these patients are the presence of a right anterior mediastinal mass like opacity, due to the fluid collection in the rSAR and cardiomegaly, regardless of a pulmonary edema on the chest PA radiographs and fluid connection between the rSAR and the pSAR on the CT scans. We suggest that the differential diagnosis of patients with the right anterior mediastinal mass and cardiomegaly on the chest PA radiographs should be included in the fluid collection in the rSAR. We suggest that the rSAR portion may be more of an expansile space than the pSAR and the aSAR, among the SAR, probably due to the rSAR largely surrounded by fatty tissue.

 XML Download