Journal List > Korean J Radiol > v.13(4) > 1026666

Lv, Lin, Gao, and Chen: Spectral CT: Preliminary Studies in the Liver Cirrhosis

Abstract

Objective

To investigate the value of spectral CT imaging in the diagnosis and classification of liver cirrhosis during the arterial phase (AP) and portal venous phase (PVP).

Materials and Methods

Thirty-eight patients with liver cirrhosis (Child-Pugh class A/B/C: n = 10/14/14), and 43 patients with healthy livers, participated in this study. The researchers used abdominal spectral CT imaging during AP and PVP. Iodine concentration, derived from the iodine-based material-decomposition image and the iodine concentration ratio (ICratio) between AP and PVP, were obtained. Statistical analyses {two-sample t test, One-factor analysis of variance, and area under the receiver operating characteristic curve (A [z])} were performed.

Results

The mean normalized iodine concentration (NIC) (0.5 ± 0.12) during PVP in the control group was significantly higher than that in the study group (0.4 ± 0.10 on average, 0.4 ± 0.08 for Class A, 0.4 ± 0.15 for Class B, and 0.4 ± 0.06 for Class C) (All p < 0.05). Within the cirrhotic liver group, the mean NIC for Class C during the AP (0.1 ± 0.05) was significantly higher than NICs for Classes A (0.1 ± 0.06) and B (0.1 ± 0.03) (Both p < 0.05). The ICratio in the study group (0.4 ± 0.15), especially for Class C (0.5 ± 0.14), was higher than that in the control group (0.3 ± 0.15) (p < 0.05).The combination of NIC and ICratio showed high sensitivity and specificity for differentiating healthy liver from cirrhotic liver, especially in Class C cirrhotic liver.

Conclusion

Spectral CT Provides a quantitative method with which to analyze the cirrhotic liver, and shows the potential value in the classification of liver cirrhosis.

INTRODUCTION

Though a new application for a fundamental physics concept, Dual-energy computed tomography (DECT) has been around for several decades (1-4). However, the method did not previously achieve widespread clinic use because of deficiencies inherent in the immature technology (5), such as motion-related misregistration, marked image noise, relatively low spatial resolution, and excessive radiation exposure. The recently introduced Spectral CT, a single-detector and single-source DECT system with a capability for rapid alternation between two peak voltage settings (i.e., "fast switching"), has led to renewed interest in clinical application of, (6, 7) as well as further investigation of DECT. The high- and low-energy datasets (140 kVp and 80 kVp) the datasets obtained using Spectral CT can be utilized to reconstruct material-decomposition images (e.g., water- and iodine-based images) (8-10).
The fast kVp switching method at Spectral CT takes advantage of the fact that a tissue shows different degrees of attenuation when scanned at different X-ray energies (11). The unique linear attenuation coefficients, obtained by Spectral CT imaging at two different energies, can be used to discriminate between different materials (e.g., fat, calcium, iodine, and water), which are not allowed by conventional CT (11, 12). The images reconstructed from these differential data, referred to as material density images, may provide diagnostic information beyond that obtainable with conventional CT (13) in the evaluation of the abdomen.
Cirrhosis refers to the late stage of hepatic fibrosis which results in widespread distortion of normal hepatic architecture; it is characterized by regenerative nodules surrounded by dense fibrotic tissue. Based on the fact that different intakes of iodine contrast agents in the healthy liver, and three stages of liver cirrhosis during the arterial phase (AP) and portal venous phase (PVP), we evaluated the potential clinical applications of spectral CT imaging in the diagnosis and classification of liver cirrhosis during the AP and PVP.

MATERIALS AND METHODS

Vitro Study

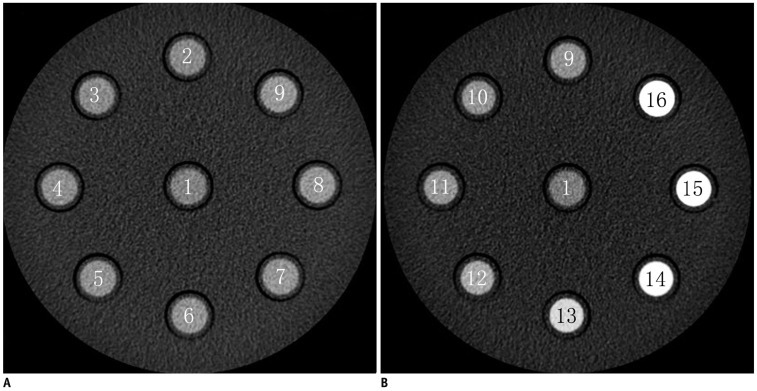
A Vitro experiment was performed in order to evaluate the accuracy of iodine concentration measurements obtained with the spectral images on which Spectral parameters are based. A set of 16 test tubes containing different known iodine concentrations, ranging from 0 to 30.0 mg/mL, was prepared (Fig. 1).

Patient Population

The ethics committee at our institution (Ruijin Hospital) approved this prospective study, and all patients were provided with a written informed consent form prior to participation. Technical support was provided by a GE Healthcare (Milwaukee, WI, USA) employee (J.L.), the manufacturer of the CT system used in this study. The authors not associated with GE Healthcare maintained full control of the data at all times.
From January 2010 to May 2011, 81 consecutive patients underwent the unenhanced and two-phase CT liver scans on a Discovery CT750 HD CT scanner (HDCT, GE Healthcare Milwaukee, WI, USA). Collected clinical data included clinical examination (e.g., demographics andmedical history) as well as routine laboratory investigations; collected pathologic data consisted of liver biopsy findings obtained fewer than 2 months prior to or post liver spectral CT imaging. All liver spectral CT imaging examination findings were reviewed by two radiologists (30 and 13 years of experience in abdominal imaging, respectively). Both radiologists looked for CT imaging signs of chronic liver disease, including nodularity and atrophy, ascites, etc. Liver cirrhosis was categorized into one of three stages, according to a modified Child-Pugh score. Patients were included in the healthy liver group, as the control group (n = 43, 24 men, 19 women, mean age 50 ± 15 years) or in the liver cirrhosis group (Child-Pugh class A/B/C: n = 10/14/14), as the study group (n = 38, 24 men, 14 women, 49 ± 14 years).
Patients were included in the study group on the basis of pathologic data (n = 25), surrogate serum markers (platelet count and procollagen III N-terminal peptide) (14), or the aspartate aminotransferase-to-platelet ratio index (15) suggesting the presence of liver cirrhosis (14) combined with CT or magnetic resonance imaging signs of chronic liver disease (n = 13). Two (5%) of these 38 patients' liver problems were attributed to alcohol intake, twenty-eight patients' liver problems (74%) to hepatitis B viral infections, another 2 of the patients' problems were attributed to hepatitis C, and another 2 to hepatolenticular degeneration; and the liver complications of another 4 (11%) were attributed to cryptogenic cirrhosis. Patients with portal thrombosis were excluded.
Forty-three patients were included in the control group-10 patients with hepatic cysts, twenty-one with liver hemangioma, and twelve with normal livers.

CT Examinations

A set of 16 test tubes containing different known iodine concentrations, from 0 to 30.0 mg/mL, was scanned using the Discovery CT750 HD scanner with a collimation thickness of 0.625 mm, a rotation speed of 0.6 seconds, and a helical pitch of 0.983 : 1. The scans were performed three times for each of the iodine concentrations.
Triple-phase CT (i.e., unenhanced and two-phase contrast material-enhanced CT examinations) was performed using the same spectral imaging protocol-namely, fast tube voltage alternating between 80 and 140 kVp in a craniocaudal direction. After scout CT scanning, all patients underwent the non-contrast scanning in the conventional helical mode at a tube voltage of 120 kVp. Then, patients were injected with nonionic contrast materials (ioversol, Optiray 320; Tyco Healthcare, Montreal, Quebec, Canada) with antecubital venous access at a rate of 3 mL/sec; a total of 90-120 mL (1.5 mL per kilogram of body weight) was injected during the hepatic AP and PVP. The scanning delay for hepatic AP imaging was determined using automated scan-triggering software (SmartPrep; GE Healthcare, Milwaukee, WI, USA). AP scanning automatically began 12 seconds after the trigger attenuation threshold (100 HU) was reached at the level of the supraceliac abdominal aorta. At a delay of 30 seconds after AP scanning, hepatic PVP scanning began.
AP and PVP scans were performed in the spectral imaging mode with a single tube and a rapid dual kVp (80 kVp and 140 kVp) switching technique. Other scanning parameters were as follows: collimation thickness of 0.625 mm, tube current of 600 mA, rotation speed of 0.6 seconds, and helical pitch of 0.983. The volumetric CT dose index (CTDIvol) was 21.8 mGy. This CTDIvol value was comparable to the 21.5-mGy dose administered for conventional contrast-enhanced liver scanning in a normal-sized patient at our institution. The CT images were reconstructed using projection-based material-decomposition software and a standard reconstruction kernel. The reconstruction thickness was 1.25 mm, at an interval of 1.25 mm. The adaptive statistical iterative reconstruction algorithm was applied in order to suppress image noise around the decomposition images. Material-decomposition images were reconstructed, for analysis purposes, from the single spectral CT acquisition.

Image Analyses

Vitro Study

The iodine concentrations (in milligrams per milliliter) of the 16 test tubes were measured using a circular region of interest covering approximately 80% of the test tube cross section of the iodine-based material-decomposition images.
An abdominal radiologist with two years of experience performed the quantitative measurements on the material decomposed images by using a spectral imaging viewer (GSI Viewer; GE Healthcare, Milwaukee, WI, USA).

Clinical Study

For each patient, the iodine concentrations in the liver were derived from the iodine-based material-decomposition images. All circular regions of interest (ROI) (mean number of pixels, 200; range, 60-580) were manually positioned to avoid large vessels, liver segments with focal lesions, and prominent artifacts. Two ROIs were positioned in the right liver lobe, and another two were positioned in the left liver lobe. These measurements in each lobe were performed at different image levels, and average values were calculated. For all measurements, the size, shape, and position of the regions of interest were kept consistent between the two phases by applying the copy-and-paste function. Two parameters were derived from the iodine concentration measurements: the iodine concentration ratio (ICratio) between AP and PVP and the normalized iodine concentration (NIC). The ICratio was defined as ICAP/ICPVP, where ICAP and ICPVP denoted iodine concentrations during AP and PVP, respectively. The normalized iodine concentration was obtained by dividing the iodine concentration in the liver (ICliver) by that in the aorta (ICaorta) for both the AP and PVP phases: NIC = ICliver/ICaorta. The normalized iodine concentration was introduced in order to minimize variations among patients as well as toreduce scanning time.

Statistical Analyses

The average spectral imaging-measured iodine concentrations were compared with the true concentrations in the test tubes, with a two-sample t test; the correlations between them were analyzed.
The two-sample t test was performed to compare the parameters of NIC and ICratio between the control and study group, as well as between the control group and the cirrhotic patients of different classes in the study group, with p ≤ 0.05 indicating significance. A one-way analysis of variance was used to provide evidence of significant difference in these parameters among the Class A-C groups. The statistical analyses were conducted using SPSS13 software for Windows (SPSS, Chicago, IL, USA).
Receiver operating characteristic (ROC) curves were generated in order to establish optimal threshold values of the parameters required for significant differentiation and their corresponding sensitivities and specificities. Among the Class A-C groups, the true-positive (true-negative) cases were those in Class C (B), Class C (A) or Class B (A) groups, which were correctly diagnosed.
Diagnostic capability was determined by calculating the area under each reader-specific receiver operating characteristic curve (A [z]). The null hypothesis was that the area under the receiver operating characteristic curve was 0.5; the alternative was that this area was greater than 0.5. Statistical analyses were performed using statistical software (SAS, version 9.1.3; SAS, Cary, NC, USA).

RESULTS

Vitro Study

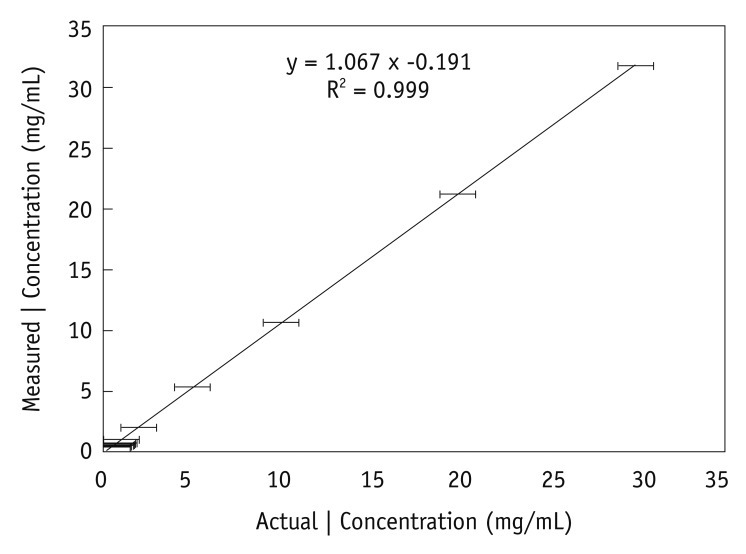
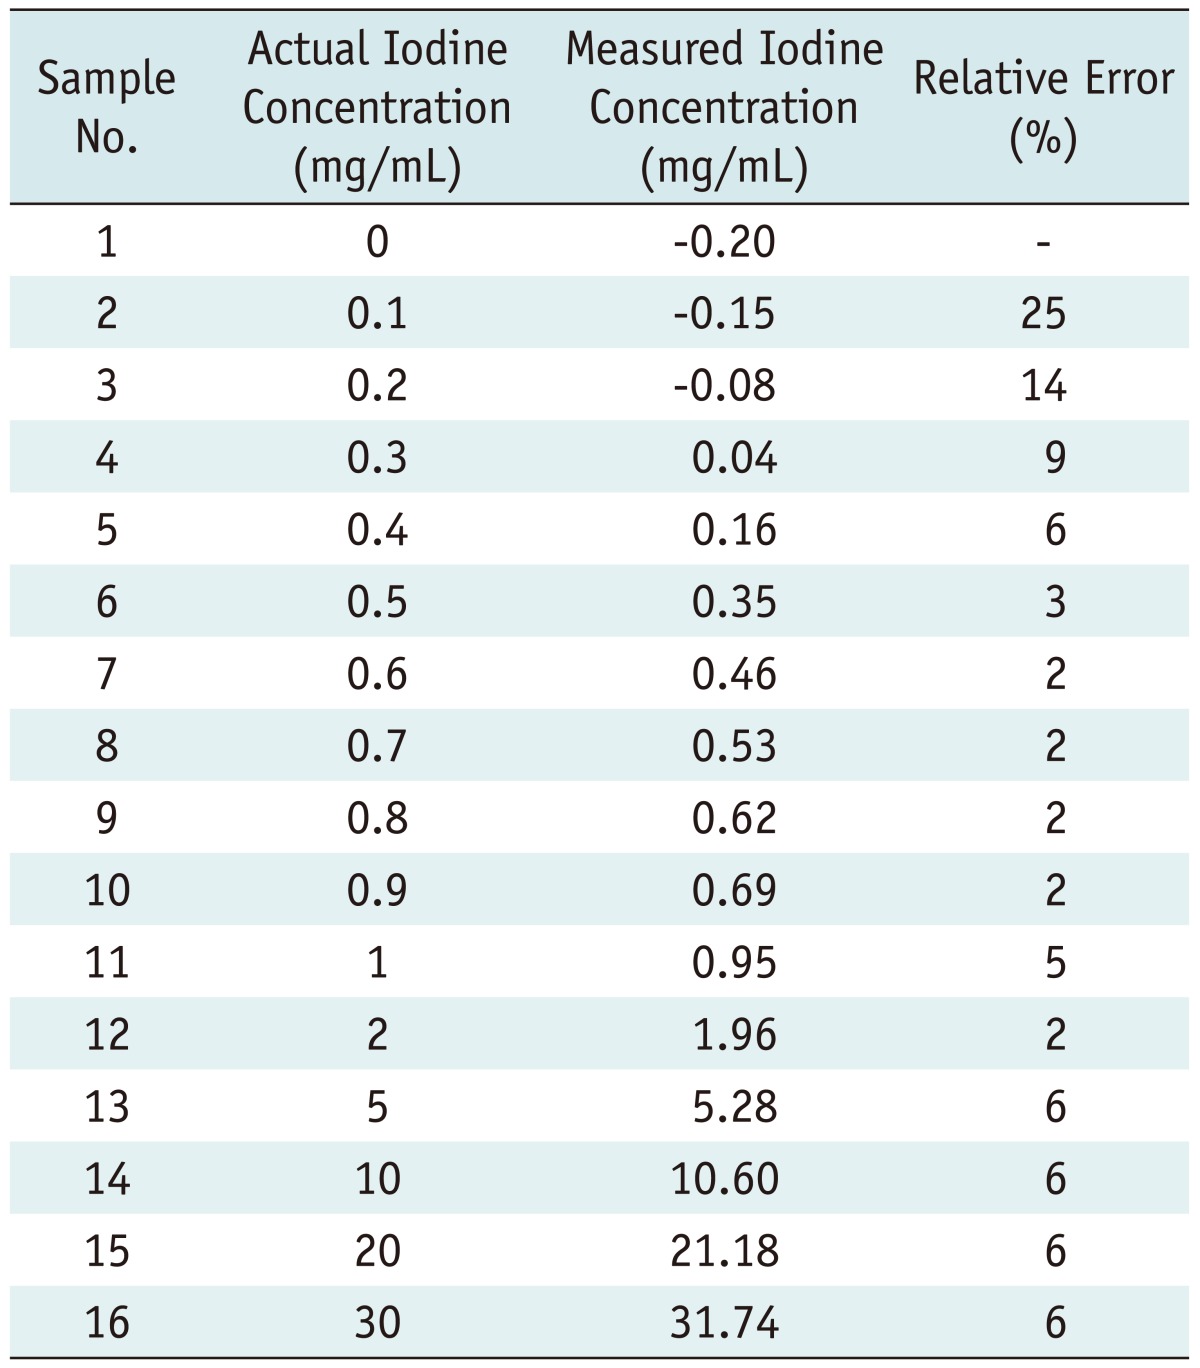
The measured and true iodine concentrations showed high correlations (r = 0.999, p < 0.0001) and excellent agreement (Fig. 2, Table 1). Relative errors were at or below 9% across the range of iodine concentrations, except in the very low concentration of iodine (0-0.2 mg/mL).

Clinical Study

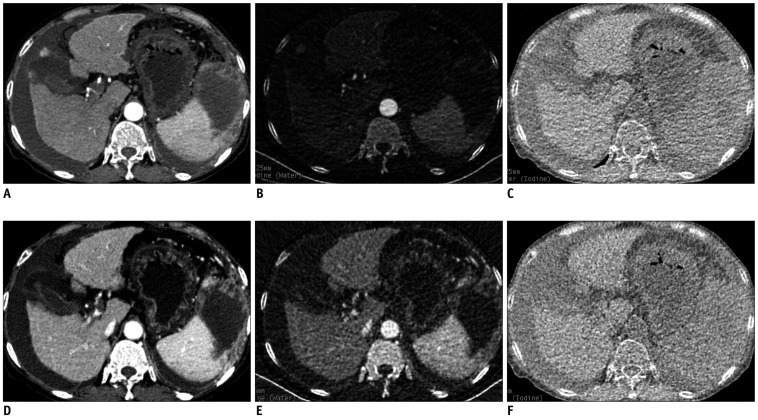
An example set of images derived from a single spectral CT acquisition (section thickness, 1.25 mm) in a patient with cirrhosis B was shown in Figure 3.
The mean NIC during the PVP in the control group was higher than that in the study group (p < 0.05), the mean NIC during the AP in the control group was not higher than in the study group instead, so the ICratio in the former group was lower (p < 0.05) (Table 2). The areas under the ROC curve of NIC during the PVP (0.84) and ICratio (0.65) all showed diagnostic values (p < 0.05). NIC during the PVP and the ICratio both showed high sensitivity (95% and 79%) but relative low specificity (61% and 49%). However, the combination of these two parameters had a sensitivity and specificity of 77% (29) and 87% (37) for the differentiation of the control and study groups {(A [z]), 0.87} (p < 0.05).
Values for the defined quantitative parameters (NIC and ICratio) measured between the control group and the individual Class A-C of the study group were compared (Table 3). NIC during the PVP in the control group was higher than that in Class A-C (p < 0.05), with high sensitivity but low specificity in Classes A and C. The sensitivity and specificity in Class B were both 79% (Table 4). Another two parameters: NIC in AP and ICratio also showed significant differences between the control group and the Class C group, with a sensitivity and specificity of 79% and 70%, 100% and 52% respectively (Table 5).
Although each individual parameter showed neither high sensitivity nor specificity, the combination of parameters NIC during the PVP, and ICratio generated a sensitivity and specificity of 93% (35) and 93% (40) for the differentiation of the control group and the Class C group {(A [z]), 0.94} (p < 0.05).
Among Classes A-C, the mean NIC during the AP in Class C (0.1 ± 0.05) was significantly higher than NICs in Class A (0.1 ± 0.06, p = 0.02) and Class B (0.1 ± 0.03, p = 0.01), both of them increased by approximately 63%. NIC during the AP could differentiate Classes A-B from Class C with a sensitivity and specificity of 71% and 70%, 64% and 86% respectively (Table 6).

DISCUSSION

CT with energy information, especially spectral CT, is an imaging method that extends the capabilities of conventional CT. Spectral CT not only enables the estimation of full linear attenuation, as a function of X-ray photon energy of the imaged subject at each voxel in the CT volume, butthe method also generates material decomposition images so that the composition of the imaged subject can be represented as an equivalent mixture of two basis materials or as a combination of Compton and Photoelectric attenuation parts. Water and iodine are often selected for medical diagnostic imaging, acting as the basis pair for material-decomposition image presentation, as their atomic numbers span the range of atomic numbers for materials generally found in medical imaging, and the numbers approximate those of soft tissue and iodinated contrast material to result in material-attenuation images that can be intuitivelyinterpreted. The decomposition is expressed in terms of the volume fractions of each constituent material in the mix; this provides for a straightforward, physically meaningful interpretation of the data. One important application of this technique is in the quantification of the concentration of contrast observed in a targeted region, providing a measure of blood flow and tissue perfusion.
This study demonstrates the feasibility of contrastenhanced dual-energy CT for the diagnosis and classification of liver cirrhosis. Both parameters of NIC and ICratio were based on iodine concentration, which is referred to as the added value of spectral imaging. Due to the excellent agreement between the measured and true iodine concentrations, the study almost presented actual iodine concentrations instead of relative values. Although relative error was higher in the very low iodine concentrations (0-0.2 mg/mL), this had little effect on the research results because of the small proportion of occurrence (10%) in the significant parameter of NIC during the PVP and ICratio.
In our study, the iodine concentration dropped in portal perfusion, seen at imaging in liver with cirrhosis compared with healthy liver. This was due to extrahepatic portosystemic shunting and intrahepatic portal hypertension in liver fibrosis which was insufficient in compensating for reduced portal flow. The hepatic arterial buffer response (16) can be at maximum capacity in advanced cirrhosis (17), which explains why the iodine concentration during AP in Class C increased by approximately 63% compared with Class A-B and the control group. ICratio in the control group was lower than that in the study group, especially for Class C. It is explained by the fact that the observed decrease in portal flow is thought to result in a compensatory response of hepatic arterial vasodilation in patients with cirrhosis; the hepatic arterial fraction (hepatic arterial buffer response) elevates to maintain total liver blood flow (18).
Similarly to liver perfusion, Spectral CT could also be used as a quantitative method for diagnosis. As shown in our study, the individual parameters of NIC during the PVP and ICratio were highly sensitive but not particularly specific. However, the combination of the two parameters (NIC and ICratio) showed high sensitivity (77%) and specificity (87%) for the differentiation of healthy liver from liver with cirrhosis, especially in the healthy liver and Class C liver cirrhosis, with sensitivity and specificity of 93% and 93% respectively. The parameter of NIC during AP also showed significant differences between Classes C and A-B, especially for Class B, which showed the highest specificity (86%).
Although the static quantification of iodine cannot presently replace the perfusion by dynamic CT, it can, in some respects, reflect the realistic whole blood flow in liver cirrhosis. Moreover, decreasing the radiation dose and the iodine concentration of the contrast material, particularly in Spectral CT, would benefit patients who may need to undergo multiple CT examinations, young patients who are at increased risk of developing cancer from medical radiation exposure (19), or patients with renal impairment. It is also worth mentioning the problems with technical reproducibility with perfusion imaging parameters (20-22).
Our study had several limitations. First, this investigation reflects our preliminary experience with a relative small number of patients. In addition, the threshold values evaluated in our study were based on the specific populations from which they were obtained and were thus probably overestimations of performance. Further prospective clinical trials need to be performed in order to validate our results. Secondly, the causes of chronic liver disease in all patients in the cirrhotic liver group were heterogeneous, which is associated with unique patterns and durations to onset of hepatic hemodynamic aberration (23, 24), and histopathologic confirmation of liver cirrhosis was available in only twenty-five of the 38 patients. Some cases were confirmed using other imaging modalities in conjunction with clinical examinations. This may have influenced the study results. However, the inclusion criteria used for the control group were based on well-accepted noninvasive diagnostic criteria. Moreover, aspartate aminotransferase-to-platelet ratio index scores were always combined with CT imaging data, as inclusion criteria. Thirdly, this study focused on the use of quantitative information generated using spectral CT imaging. In the future, qualitative assessment of iodine- and water-based images, and monochromatic images, could be added in order to explore their clinical values.
In conclusion, our results indicated that the combination of quantitative Spectral CT imaging parameters-namely, NIC during the PVP and ICratio provided high sensitivity and specificity for differentiating healthy liver from cirrhotic liver, especially Class C cirrhotic liver. With its qualitative and quantitative ability, Spectral CT may prove useful in the diagnosis and classification of liver cirrhosis.

Summary Statement

The use of Spectral CT could provide high sensitivity and specificity for differentiating healthy from cirrhotic liver, especially Class C cirrhotic liver, and could show the potential for differentiating liver cirrhosis at different levels.

Acknowledgments

The authors wish to thank Dr. Jianying Li for his technical support in understanding the dual energy spectral CT imaging mode.

References

1. Genant HK, Boyd D. Quantitative bone mineral analysis using dual energy computed tomography. Invest Radiol. 1977; 12:545–551. PMID: 591258.
crossref
2. Chiro GD, Brooks RA, Kessler RM, Johnston GS, Jones AE, Herdt JR, et al. Tissue signatures with dual-energy computed tomography. Radiology. 1979; 131:521–523. PMID: 441344.
crossref
3. Millner MR, McDavid WD, Waggener RG, Dennis MJ, Payne WH, Sank VJ. Extraction of information from CT scans at different energies. Med Phys. 1979; 6:70–71. PMID: 440238.
crossref
4. Louis O, Van den Winkel P, Covens P, Schoutens A, Osteaux M. Mineral content of vertebral trabecular bone: accuracy of dual energy quantitative computed tomography evaluated against neutron activation analysis and flame atomic absorption spectrometry. Bone. 1994; 15:35–39. PMID: 8024849.
crossref
5. Kelcz F, Joseph PM, Hilal SK. Noise considerations in dual energy CT scanning. Med Phys. 1979; 6:418–425. PMID: 492076.
crossref
6. Coursey CA, Nelson RC, Boll DT, Paulson EK, Ho LM, Neville AM, et al. Dual-energy multidetector CT: how does it work, what can it tell us, and when can we use it in abdominopelvic imaging? Radiographics. 2010; 30:1037–1055. PMID: 20631367.
crossref
7. Lv P, Lin XZ, Li J, Li W, Chen K. Differentiation of small hepatic hemangioma from small hepatocellular carcinoma: recently introduced spectral CT method. Radiology. 2011; 259:720–729. PMID: 21357524.
crossref
8. Alvarez RE, Macovski A. Energy-selective reconstructions in X-ray computerized tomography. Phys Med Biol. 1976; 21:733–744. PMID: 967922.
9. Kalender WA, Perman WH, Vetter JR, Klotz E. Evaluation of a prototype dual-energy computed tomographic apparatus. I. Phantom studies. Med Phys. 1986; 13:334–339. PMID: 3724693.
crossref
10. Fleischmann D, Boas FE. Computed tomography--old ideas and new technology. Eur Radiol. 2011; 21:510–517. PMID: 21249371.
crossref
11. Avrin DE, Macovski A, Zatz LE. Clinical application of Compton and photo-electric reconstruction in computed tomography: preliminary results. Invest Radiol. 1978; 13:217–222. PMID: 711396.
crossref
12. Johnson TR, Krauss B, Sedlmair M, Grasruck M, Bruder H, Morhard D, et al. Material differentiation by dual energy CT: initial experience. Eur Radiol. 2007; 17:1510–1517. PMID: 17151859.
crossref
13. Yeh BM, Shepherd JA, Wang ZJ, Teh HS, Hartman RP, Prevrhal S. Dual-energy and low-kVp CT in the abdomen. AJR Am J Roentgenol. 2009; 193:47–54. PMID: 19542394.
crossref
14. Lee MH, Cheong JY, Um SH, Seo YS, Kim DJ, Hwang SG, et al. Comparison of surrogate serum markers and transient elastography (Fibroscan) for assessing cirrhosis in patients with chronic viral hepatitis. Dig Dis Sci. 2010; 55:3552–3560. PMID: 20428950.
crossref
15. Silva RG Jr, Fakhouri R, Nascimento TV, Santos IM, Barbosa LM. Aspartate aminotransferase-to-platelet ratio index for fibrosis and cirrhosis prediction in chronic hepatitis C patients. Braz J Infect Dis. 2008; 12:15–19. PMID: 18553008.
crossref
16. Lautt WW. Regulatory processes interacting to maintain hepatic blood flow constancy: vascular compliance, hepatic arterial buffer response, hepatorenal reflex, liver regeneration, escape from vasoconstriction. Hepatol Res. 2007; 37:891–903. PMID: 17854463.
crossref
17. Aoki T, Imamura H, Kaneko J, Sakamoto Y, Matsuyama Y, Kokudo N, et al. Intraoperative direct measurement of hepatic arterial buffer response in patients with or without cirrhosis. Liver Transpl. 2005; 11:684–691. PMID: 15915492.
crossref
18. Hagiwara M, Rusinek H, Lee VS, Losada M, Bannan MA, Krinsky GA, et al. Advanced liver fibrosis: diagnosis with 3D whole-liver perfusion MR imaging--initial experience. Radiology. 2008; 246:926–934. PMID: 18195377.
crossref
19. Brenner D, Elliston C, Hall E, Berdon W. Estimated risks of radiation-induced fatal cancer from pediatric CT. AJR Am J Roentgenol. 2001; 176:289–296. PMID: 11159059.
crossref
20. Galbraith SM, Lodge MA, Taylor NJ, Rustin GJ, Bentzen S, Stirling JJ, et al. Reproducibility of dynamic contrast-enhanced MRI in human muscle and tumours: comparison of quantitative and semi-quantitative analysis. NMR Biomed. 2002; 15:132–142. PMID: 11870909.
crossref
21. Padhani AR, Hayes C, Landau S, Leach MO. Reproducibility of quantitative dynamic MRI of normal human tissues. NMR Biomed. 2002; 15:143–153. PMID: 11870910.
crossref
22. Jackson A, Jayson GC, Li KL, Zhu XP, Checkley DR, Tessier JJ, et al. Reproducibility of quantitative dynamic contrast-enhanced MRI in newly presenting glioma. Br J Radiol. 2003; 76:153–162. PMID: 12684231.
crossref
23. Takahashi H, Suzuki M, Ikeda H, Kobayashi M, Sase S, Yotsuyanagi H, et al. Evaluation of quantitative portal venous, hepatic arterial, and total hepatic tissue blood flow using xenon CT in alcoholic liver cirrhosis: comparison with liver cirrhosis C. Alcohol Clin Exp Res. 2007; 31(1 Suppl):S43–S48. PMID: 17331165.
crossref
24. Shim JH, Yu JS, Chung JJ, Kim JH, Kim KW. Segmental difference of the hepatic fibrosis from chronic viral hepatitis due to hepatitis B versus C virus infection: comparison using dual contrast material-enhanced MRI. Korean J Radiol. 2011; 12:431–438. PMID: 21852903.
crossref
Fig. 1
Distribution of 16 tubes with different concentrations of iodine solution.
Arrangement of 16 tubes (A, B) containing iodine solutions with different concentrations (0 to 30.0 mg/mL) at transverse monochromatic CT image obtained at 65-keV energy level.
kjr-13-434-g001
Fig. 2
Graph illustrates relationship between actual (x-axis) and measured (y-axis) iodine (I) concentrations in in vitro experiment. Test tubes filled with known iodine concentrations of 0.3-30.0 mg/mm3 were scanned with CT spectral imaging, and iodine concentrations were measured from iodine-based material-decomposition images. Mean and standard deviations for three separate measurements for same iodine concentration in each test tube (n = 13) are shown. Fitted line shows linear relationship between measured and actual concentrations.
kjr-13-434-g002
Fig. 3
Monochromatic and material decomposition images of cirrhosis.
Transverse (A, D) monochromatic CT image obtained at 70-keV energy level and (B, E) iodine-based and (C, F) water-based material-decomposition images obtained from single spectral CT acquisition (section thickness, 1.25 mm) in 63-year-old woman with cirrhosis B during AP and PVP respectively. AP = arterial phase, PVP = portal venous phase
kjr-13-434-g003
Table 1
Comparison between Actual and Measured Iodine Concentrations in In Vitro Experiment with Spectral Imaging
kjr-13-434-i001
Table 2
Quantitative Assessment, Thresholds, Sensitivities, and Specificities for Distinguishing Control Group from Study Group
kjr-13-434-i002

Note.- With exception of p values, data are mean values ± standard deviations. p values for comparisons between control group and study group. *Threshold NIC and ICratio are cited in milligrams per milliliter, Sensitivity values are cited as percentages. Data in parentheses represent number of cirrhotic livers in study group (n = 38), Specificity values are cited as percentages. Data are number of healthy livers in control group (n = 43). AP = arterial phase, ICratio = iodine concentration ratio, NIC = normalized iodine concentration, PVP = portal venous phase

Table 3
Quantitative Assessment among Control Group and Classes A-C of Study Group, Respectively
kjr-13-434-i003

Note.- With exception of p values, data are mean values ± standard deviations. *p values for comparisons between control group and Class A group, p values for comparisons between control group and Class B group, p values for comparisons between control group and Class C group. AP = arterial phase, ICratio = iodine concentration ratio, NIC = normalized iodine concentration, PVP = portal venous phase

Table 4
Thresholds, Sensitivities, and Specificities of Parameter for NIC, during PVP, for Distinguishing Control Group and Class A-C Groups, Respectively
kjr-13-434-i004

Note.- *Sensitivity values are cited as percentages. Data in parentheses represent, respectively, number of Class A liver cirrhosis (n = 10), Class B liver cirrhosis (n = 14) and Class C liver cirrhosis (n = 14) used to calculate percentages, Specificity values are cited as percentages. Data in parentheses represent number of healthy livers in control group (n = 43) used to calculate percentages. NIC = normalized iodine concentration, PVP = portal venous phase

Table 5
Thresholds, Sensitivities, and Specificities of Other Parameters for Distinguishing Control Group and Class C Group
kjr-13-434-i005

Note.- *Sensitivity values are cited as percentages. Data in parentheses represent number of Class C liver cirrhosis (n = 14) used to calculate percentages, Specificity values are cited as percentages. Data in parentheses represent number of healthy livers in control group (n = 43) used to calculate percentages. AP = arterial phase, ICratio = iodine concentration ratio, NIC = normalized iodine concentration

Table 6
Quantitative Assessment, Thresholds, Sensitivities, and Specificities among Class A-C Groups
kjr-13-434-i006

Note.- With exception of p values, data are mean values ± standard deviations. p values for comparisons among Class A, Class B and Class C groups. *Sensitivity values are cited as percentages. Between Class A-B and C, data in parentheses represent number of Class C liver cirrhosis (n = 14) used to calculate percentages, Specificity values are cited as percentages. Data in parentheses represent number of Class A (n = 10) and Class B liver cirrhosis (n = 14) used to calculate percentages. AP = arterial phase, NIC = normalized iodine concentration

TOOLS
Similar articles