

 PDF
PDF ePub
ePub Citation
 Print
Print


INTRODUCTION
Magnetic resonance imaging (MRI) and image analysis methods can track brain atrophy at multiple time-points, and have revealed fine-scale anatomical changes associated with cognitive decline (1, 2). An atlas-based method using three-dimensional T1-weighted magnetic resonance images (3D-T1WI) has been used to estimate local brain volume (3, 4). Signal intensity non-uniformity of 3D-T1WI is influenced by coil variation, repetition time (TR), and radio frequency uniformity (5, 6). Non-parametric non-uniform intensity normalization, commonly referred to as N3, was first proposed by Sled et al. (7) as a novel approach for correcting signal intensity non-uniformity in MRI (N3 software is publicly available at http://www.bic.mni.mcgill.ca/software/N3/). The correction is based on a non-parametric framework and thus operates without the presence of a statistical model for tissue classification. To explore suitable methods for correcting the signal intensity non-uniformity of 3D-T1WI, a previous study evaluating the performance of six correction methods was consulted, and reported that the N3 correction demonstrated a high degree of stability (8). Another study reported that the N3 correction reduced coil-type and pulse-sequence differences, indicating improved reproducibility using tensor-based morphometry (9). The N3 correction is the most commonly used method in comparative evaluation (10). None of these previous reports; however, investigated the effect of the N3 correction with regard to atlas-based volumetry (3, 4). The aim of the present study was to examine the change in the ratio of the compartment volume to assess whether the N3 correction and change in the bias correction setting in Statistical Parametric Mapping 5 (SPM5) (11) affect system dependency in brain volumetry using an atlas-based method.
MATERIALS AND METHODS
Subjects
A total of 21 healthy volunteers participated in this study (17 males, 4 females; mean age: 31.1 ± 7.4 years; age range: 23-47 years). Using 1.5- and 3-tesla MRI systems, 3D-T1WIs were obtained from each subject on the same day. The MR images were inspected by a board-certified radiologist (O.A.), who found none of the following findings in any subject: brain tumor, infarction, hemorrhage, brain atrophy, cognitive impairment, or white matter lesions graded higher than 2 using Fazekas's classification scale (12). The study protocol was approved by the Ethical Committee of our institution. After the study had been explained to each subject, written informed consent was obtained from all participants.
MRI Scanning Protocol
We employed the Alzheimer's Disease Neuroimaging Initiative (ADNI) (13) scanning protocol (http://www.loni.ucla.edu/ADNI/Research/Cores/index.shtml). MRI data were obtained using five systems: 1) The GE 3 tesla phased-array (GE 3T PA) coil / quadrature (QD) coil protocol was used when MRI data were obtained using a 3.0-T scanner (Signa EXCITE HDx, GE Medical Systems, Waukesha, WI, USA) for both protocols; 2) The GE 3T PA coil protocol was used when a phased-array coil was used for reception; 3) The GE 3T QD coil protocol was used when a quadrature head coil was used for send-receive. Otherwise, the conditions were the same for both protocols: three-dimensional magnetization-prepared rapid gradient echo (MP-RAGE) was used to obtain 170 contiguous sagittal 3D-T1WIs with a slice thickness of 1.3 mm, repetition time/echo time = 2300/2.8 ms, inversion time = 900 ms, flip angle = 8°, field of view = 26 cm, number of excitations = 1, and pixel matrix = 256 × 256; 4) MRI data were obtained via the GE1.5T protocol, which used a 1.5-T scanner (Signa EXCITE HDx, GE Medical Systems, Waukesha, WI, USA). A quadrature head coil was used for send-receive; 5) Three-dimensional MP-RAGE was used to obtain 184 contiguous sagittal 3D-T1WI with a slice thickness of 1.3 mm, repetition time/echo time = 3000/3.9 ms, inversion time = 1000 ms, flip angle = 8°, field of view = 24 cm, number of excitations = 1, and pixel matrix = 192 × 192.
Siemens protocol: MRI data were obtained using a 1.5-T scanner (MAGNETOM Avanto, Siemens Medical Solutions, Erlangen, Germany). A head matrix coil was used for reception. Three-dimensional MP-RAGE was used to obtain 160 contiguous sagittal 3D-T1WI with a slice thickness of 1.3 mm, repetition time/echo time = 2400/3.6 ms, inversion time = 1000 ms, flip angle = 8°, field of view = 24 cm, number of excitations = 1, and pixel matrix = 192 × 192.
Toshiba protocol: MRI data were obtained using a 1.5-T scanner (EXCELART Vantage, Toshiba Medical Systems, Tokyo, Japan). A quadrature coil was used for send-receive. Three-dimensional MP-RAGE was used to obtain 165 contiguous sagittal 3D-T1WI with a slice thickness of 1.3 mm, repetition time/echo time = 2400/4.0 ms, inversion time = 1000 ms, flip angle = 8°, field of view = 24 cm, number of excitations = 1, and pixel matrix = 192 × 192.
Image Preprocessing for Atlas-Based Volumetry
We used SPM5 software for the volumetric analysis. In SPM5, 3D-T1WI in native space were bias-corrected, spatially normalized, and segmented into gray matter, white matter, and cerebrospinal fluid images. The voxel size of the spatially normalized images was 2 × 2 × 2 mm. During the modulation step in SPM5, we multiplied the voxel values of the spatially normalized gray and white matter images by a measure of the relative volumes of the warped and unwarped structures that were derived from the nonlinear step of spatial normalization (Jacobian determinant).
We applied six different bias-correction levels in SPM5 preprocessing (Regularization 10, Regularization 0.0001, Regularization 0, Regularization 10 with N3, Regularization 0.0001 with N3, and Regularization 0 with N3) to each set of images, resulting in 60 prepared images for each subject (five magnetic resonance protocols × six bias-correction levels × spatially normalized gray matter and white matter). The options for the N3 method are that %nu_options = ("1.5",'''-normalize -stop 0.0001 -fwhm 0.05 -distance 150 -iterations 10000 -shrink 2''', "3.0",'''-normalize -stop 0.0001 -fwhm 0.05 -distance 50 -iterations 10000 -shrink 2'''). We used a default value with N3 because we wanted to retain the comparability with previous studies. However, we reduced the distance of the option for N3 in 3T because the signal heterogeneity of 3T image was large compared with the 1.5T image (7).
Measurement of Structural Volume Using the Atlas-Based Method
The region-of-interests (ROIs) for measurement of structural volume using the atlas-based method were obtained by WFU-PickAtlas (3, 4). The ROI labels used were those provided as default settings by the software: white matter, temporal lobe, parietal lobe, occipital lobe, and the hippocampus. White matter volume was measured using the normalized white matter data described in Section 'Image preprocessing for atlas-based volumetry'. The temporal lobe, parietal lobe, occipital lobe, and hippocampal volumes were measured using the normalized gray matter data described in Section 'Image preprocessing for atlas-based volumetry'.
The change ratio (%) of structural volume was defined as the change ratio (%) = (100 × [measured volume - mean volume of five magnetic resonance protocols] / mean volume of five magnetic resonance protocols) for each bias-correction level. A low change ratio is synonymous with lower system dependency.
RESULTS
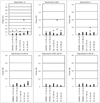
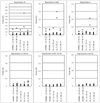
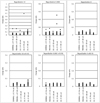
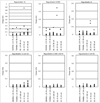
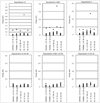
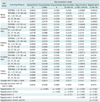
The change ratio (%) of structural volume for each ROI is shown in Figures 1-5. Figure 1 shows the change ratio of structural volume for white matter. Visually, the smaller Regularization values had a decreased change ratio. That is, the result showed that increasing bias-correction power (i.e., Regularization 10 < 0.0001 < 0 < 0 with N3) increased the effect on signal intensity non-uniformity correction; this trend was strongest for the GE 3T PA coil protocol. The lowest change ratio was achieved using "Regularization 0 with N3". Results in the temporal lobe (Fig. 2), parietal lobe (Fig. 3), occipital lobe (Fig. 4), and hippocampus (Fig. 5) show a similar trend. In addition, all figures were summarized in Table 1.
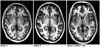
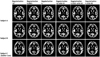
In white matter, the maximum value of the change ratio was 0.475% for the GE 3T PA coil protocol with Regularization 10; the maximum value for this protocol with Regularization 0 and with N3 was 0.015%. In the temporal lobe, the maximum value of the change ratio was 0.700% for the GE 3T PA coil protocol with Regularization 10; however, the maximum value in with Regularization 0 with and N3 was 0.024%. In the parietal lobe, the maximum value of the change ratio was 0.677% for the GE 3T PA coil protocol with Regularization 10, but the maximum value in with Regularization 0 with and N3 was 0.042%. In the occipital lobe, the maximum value of the change ratio was 0.854% for the GE 3T PA coil protocol with Regularization 10, but the maximum value with Regularization 0 and N3 was 0.020%. In the hippocampus, the maximum value of the change ratio was 0.646% in for the GE 3T PA coil protocol with Regularization 10, but the maximum value with Regularization 0 with and N3 was 0.057%. In addition, T1WIs of the GE 3T PA coil protocol with native space were shown in the Figure 6, and normalized gray matter images of the GE 3T PA coil protocol were shown in the Figure 7.
DISCUSSION
While the increased statistical power inherent in multicenter studies can provide additional information over single-center studies, similar acquisition protocols must be used in all cases to avoid possible system differences between sites (14). Building on the experience of previous multicenter studies in anatomical imaging (15, 16), the ADNI group took great care to define an optimized mandatory MP-RAGE imaging protocol across all sites (13), and employed correction for signal intensity non-uniformity differences. Accordingly, the precision of the computational analyses of compartment volume is affected by these differences (17).
Previous studies have shown low variability in volumetric measures obtained from repeated scans using the same protocol (17). It may be considered that the much higher variance that occurs across numerous protocols, which indicates the limited robustness of the segmentation procedure. To a lesser extent, combining images from different field strengths may be justified as a timesaving procedure that enables researchers to obtain a large number of images in a short time. However, variations in the imaging parameters, such as those caused by the use of different field strengths, may result in image changes that are independent of the biological characteristics of the tissue, instead of reflecting the physics of the imaging process (18). Therefore, because within-system variability is low, repeated scanning under the same conditions is strongly advised for a longitudinal study. However, variance in brain volume due to disease-related change is much less than that occurring naturally because of variance within a healthy population. For example, (1) there is natural variance in gender-related differences in brain volume of 8.9%, and (2) the difference in brain volume caused by disease-related change is 2.2% between Alzheimer's disease patients and healthy controls (19). Thus, it is important to improve the precision of MR imaging.
Computational analyses [i.e., boundary shift integral (20), voxel-based morphometry (21, 22), tensor-based morphometry (23), and atlas-based volumetry (3, 4)] used to evaluate brain volume have already been shown to be sensitive to image quality (i.e., signal-to-noise ratio, signal intensity non-uniformity, and image distortion) (9, 13, 24-27). Therefore, it is important to control the image quality in multi-scanner studies. In correcting the non-uniformity of signal intensity, Arnold et al. (8) previously reported that the root-mean-squared error is close to 4.0 for N3-corrected T1 images, which implies that the applied bias has been nearly completely removed. In addition, Boyes et al. (28) showed that the use of N3 correction resulted in a statistically significant improvement in signal intensity non-uniformity. Therefore, among several algorithms, we chose the N3 algorithm to correct for signal intensity non-uniformity.
The lowest change ratio for local brain volumetry using the atlas-based method was achieved using "Regularization 0 with N3", with all other parameters set at the same conditions. The results shown in Figures 1-5 are consistent with those of a previous study (9) that described the N3 correction effect for tensor-based morphometry in different scan systems. In addition, we found that decreased change ratios are correlated with increased bias-correction power (i.e., Regularization 10 < 0.0001 < 0 < 0 with N3). Brain of subject C is big and long compared with other subjects (Fig. 6). Therefore, we think that subject C had more 0.1 change ratios because of the improvement in signal intensity non-uniformity by the correction with SPM5 was insufficient.
The present study is the first to clarify the effect of bias-correction level on an atlas-based method with SPM5 preprocessing, and showed that system dependency is reduced by the N3 correction. This result does not prove that signal intensity non-uniformity correction completely erases system dependency, but it does provide an insight into understanding the necessity for using the signal intensity non-uniformity correction in multi-site studies. Even in a study using a single system, the analytical results are influenced by signal intensity non-uniformity because the distribution of signal intensity is influenced by the spatial placement of the coil center and the brain center, and this spatial placement in imaging differs among subjects (29).
A major limitation of the present study is that the reliability and robustness of the N3 algorithm for correcting non-uniformity could be improved by the optimal selection of brain masks and smoothing parameters (28).
The second limitation is an atlas-based method itself, for estimating volumes of specific areas, induces error from the true volume. Therefore, we must the understand deviation of the measured volume from the true volume, and must do work to decrease deviation. However, we cannot know the true brain volume. In the present study, we were able to demonstrate only how the system dependency was reduced by signal intensity non-uniformity correction in brain volumetry using the atlas-based method. We could not show that brain volumetry using the atlas-based method with signal intensity non-uniformity correction provides a more accurate estimate of brain volume. However, it is known that signal intensity/non-uniformity causes segmentation errors. Improvement of the volumetry precision is a required assignment in multi-site imaging trials. In addition, it is ideal to improve accuracy.
The third limitation is that we cannot deny that variations for the fundamentally inaccurate atlas-based volumetry may be reduced by the N3 correction. However, the previous study showed the relatively high reproducibility in atlas-based volumetry (24), and reported that the N3 correction demonstrated a high degree of stability for the signal intensity non-uniformity correction (8). In addition, visually, the smaller Regularization values had a decreased change ratio in present study. Therefore, we believe that system dependency was reduced by N3 correction. In conclusion, to the best of our knowledge, the present study is the first atlas-based study to clarify the effect of bias-correction level on brain volumetry, and showed that system dependency was reduced by the N3 correction. This study could help investigators evaluate the impact of combining data from different MRI systems in a multisite study.
 XML Download