

 PDF
PDF ePub
ePub Citation
 Print
Print


INTRODUCTION
Crossed cerebellar diaschisis (CCD) is a depression in neuronal metabolism and activity characterized by decreased brain perfusion in the cerebellar hemisphere contralateral to a supratentorial infarct (1, 2). Interruption of the cortico-ponto-cerebellar pathways is thought to most likely be a mechanism of remote transneuronal metabolic depression and deafferentation of the contralateral cerebellar hemisphere (3). Irreversible morphological changes such as volume loss are seen in patients suffering from chronic CCD (4). Various nuclear medicine-based studies have shown that CCD severity is an important valuable prognostic factor in with respect to recovery time and treatment outcome of stroke patients (5, 6).
A majority of available radiological reports on CCD are based on single-photon emission computed tomography (SPECT) and positron emission tomography (PET). Some recent reports are based on dynamic susceptibility contrast perfusion magnetic resonance (MR) imaging (7, 8). Even though computed tomography perfusion (CTP) imaging is used to study brain perfusion in cases of acute stroke, imaging studies of CCD based on CTP have not yet been reported. The fundamental reason for this is that the narrow spatial coverage of CTP presents difficulties in providing sufficient scanning of the whole brain. With the development of multichannel CT technologies, it has recently become possible to provide perfusion images of almost the entire brain. Therefore, we conducted a study to determine the rate at which CCDs can be detected by CTP imaging in patients with acute stroke. We also performed a quantitative analysis of perfusion values to identify factors that depict a CCD on CTP images.
MATERIALS AND METHODS
Study Design
The study was conducted as a retrospective review of imaging data obtained from a standard clinical stroke care unit at our hospital with the approval of our Institutional Review Board. Informed consent was waived due to the retrospective nature of our study. Inclusion and exclusion criteria were as follows:
Inclusion criteria
1) Admission to the emergency room with signs and symptoms suggestive of a supratentorial stroke (e.g., aphasia, apraxia, visual field defects, functional memory deficits).
2) Diagnosis in an emergency setting by means of dynamic CTP using a 64-channel multidetector CT (MDCT) within 24 hours of symptom onset.
3) Follow-up MR imaging including diffusion-weighted imaging (DWI) to confirm hemispheric supratentorial infarct.
Exclusion criteria
1) Concomitant cerebellar pathology revealed by MR imaging including DWI, T1/T2 weighted imaging, fluid attenuated inversion recovery, and MR angiography (MRA).
2) History of any other cerebral pathology such as hemorrhage, tumor, or infection, with the exception of infarct.
3) Small lesion showing diffusion restriction on DWI but negative perfusion abnormality on CTP (such as lacunar infarction).
4) Previous history of supratentorial infarction.
Patient Characteristics
Eighty-one acute stroke patients who met the above criteria were included in our study after a retrospective review of the imaging data in 444 consecutive patients with acute stroke symptoms who were admitted to our institution between January 2007 and May 2010. The 363 patients who were excluded showed symptoms and signs of acute stroke when they visited the hospital, and symptom onset was indeed less than 24 hours before admission; however, this group included 95 patients for whom lacunar ischemic stroke and 54 patients for whom a transient ischemic attack was diagnosed upon follow-up MR imaging as well as 214 patients for whom MR imaging revealed a concomitant cerebellar pathology (n = 162) or remote supratentorial lesion (n = 52).
Imaging Protocols and Processing
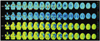
The CTP datasets were obtained by using a 64-channel MDCT (Brilliance 64, Philips Medical Systems, The Netherlands) scanner with a 40-mm detector using the toggling-table technique (Fig. 1). The CTP acquisition parameters were as follows: 80 kVp, 150 mAs, 32 × 1.25 detector collimation, 5-mm slice thickness, and a scanning speed of 0.4 seconds per rotation. Iodinated contrast material (80 mL of iohexol 350 mg I/mL) was injected at a rate of 5 mL/s via the antecubital vein, and scanning commenced 5 seconds after injection. Using the toggling-table technique, axial scanning was repeated at two table positions in a to-and-fro fashion. A total of 15 continuous dynamic scans were acquired at 3.8-second intervals. The technique provided 16 imaging slices each measuring 5-mm in thickness (Fig. 2).
The CTP datasets were analyzed with the use of brain perfusion software (Extended Brilliance Workstation, Philips Medical Systems). The software uses the central volume principle to calculate perfusion parameters from the time/concentration curve (9). The software performs curve fitting by a least mean squares method to obtain mathematical descriptions of the time/attenuation curves, and the mean transit time (MTT) map is then calculated via a closed-form deconvolution operation using the time/concentration curve of a particular voxel and the arterial input function (AIF) (10, 11). The AIF was selected by placing a small circular region of interest (ROI) within the earliest-appearing and most densely enhancing artery. An appropriate vein was selected to represent venous function by placing a circular ROI within the superior sagittal sinus. For each voxel, the cerebral blood volume (CBV) map was calculated from the areas under the time/concentration curves (12). The cerebral blood flow (CBF) map for each voxel was then calculated according to the following equation combining the CBV and MTT values: CBF = CBV / MTT (10). TTP is defined as the time required to attaining peak enhancement according to the time/concentration curve.
Follow-up MRI (3.0T Achieva, Philips Medical Systems) included T1-weighted (TR, 308 msec; TE, 10 msec; flip angle [FA], 90°; section thickness, 5 mm; matrix, 256 × 193; field of view [FOV], 23 × 23 cm), T2-weighted (TR, 2024 msec; TE, 80 msec; FA, 90°; echo-train length, 8; section thickness, 5 mm; matrix, 400 × 312; FOV, 23 × 23 cm), fluid-attenuated inversion recovery (TR, 9000 msec; TE, 125 msec; FA, 120°; inversion time [TI], 2600 msec; section thickness, 5 mm; matrix, 352 × 210; FOV, 23 × 23 cm), DWI (b-value,1000 s/mm2; TR, 4290 msec; TE, 68 msec; section thickness, 5 mm; matrix,120 × 120; FOV, 23 × 23 cm) and MRA (TR, 25 msec; TE, 3.5 msec; FA, 20°; section thickness, 0.6 mm; matrix, 704 × 658; FOV, 20 × 20 cm).
Image Interpretation and Quantitative Analysis
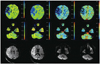
Perfusion CT images from patients that met the inclusion criteria and none of the exclusion criteria were visually inspected by two neuroradiologists to identify areas of abnormal perfusion (low CBV, low CBF, delayed MTT, and delayed TTP), i.e., ischemic lesions. The criteria for CCDs include a unilateral supratentorial ischemic lesion and an accompanying decrease in perfusion of the contralateral cerebellar hemisphere on CTP (Fig. 3). Differences in judgment between the two observers were discussed until a consensus was reached.
1) Measurement of cerebral and cerebellar perfusion values on the perfusion maps.
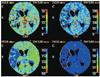
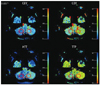
An area of interest was first drawn in the abnormal perfusion area seen in the cerebral hemisphere, and was then mirrored to the contralateral hemisphere on each CTP map (MTT, TTP, CBF, and CBV maps) (Fig. 4). Within the circular ROI drawn on the cerebellum, quantitative values were obtained; values were also obtained on the other side by means of mirror imaging (Fig. 5).
2) Quantifying the degree of cerebral perfusion abnormality.
To quantify the reduction in perfusion, a representative transaxial slice showing the greatest degree of asymmetry was chosen; differences in TTP and MTT (defined as TTPipsilateral - TTPcontralateral in the cerebrum and MTTipsilateral - MTTcontralateral in the cerebrum), as well as the reduction rate (defined as [CBFcontralateral - CBFipsilateral/CBFcontralateral × 100%] in the cerebrum and [CBVcontralateral - CBVipsilateral/CBVcontralateral × 100%] in the cerebrum) were calculated.
3) Determining the volume of a lesion represented by abnormal perfusion in the cerebrum.
CTP maps were computed by manually segmenting the abnormal perfusion area and by multiplying the lesion area by the slice thickness for all sections in each CTP map.
4) Asymmetry index
To quantify the degree of CCD severity in the cerebellum, a representative transaxial slice showing the greatest degree of asymmetry was chosen, and the interhemispheric value was calculated; differences in TTP and MTT (defined as TTPcontralateral - TTPipsilateral in the cerebellum and MTTcontralateral - MTTipsilateral in the cerebellum), as well as the reduction rate (defined as [CBFipsilateral - CBFcontralateral/CBFipsilateral × 100%] in the cerebellum and [CBVipsilateral - CBVcontralateral/CBVipsilateral × 100%] in the cerebellum) were calculated.
Statistical Analysis
Differences in the mean values of continuous variables between the CCD-positive and CCD-negative patients were analyzed by an independent-samples t test. Relationships between variables (supratentorial ischemic volume, degree of reduction in perfusion values, and infratentorial asymmetry index) were analyzed by Spearman's rank correlation coefficient. The significance level for all tests was p < 0.05.
RESULTS
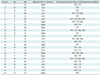
Twenty-five of the 81 study patients showed abnormal asymmetric cerebellar perfusion and were identified as CCD-positive patients (Table 1). There was no significant difference in mean age between the two groups of patients (CCD-positive, 73.2 ± 11.5 years; CCD-negative, 67.5 ± 9.0 years; p = 0.056, t test). Also, none of the 25 CCD-positive patients showed signs of cerebellar dysfunction. Abnormality was detected on the cerebellar perfusion maps as follows: MTT, 25 cases (31%); TTP, 17 cases (21%); CBF, seven cases (9%); CBV, five cases (6%).
Supratentorial ischemic volume on each CTP map, differences in MTT and TTP, and the rates of reduction in CBV and CBF obtained by quantitative analysis did not differ significantly between the CCD-positive and CCD-negative groups (Table 2). The correlation analysis of supratentorial ischemic volume on each CTP map for differences in MTT and TTP, rates of CBV and CBF reduction, and the infratentorial asymmetry index in CCD-positive cases show a positive and significant linear correlation between the cerebral ΔMTT and cerebellar ΔMTT (Table 3). In addition, a positive and significant linear correlation was found between the cerebral ΔMTT and cerebellar ΔTTP, cerebral ΔTTP and cerebellar ΔTTP, reduced cerebral CBF volume and cerebellar ΔTTP, and reduced cerebral CBV volume and cerebellar ΔTTP (p < 0.05) (Table 3).
DISCUSSION
Ever since CCD was first observed by Monakow in 1914 (13), SPECT, PET, and dynamic susceptibility contrast perfusion MR imaging have been used to evaluate CCD in stroke patients (5-7, 14-16). Recent improvements in MDCT including the toggling-table technique have allowed the measurement of whole-brain perfusion (17, 18). CTP has several advantages over other imaging modalities in terms of cost, patient tolerance, accessibility, scan time, and image resolution; especially in the setting of acute strokes (19). In our study, we used four perfusion maps to identify CCD in our acute stroke patients. MTT was the most sensitive perfusion map (25 cases, 31%) representing CCD, but CBV also decreased in five cases (6%), unlike the result of a previously reported MRI study in which CBV maps did not reveal a perfusion abnormality in CCD-positive patients (7). Even though PET has revealed CCD in patients within the first 3 hours after the onset of stroke symptoms (6), there is no published data on the nuclear imaging detection rate in acute stroke patients; the only related finding is a 50% diagnosis rate associated with mixed stroke chronicity (8, 20, 21). Therefore, it is difficult to compare the detection rates directly. In comparison to results of an MRI study that focused on patients with acute stroke within 5 days of symptom onset (7), we obtained a higher detection rate (MTT, 31% versus MRI, 16%).
There is still debate in the literature regarding the correlation between the severity of CCD and infarct volume. In some reports, the amount of low perfusion volume in the supratentorial brain is described as one of the factors that affect the development of CCD (5, 6, 22). However, we found no relation between the volume of cerebral perfusion abnormality and the development of CCD. Regarding the relations between cerebral variables (perfusion variables) and the infratentorial asymmetry index in CCD-positive cases, our results show that cerebellar ΔTTP with cerebral ΔMTT, ΔTTP, reduced CBF volume, reduced CBV volume, and cerebellar ΔMTT with cerebral ΔMTT all being statistically significant and having a positive linear correlation. This finding suggests that several cerebral variables are related to CCD severity, and these can be seen via CTP imaging. A reported PET study of acute stroke revealed a similar significant correlation between supratentorial hypoperfusion volume and CCD severity (5).
Our study was limited by the small size of the patient group (25 patients). For a meaningful conclusion, further study in a large patient series is needed. Second, although CTP imaging with 64-channel MDCT and use of the toggling-table technique can cover 80 mm, this coverage area is not really the whole brain. There remains the possibility of excluding some parts of the lower infratentorial or superior vertex region during brain scanning. With further development of MDCT technology, this problem will be solved, and more accurate CTP imaging-based diagnosis can be expected in CCD patients (23).
In conclusion, CCD presenting as abnormal perfusion in the cerebellum contralateral to acute cerebral infarct can be revealed by CTP imaging on all four types of perfusion maps (MTT, TTP, CBF, and CBV). Even though whole-brain CTP imaging has some technical shortcomings, CTP, particularly in conjunction with MDCT, appears to be a valuable imaging tool for evaluating CCD in stroke patients.


 XML Download