

 PDF
PDF ePub
ePub Citation
 Print
Print


INTRODUCTION
Angiogenesis involves the formation of new capillaries from existing blood vessels and is an essential component of normal physiological as well as pathological processes. Tumors require angiogenesis for growth and tumor progression (1, 2). Methods for assessing the status of angiogenesis are valuable when evaluating cancer response to therapy. Microvessel density (MVD) has been used to evaluate the angiogenic activity of tumors (3). However, it does not reflect the functional status of the tumor vasculature, and invasive methods are necessary for obtaining specimens.
Permeability of a tumor vessel also reflects the angiogenic activity of the tumor (4, 5). T1 weighted dynamic contrast enhanced magnetic resonance imaging (DCE-MRI) has been proposed as a non-invasive method of assessing the permeability of the tumor vessel (6-9). Transendothelial permeability, capillary surface area, and lesion leakage space can be measured using quantitative parameters based on the two-compartment Tofts model on the condition that the exchange of contrast agent occurs only between the intravascular space and the tumor interstitial space (6). Ktrans stands for the volume transfer constant of the contrast agent, determining the rate at which the contrast media passes from the intravascular space into the tumor interstitial space. The back diffusion of contrast agent from the interstitial space of the tumor into the intravascular space is determined by the rate constant Kep. Ve represents the extravascular-extracellular leakage space. Because of the variability of derived quantitative parameters from T1-weighted DCE-MRI according to tissue characteristics and cancer type (7-9), correlating quantitative parameters with MVD would help to interpret the validity and meaning of the measured parameters. Reduction of microvessel blood flow after radiation therapy in locally advanced rectal cancer patients was correlated with decreased endothelial transfer coefficient value and MVD, as reported by de Lussanet et al. (10). Tuncbilek et al. (11) reported that the parameters from the time-intensity curves of DCE-MRI was correlated with postoperative MVD, histologic grade, and presence of metastasis. Zhang et al. (12) reported that the time to peak was negatively correlated with MVD and vascular endothelial growth factor (VEFG) in rectal cancer. Ceelen et al. (13) reported that radiation therapy reduces tumor vascular leakage and enhances tissue oxygenation, which was correlated with reduced Ktrans and Ve of DEC-MRI and not correlated with MVD or VEGF expression in the colorectal tumor rat model.
In this study, we investigated the correlation between the quantitative DCE-MRI parameters and MVD in human-colon-cancer xenograft mouse models of various sizes using a clinical 3 Tesla (T) scanner.
Go to : 
MATERIALS AND METHODS
Experimental Model
The study protocol was approved by the local ethics committee for animal care and use. Experiments were performed in 10 adult (5-week-old) (SLC, Kotoh-cho, Japan) female nude mice, each weighing 17-20g. A human DLD-1 colon cancer cell suspension (1 × 10⁶ cells in 100 µL phosphate buffered saline) was injected subcutaneously into the right hind limbs of the mice. Tumors were allowed to grow for approximately 7 to 14 days, until reaching a predetermined size, the longest diameter of which ranged from 0.6 cm to 2 cm.
Dynamic Contrast Enhanced MRI
All MRI studies were performed using a 3T MR scanner (MAGNETOM Tim Trio, Siemens Healthcare, Erlangen, Germany) with a four-phased array wrist coil. Mice were placed prone in a plastic holder for ease of fixation and injection of contrast agent, and an inhaled anesthesia was used to avoid movement during imaging. Anesthesia was maintained with 2% isoflurane in a mixture of 100% 1 L/min oxygen. The tail vein was cannulated for intravenous injection of gadolinium contrast agent.
All images were obtained in the transverse plane using the following sequences: transverse T2-weighted turbo spin-echo (TSE) sequence (repetition time [TR] msec/echo time [TE] msec) 4930/128, echo train length of 25, one signal acquired, matrix of 114 × 192) applied with a section thickness of 1.0 mm, an intersection gap of 1.1 mm, and a flip angle of 160°. The field of view was 35 × 60 mm2, which included the tumor in its entirety (20 sections) with a resultant voxel size of 0.3 × 0.3 × 1.0 mm3.
Dynamic contrast-enhanced MR imaging included two precontrast T1-weighted measurements (3D VIBE, TR/TE 8.3/2.3, 20 axial slices [slice thickness, 1.04 mm], field of view 50 × 50 mm, matrix 90 × 128) with different flip angles (2°, 15°) to determine the T1 relaxation time in the blood and tissue before the arrival of contrast agent on a pixel-by-pixel basis. This was followed by T1-measured dynamic contrast-enhanced series using a TWIST sequence (TR/TE 5.8/2.4, flip angle of 12°, and all other parameters the same as for the precontrast image).
Sixty dynamic measurements were performed on the entire volume of 20 sections. The acquisition time was 6.2 seconds with a single dynamic measurement. After the first five measurements, an intravenous bolus of gadopentetate dimeglumine (Magnevist; Schering, Erlangen, Germany) at a concentration of 0.05 mmol/mL was administered by manual injection at a dose of 0.3 mmol/kg over a maximum period of five seconds. The results of a previous pilot study showed that this dose of contrast agent provides maximal signal enhancement with the same sequence used in this study (data not shown).
The scanned data were transferred onto an image processing workstation (Leonardo, Siemens Healthcare, Erlangen, Germany) and analyzed using Tissue4D® software (Siemens Healthcare, Erlangen, Germany). A value for the arterial input function was automatically calculated by the software without an arterial region of interest (ROI) measurement procedure. To verify the applicability of the programmed arterial input function, the enhancement pattern of the normal thigh muscles opposite to the tumor was also analyzed. All mice showed similar patterns of enhancement in muscle ROI, with minimal variation between animals.
Tumor ROI was drawn at the midpoint along the z-axis of the mass by a third-year resident under the supervision of a senior radiologist. Two ROIs were drawn and measured for each mouse. ROI 1 covered the whole transection area of the tumor. ROI 2 covered only the hotspot area in the tumor. Hotspots in the MR images were selected to be matched with a hotspot in immunohistochemical staining. Dynamic data from ROIs 1 and 2 were fitted pixel by pixel to a pharmacokinetic model described by Tofts et al. (6), of which the quantitative parameters Ktrans, Kep, and Ve, were calculated.
Histopathological Analysis
After DCE-MRI is performed, the tumor was dissected from the surrounding tissue under ether anesthesia and sterile conditions. The mice were euthanized at the end of the surgical procedure in a CO2 chamber. The dissected tumor was fixed with 10% formaldehyde solution and preserved at 4℃ for 24 hours. Then, 6 µm thick slide sections were made to correspond with the MR images. Immunohistochemical staining was also performed as follows: Deparaffinized slide sections were incubated with an anti-CD31 primary monoclonal antibody (Abcam, Cambridge, MA) followed by incubation with a biotinylated secondary antibody. The sections were then incubated with avidin-biotinylated peroxidase complex reagent and binding reactions were visualized using 3,3-diaminobenzidine (DAB). The stained microvessels were heterogeneous and the areas of highest neovascularization were mostly found at the periphery of the tumor. When scanned in a low-power field (100 ×), highly vascularized areas were considered to be hotspots. Three hotspots were examined respectively and vessels were manually counted in a high-power field (200 ×) with ocular grids. The grading and counting method described by Weidner et al. (14) was adapted for evaluation of MVD. Any brown-stained endothelial cell or endothelial cell cluster that was clearly separate from the adjacent microvessels, tumor cells, and other connective tissue elements was considered as a single countable microvessel. The sum of counts per field (total area = 0.578 mm2) represented a single hotspot. The highest vessel count among the three hotspots was used as the MVD. Hematoxylin and Eosin staining was performed in a consecutive slide to confirm to tumor necrosis. The area including the hot spots was scanned with low-power fields (2 ×, 40 ×). The outer tumor border and tumor necrosis was manually circumscribed by using Image J software (NIH, Bethesda, MD). Then, the total pixel area of the tumor and necrotic region was automatically calculated. Histological necrotic fraction (NF) was defined as the division of total pixel area of necrosis by the total pixel area within the tumor border.
Statistical Analysis
The mice were divided into two subgroups according to their Ktrans, Kep, and Ve values. If a parameter was less than the median value, the mouse was assigned to the "low" group. And, if a parameter was above the median value, then the mouse was assigned to the "high" group. The Mann-Whitney test was performed to validate the differences in MVD between the low and high groups according to each parameter. The relationship between MVD, perfusion parameters and necrotic fraction of the tumor was examined by Spearman's correlation analysis. The correlation coefficient (τ) expresses the degree of change in the two corresponding variables. A coefficient closer to 1 indicates a positive correlation and a coefficient closer to -1 indicates a negative correlation. Statistical significance was accepted with a p value of less than 0.05. Statistical analyses were performed using computer software (PASW Statistics 18; SPSS Inc., Chicago, IL).
Go to :
RESULTS
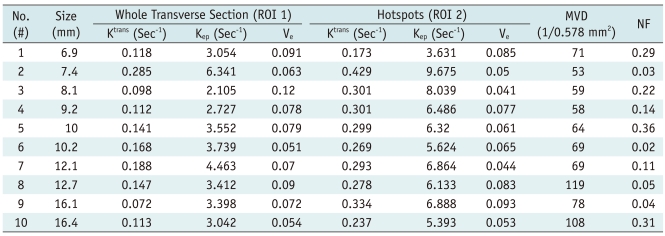
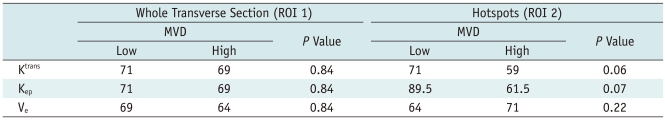
Tumor size, DCE-MRI derived parameters, and MVD of 10 nude mice are summarized in Table 1. The range in tumor size was 7.4 to 16.4 mm (average, 10.9 ± 3.3 mm). Table 2 describes the difference in the MVD value between the low and high value groups at each DCE-MRI parameter. In the case of the whole transverse ROI, there was no difference in MVD values between the low and high groups. However, in the case of hotspots, the median value of Ktrans and Kep in the low group was higher than that of the high group. Although these differences did not reach statistical significance (p = 0.06 in Ktrans, p = 0.07 in Kep), a box and whisker plot clearly showed the separated distribution of MVD of the two groups (Fig. 1). According to Spearman's correlation analysis, perfusion parameters from whole transverse ROI did not show a significant relationship with MVD, while Ktrans and Kep from hotspot ROI showed marginally significant correlations with MVD (Table 3). Scatter diagrams demonstrated the inverse correlation between MVD with Ktrans and Kep (r = -0.61, p = 0.06 in Ktrans; r = -0.60, p = 0.07 in Kep) (Fig. 2). The necrotic fraction of the tumor did not show a significant relationship with the perfusion parameters regardless of ROI (p = 0.27 for Ktrans, p = 0.12 for Kep, p = 0.17 for Ve in whole transverse section and p = 0.37 for Ktrans, p = 0.28 for Kep, p = 0.68 for Ve in hotspots).

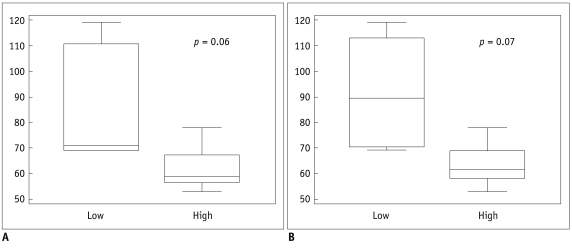 | Fig. 1Box whisker plot of microvascular density evaluating region of interest drawn on hotspots.
Distribution of low and high groups is shown in Ktrans (A) and Kep (B).
|
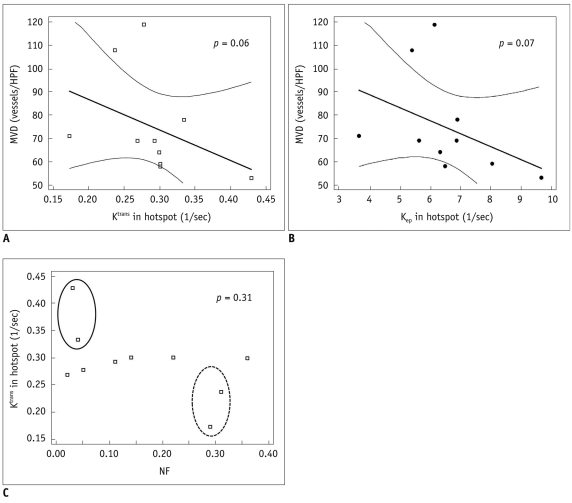 | Fig. 2Representative scatter diagrams showing relationships between microvascular density, necrotic fraction, and dynamic contrast enhanced MRI derived parameters from hotspots.
A, B. Ktrans and microvascular density (Spearman's correlation = -0.61, p = 0.06) (A), Kep and microvascular density (Spearman's correlation = -0.60, p = 0.07) (B). Dashed line indicates 95% confidence interval. C. Necrotic fraction and Ktrans (Spearman's correlation = -0.34, p = 0.31). Solid circle represents group that shows low necrotic fraction and high Ktrans. Dashed circle represents group who showed high necrotic fraction and low Ktrans. MVD = microvascular density, NF = necrotic fraction
|
Table 1
Summary of Quantitative T1-Weighted Dynamic Contrast Enhanced MRI Parameters, Size and Microvascular Density
![]()
Table 2
Difference in Microvascular Density between Low and High Groups of Each Dynamic Contrast Enhanced MRI Parameter
Note.- MVD = microvascular density, Low = group of mice with dynamic contrast enhanced MRI parameter values below median value, High = group of mice with dynamic contrast enhanced MRI parameter values above median value, MVD values are median. P value < 0.05 is considered to be statistically significant.
![]()
Table 3
Relationship between Perfusion Parameters, Microvascular Density, and Tumor Necrotic Fraction
Note.- Correlation coefficient (τ) represents degree of change in two corresponding variables. P value < 0.05 is considered to be statistically significant. *Represents borderline statistical significance. MVD = microvascular density, NF = necrotic fraction, ROI 1 = whole transverse section, ROI 2 = hotspots
![]()
Images of the pixel-by-pixel Ktrans analysis of the tumor and corresponding immunohistochemical staining of two representative mice are shown in Figure 3 and 4. The tumor in mouse #2 was one of the smallest with the largest diameter being 7.4 mm. Necrosis in the tumor was seldom found by histological staining. The Ktrans and Kep values were highest among the animals measured in the whole transverse ROI and also in the hotspot ROI, but their MVD values counted the lowest. The tumor from mouse #10 was the largest one with the largest diameter being 16.4 mm. The tumor showed massive necrosis at the center and cellularity was only preserved in the periphery. The Ktrans and Kep values were lower than in mouse #2 but the MVD value was 2nd highest among the animals.
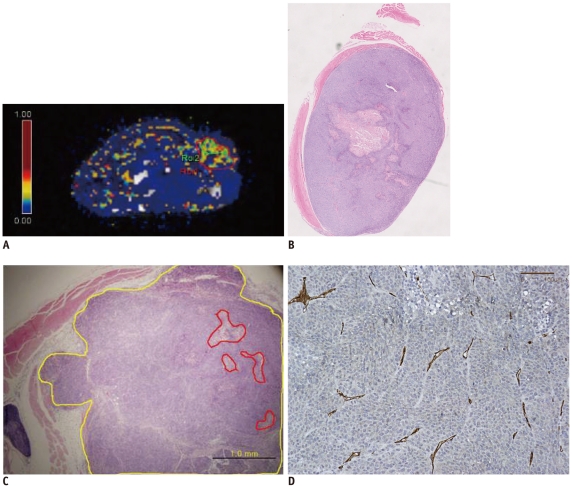 | Fig. 3Pixel-by-pixel analysis of Ktrans in tumor of representative mouse #2 evaluated by dynamic contrast enhanced MRI with Tofts model.
A. Ktrans values of whole tumor (ROI 1) and hotspot (ROI 2) are 0.285/sec and 0.429/sec, respectively. ROI 1 and ROI 2 are marked by red and green solid lines. B. Hematoxylin and Eosin staining of corresponding section of mouse #2 (original magnification, × 2). Necrosis is noted in center of tumor. C. Hematoxylin and Eosin staining includes hotspot area. Tumor necrosis fraction is 0.03 (original magnification, × 40). Yellow line indicates tumor border and red line indicates area of necrosis. D. CD 31 staining of tumor from mouse #2. Microvascular density count is 53 (original magnification, × 200).
|
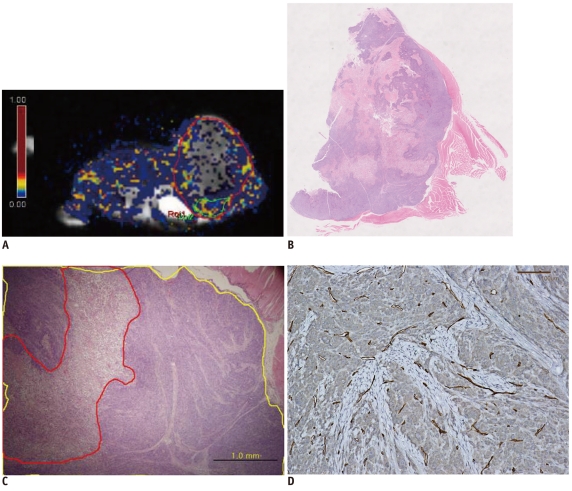 | Fig. 4Pixel by pixel analysis of Ktrans in tumor of another representative mouse (#10).
A. Ktrans values of whole tumors and hotspots were 0.113/sec and 0.237/sec respectively. ROI 1 and ROI 2 are marked by red and green solid lines, respectively. B. Hematoxylin and Eosin staining of corresponding section of mouse #10. Large amount of necrosis is shown (original magnification, × 2). C. Hematoxylin and Eosin staining including hotspot region. Tumor necrotic fraction is 0.31 (original magnification, × 40). Yellow line indicates tumor border and red line indicates area of necrosis. D. CD 31 staining of tissue from mouse #10. Microvascular density count is 108 (original magnification, × 200).
|
Go to :
DISCUSSION
T1-weighted DCE-MRI may be analyzed semi-quantitatively (15) or quantitatively (6). For the semi-quantitative method, the slope of the time-intensity curve and the amplitude of the signal intensity are calculated directly from the curve. The semi-quantitative method could be influenced by scanner settings and might make inter-patient and inter-system comparisons difficult. Therefore, a quantitative analysis has been emphasized and it is necessary to explore the meaning of these parameters. Previous studies evaluated the relationship between semiquantitative values and MVD but there remained some controversy regarding the usefulness of semiquantitative DCE-MRI parameters in evaluating the angiogenic activity of the tumor (8, 11, 12, 16, 17). Studies using quantitative DCE-MRI parameters are also still in progress (10, 13, 18).
In this study, quantitative parameters were evaluated using the whole transverse section of the tumor slice (ROI 1) and the hotspot (ROI 2) to validate the effects of ROI selection and to minimize the effects of the necrotic area. This rapidly proliferating xenograft tumor model underwent necrosis in the central area. It would be reasonable to measure hotspots instead of whole tumor region when evaluating the status of the tumor using DCE-MRI parameters, since no correlation was proven between MVD and DCE MR parameters by using whole transverse ROI. Averaging the wide necrotic area in the tumor area negatively affected the evaluation of DCE-MRI parameters, regardless of the functional status of the tumor. A recent study by Galban et al. (19) stating that the parametric response map using the voxel-by-voxel registered comparison instead of the averaged ROI comparison in follow-up studies of brain tumor patients is a reliable imaging biomarker for early cancer treatment, and the outcome also supports this study's results. Similarly, Stomper et al. (17) reported that the maximally enhanced area showed a broad correlation with MVD.
Although the inverse correlation of Ktrans and Kep with MVD was not statistically significant, likely due to the small sample size, it demonstrated that the feasibility that these parameters can be used to evaluate the angiogenic status of rapidly proliferating colon cancer. Lastly, Ktrans or Kep with MVD showed an inverse relationship. Generally, prior studies have supported a positive correlation between tissue perfusion and MVD (18). Sahani et al. (20) reported that the perfusion parameters in the high-grade hepatocellular carcinoma group were lower than the well-differentiated tumor group which was contrary to conventional belief; this observation was attributed to the presence of tumor necrosis. In the current study, tumors with large areas of necrosis (NF of 0.36 in mouse #5; NF of 0.31 in mouse #10) showed lower Ktrans (0.299/sec, 0.237/sec respectively), while the tumors with small amounts of necrosis (NF of 0.03 in mouse #2; NF of 0.04 in mouse #9) showed higher Ktrans (0.429/sec, 0.334/sec respectively). A scatter diagram (Fig. 2C) depicted the comparison of the two groups. Although the relationship between NF and perfusion parameter was not statistically significant (p > 0.05), this observation led to a reasoning that the degree of tumor necrosis may have affected the results. In addition, because MVD could not assess the functional status of the capillary wall, a high vessel count does not necessarily indicate high tissue perfusion.
Several shortcomings of our study should be noted. First, it was difficult to spatially co-localize histology with MR images. As a discrepancy was present between slice thickness in MRI versus a histological slide section (1.04 mm and 6 µm, respectively), a spatial mismatch was unavoidable. Also, tumor necrosis was not excluded in the whole transverse section (ROI 1). Thus, the quantitative parameter from the whole transverse section might not reflect the real tumor burden. And the meaning of the inverse correlation should be further investigated. Lastly, because quantitative parameters showed differences according to post-processing methods (21), our results should be carefully applied.
In conclusion, quantitative analysis of T1-weighted DCE-MRI using hotspot ROI may provide a better histologic match than using whole transverse section ROI. Within the hotspots, Ktrans and Kep tended to have a reverse correlation with MVD in this colon cancer mouse model.
Go to :
 XML Download