

 PDF
PDF ePub
ePub Citation
 Print
Print


INTRODUCTION
Intramuscular hematomas may caused by trauma or they may arise spontaneously from systemic anticoagulation or as a result of clotting deficiencies (1, 2). Hematomas that occur without a history of frank trauma can mimic soft tissue tumors (3). The magnetic resonance imaging (MRI) signal patterns of hematomas are strongly affected by the hemoglobin breakdown products and these patterns can best be understood by taking into account the magnetic properties of hemoglobin and its metabolites (4). Although the MRI signal intensity pattern of blood in the brain has been well documented (5-7), the mechanisms of both muscular hematoma and its healing differ from those of intracranial hematoma (8-10). In addition, an intramuscular hematoma can mimic a hemorrhagic neoplasm (4). Certain MRI findings for musculoskeletal hemorrhage and hematoma have been reported (1-4, 10-13), yet to the best of our knowledge, an experimental investigation of the time-dependent MRI signal changes of intramuscular hematoma has not been reported in the radiological literature. Thus, by using experimentally-induced intramuscular hematomas in rats, we investigated the serial changes in the MRI signals for the purpose of comparing these changes with those of brain hematoma, and we correlated these findings with the pathologic data.
MATERIALS AND METHODS
Animals
All the experimental procedures conducted on the animals were performed in accordance with the National Institute of Health guidelines for the handling of animals and the procedures were approved by the committee for animal research at our institution.
Thirty Sprague-Dawley white rats (each one was 230-250 g in weight) were used in the study. Hematomas were induced in both legs of each rat and then MRI was performed one day (18 legs), four days (20 legs), seven days (22 legs), 10 days (16 legs), two weeks (24 legs), three weeks (22 legs), four weeks (20 legs), six weeks (14 legs) and eight weeks (14 legs) after the artificially inflicted injury. On each evaluation day, two animals were sacrificed and the pathologic specimens were obtained.
Methods
1) Muscle Injury
To induce anesthesia, ketamine hydrochloride (Ketalar, Youhan, Seoul, South Korea) was injected into the gluteus maximus muscle of the animal (100 mg/kg). Using aseptic techniques, a 3-cm longitudinal skin incision was made along the leg. Then an incision (1-cm in length) of the gastrocnemius-soleus muscle was made perpendicular to the orientation of the muscle and a 5 × 5 mm muscle block was removed. The fascia and skin were sutured after confirmation of bleeding in the injured muscle.
2) Magnetic Resonance Imaging (MRI)
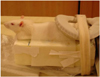
MRI was performed at each of the time points specified above. The animals were placed in the prone position and they were fixed onto a specially manufactured plate (Fig. 1). MRI was achieved using a 1.5T instrument (Intera; Phillips Healthcare, Best, The Netherlands). All the animals were studied using a flexible phased array coil (SENSE Flex S coil) and the following imaging sequences: turbo spin echo sagittal T2-weighted imaging (T2WI) (repetition time [TR]/echo time [TE]: 2483/100, matrix: 256 × 256: echo train length of 13), axial T1-weighted imaging (T1WI) (TR/TE: 779/23, matrix: 224 × 224), axial T2WI (TR/TE: 2,985/90, matrix: 208 × 208) and axial T2*-weighted gradient echo (GRE, TR/TE: 779/23, 20° flip angle, matrix: 224 × 224) imaging. The examination was performed with a 9 × 9 cm field of view, a 2-mm slice thickness and a 0.2-mm interspace gap.
3) Pathology
On each day of the MRI examinations, pathologic specimens were obtained from two legs on days 1, 2 and 7, and at 2 weeks, and from four legs on day 10, and at 3, 4, 6 and 8 weeks post-injury, after the animals had been sacrificed. Hematoxylin-Eosin staining was used for the pathologic evaluation.
4) Imaging and Statistical Analysis
The signal intensity (SI) of each hematoma was measured on three image sequences (T1WI, T2WI, GRE) at each time point, and this was compared with the SI of the normal adjacent muscle, with the image sets divided into high, isointense and low SI. In addition, dark SI was defined when a signal void was present, which was also classified as low SI. Qualitative analysis was performed by two musculoskeletal radiologists who had more than 10 years of experience, respectively. In the case of a disagreement over the evaluation, a final consensus was reached through discussion. In addition, quantitative analysis was carried out in a 0.4 mm2 region of interest (ROI) by the measurement of the SI at the central and peripheral portions of the hematoma. Each SI measurement was obtained three times by repeating the measurements in the same section and the adjacent sections. The relative signal intensity (RSI) of each hematoma was evaluated in the ROIs, and the numerical value for the normal tibialis anterior muscle was set to be 1.0. The mean value of the RSI values for each hematoma was calculated serially. Statistical analysis of the hematoma RSI was done by performing analysis of variance (ANOVA) to determine the mean RSI differences at each stage among the experimental groups. A p value less than 0.05 was considered to indicate statistical significance. The software employed was SPSS version 14.0 (SPSS, Chicago, IL). On the pathologic examination, the hematoma status, the changes in the surrounding tissue and the presence of hemosiderin were evaluated by a pathologist.
RESULTS
1. Qualitative Analysis of the MRI Signal Intensity of the Muscle Hematoma and the Pathologic Correlation
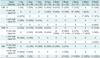
Table 1 summarizes the stages of muscle hematoma and the associated MRI signal intensities in the rats.
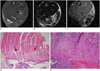
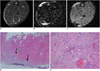
1) One Day after Injury (18 cases, Fig. 2)
Twelve (67%) of the 18 hematomas were isointense as compared to the adjacent muscle and five cases were isointense with a peripheral high-signal rim on the T1WI. Ten hematomas (56%) showed central hypointensity with a peripheral thin rim of high SI and eight hematomas (44%) revealed heterogeneous high signal intensity on the T2WI. On the GRE imaging, central dark SI with a peripheral high SI rim was apparent in 11 cases (62%), and a dark SI was seen in the remaining seven hematomas. The mean size of the hematomas was 5.3 × 8.1 × 9.9 mm. The pathologic specimens obtained one day after injury showed extensive hemorrhage, necrosis with neutrophils and acute inflammation, which were all indicative of the acute stage.
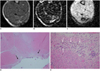
2) Four Days after Injury (20 cases, Fig. 3)
In 13 cases (65%), the central SI of the hematoma was isointense as compared to that of the adjacent muscle and a peripheral high-signal rim was seen on the T1WI. On the T2WI, an inhomogeneous, hyperintense signal was observed in 15 hematomas (75%). Yet on the GRE imaging, the central SI was high, and a peripheral dark signal rim was observed in 14 cases (70%). The mean size of the hematomas was 4.7 × 11.4 × 11.6 mm. The pathologic findings for the specimen obtained four days after injury showed granulated tissue and acute inflammation.
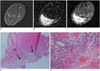
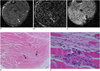
3) Seven Days after Injury (22 cases, Fig. 4)
Thirteen (59%) of the 22 hematomas exhibited a diffuse and mildly increased SI on the T1WI, and nine hematomas displayed central isointensity with a peripheral high SI rim. On the T2WI, a high SI was noted in 12 cases (55%) and a peripheral dark SI rim was observed in 10 cases. On the GRE imaging, all the hematomas showed central high SI with a peripheral dark signal rim. The mean size of the hematomas was 5.3 × 8.4 × 9.2 mm. From one week after injury, macrophages that contained hemosiderin and granulated tissue with fibrosis were noted. On MRI, a peripheral dark signal rim was seen on the T2WI, and this represented hemosiderin.
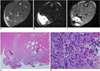
4) Ten Days after Injury (16 cases, Fig. 5)
The size of the lesions had significantly decreased and the mean size was 2.6 × 3.8 × 4.9 mm. Thirteen (81%) of the 16 hematomas displayed an inhomogeneously increased SI in the central region and three hematomas had an associated peripheral low signal rim on the T1WI. On the T2WI, central hyperintensity with a peripheral dark signal rim was noted in 10 cases (63%). On the GRE imaging, all the hematomas exhibited central hyperintensity with a peripheral dark signal rim. Granulated tissue with fibrosis, chronic inflammatory cells infiltration and hemosiderin-laden macrophages were noted in the pathologic specimens.
5) Two Weeks after Injury (24 cases)
On the T1WI, central focal hyperintensity was seen in 16 cases (67%) and a peripheral low signal rim was noted in eight cases. All the hematomas showed central hyperintensity with a peripheral dark signal rim on the T2WI and GRE imaging. The mean size of the hematomas was 2.5 × 3.4 × 4.8 mm. Granulated tissue with fibrosis and a chronic inflammatory cell infiltration were noted. Muscular regeneration was also seen. The number of hemosiderin-laden macrophages had increased.
6) Three Weeks after Injury (22 cases, Fig. 6)
Of the 22 hematomas, central hyperintensity with a peripheral low signal rim was seen in 17 cases (78%) on the T1WI. Nineteen (86%) hematomas showed central high SI with a peripheral dark SI rim on the T2WI. Associated central low signal foci were apparent in three hematomas as assessed by T2WI. On the GRE imaging, 12 hematomas showed an overall dark SI. The size of the hematomas had further decreased (1.9 × 3.1 × 3.9 mm in mean size). The pathologic findings were similar to those obtained after two weeks.
7) Four Weeks (17 cases) and Six Weeks (11 cases) after Injury
The MRI findings of the hematomas at four weeks were similar to those at six weeks after injury. Three of the 20 hematomas at four weeks and three of 14 hematomas at six weeks had disappeared. Therefore, 17 of the hematomas at four weeks and 11 hematomas at six weeks were analyzed. The mean size of the hematomas was 1.9 × 2.8 × 3.8 mm at four weeks and 1.7 × 2.5 × 3.1 mm at six weeks after injury. On the T1WI, the hematomas showed slightly increased SI or isointensity, and a peripheral hypointense signal rim or central low signal foci. On the T2WI, increased SI was seen, including low signal foci in the central portion and a peripheral dark signal rim. On the GRE imaging, all the hematomas showed dark signals. Although granulation was not present after six weeks, fibrosis, muscle regeneration and hemosiderin-laden macrophages were seen at four and six weeks after injury.
8) Eight Weeks after Injury (11 cases, Fig. 7)
At eight weeks, the hematomas had healed in three of 14 cases, and so 11 hematomas were analyzed. The hematomas were 1.6 × 2.2 × 2.3 mm in mean size and they showed low signal intensities on the T1WI and T2WI. On the GRE imaging, all the hematomas were seen as dark signal intensities. Fibrosis, muscle regeneration and hemosiderin-laden macrophages were noted until eight weeks after injury.
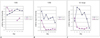
2. Quantitative Analysis of the Relative MRI Signal Intensity of the Intramuscular Hematoma (Fig. 8)
From six weeks after injury, the size of the experimentally-induced intramuscular hematoma was too small to evaluate the RSI. Therefore, the RSI was not measured after four weeks post-injury. On the T1WI, the central RSI showed significant differences at each stage, and it had increased until two weeks and then it remained high signal intensity (p < 0.05), whereas the peripheral RSI was variable and it showed no significant differences (p > 0.05). On the T2WI, the hematomas were of variable RSI at each stage in the central portion, whereas there were significant signal differences of the dark SI in the peripheral portion (p < 0.05). The relative signal intensities of the hematomas on the GRE imaging were similar to those on T2WI, and the peripheral RSI had decreased (p < 0.05) until two weeks and then it remained dark SI.
DISCUSSION
During the past few decades, MRI has become established as one of the most valuable tools for the evaluation of muscle pathology, although clinical examination remains a reliable method for the initial assessment (13). In particular, intramuscular hematoma can mimic a hemorrhagic neoplasm or an inflammatory lesion during the healing stage. Therefore, MRI evaluation of muscular hematoma is highly useful.
The MRI findings of muscle injuries and healing have been reported (11, 13-21), but there is currently no available data on the serial MRIs of experimentally-induced intramuscular hematoma. Niemi and colleagues (22) obtained the MR images of experimental intramuscular hemorrhage at 0.02T, and they investigated the time-dependent changes of the MRI characteristics of blood in vivo using the serial T1 relaxation kinetics with contrast enhancement, but they did not report the characteristic MRI findings at each stage.
Skeletal muscle has been shown, both biomechanically and histologically, to have an extensive ability to recover after laceration injury (8, 23, 24). Kääriäinen and associates (24) studied soleus muscle repair after injury, and by day 56, the regenerating myofibers had formed a well-organized structure of interlacing fibers. Terada and co-workers (25) investigated the influence of a gap size on muscle regeneration. When the gap remained wide (4 mm) at three weeks, the muscle fibers could not bridge the gap and collagen fibers covered the cut ends of the muscle. In the present study, we injured the muscle of animals by creating a 5 × 5 mm excision of the muscle mass because we planned to carry out observations for a period of eight weeks.
We used the gastrocnemius-soleus muscle, which is considered ideal as an injury model for the following reasons. Surgically, the muscle is easily accessible. The soleus muscle is attached to the surrounding muscles by the epimysium, which prevents the muscle stumps from retracting very far, and even after complete transection (23).
The MRI appearance of a hematoma depends on the stage of evolution and this is strongly influenced by the hemoglobin breakdown products (1, 2, 4, 5, 10, 26). Despite substantial variability in the regional SI patterns (7), the five stages of an evolving hematoma can be described as follows: hyperacute (intracellular oxyhemoglobin, a long T1 and T2), acute (intracellular deoxyhemoglobin, a long T1 and a short T2), early subacute (intracellular methemoglobin, a short T1 and a short T2), late subacute (extracellular methemoglobin, a short T1 and a long T2) and chronic (ferritin and hemosiderin, a short T2). The T1 shortening of methemoglobin is due to paramagnetic dipole-dipole interaction. Another paramagnetic property called the magnetic susceptibility effect is responsible for the T2 shortening when deoxyhemoglobin, methemoglobin or hemosiderin are present intracellularly. T2 shortening can also be caused by the hemo-concentration and/or clot retraction. Conversion of erythrocyte oxyhemoglobin to deoxyhemoglobin occurs very rapidly during the development of a hyperacute hematoma. As a result, most hematomas do not contain much oxyhemoglobin at the time of imaging. Thus, we evaluated rat hematomas from one day after injury in an effort to determine the clinical correlations. The MRI pattern of an acute hematoma (1-3 days after injury) is usually affected by RBC deoxyhemoglobin. T2 shortening occurs earliest in the center of the hematoma, which is consistent with the more limited oxygen supply to this area (27). In the present study, the T2WI of hematomas one day after injury revealed central hypointensity in 56% of the cases. However, high signal intensity was also prominent on the T2WI starting from the acute stage, and it was correlated with the necrotic muscle fibers and acute inflammation seen on the microscopic findings.
In early subacute hematomas (4-7 days after injury), methemoglobin is first observed adjacent to the periphery of a hematoma, and this produces the "concentric ring" sign (4) that is caused by the higher oxygen levels, which are required for the oxidization of deoxyhemoglobin to methemoglobin. Yet in the present study, peripheral high T1 SI was seen from one day after injury. In the late subacute phase (1-4 weeks), a hematoma typically displays high signal intensity not only on the T1WI, but also on the T2WI. As lysis takes place, the T2 shortening that resulted from the compartmentalization of methemoglobin is lost. In addition, the high water content of the lysed red cells increases on T2 and in terms of the proton density (7). As a hematoma reaches the chronic phase, the final degradation product, hemosiderin, is formed peripherally, and this displays a low SI (4). Eventually, the hematoma is reduced to a hemosiderin-lined pattern. Yet in the present study, hemosiderin was apparent from seven days after injury on pathologic examination. On the T2WI, a peripheral dark signal rim was matched with hemosiderin. However, four days after the injury, the peripheral dark signal rim on the T2WI appeared in 15% of the cases, which did not fit the pathologic data (i.e., hemosiderin was not visible). Edelman and colleagues (28) found a prominent halo of marked hypointensity on the T2WI and they suggested that this resulted from a boundary effect between two regions of differing magnetic susceptibility and this effect was compounded by the release of free radicals by macrophages and this did not always indicate the presence of hemosiderin.
The T2 shortening due to the magnetic susceptibility effect is enhanced on higher field-strength systems and on the gradient-echo images (29). In the present study, the size of the hematomas decreased from 10 days after injury and it was difficult to observe hematomas after six weeks owing to their extremely small size. However, hematomas could still be detected by the GRE imaging because of their dark signals.
Hematomas in skeletal muscle have a variable appearance on MR imaging according to the duration of injury, which differs from the predicted time course reported for hematomas in the brain (15). The differences in signal characteristics of hemorrhage in brain and muscle may reflect variations in the blood supply to these two anatomic entities (9, 10). Unlike the brain, muscle has a rich vascular supply without any impediment to perfusion such as is presented by the blood-brain barrier. With the release of intramuscular blood at the site of a muscle tear, the blood flow markedly increases with the associated reactive edema and a leukocyte response. The combination of edema causing high SI on T2WI and the methemoglobin formation resulting in high SI on both the T1WI and T2WI would account for the MRI features of the intramuscular hemorrhage (9). In the present study, high SI on the T1 and T2WI was apparent from the acute stage onward, which is different from the findings in brain hematoma. That is probably due to the surrounding muscular injury, in which the edema and active metabolism of muscle induce a rapid breakdown of RBCs, with the result that the low SI of intracellular deoxyhemoglobin is not evident. For the pathologic correlation, necrosis with neutrophils, RBCs and acute inflammation were seen, and this is all indicative of the acute stage hematoma. With a chronic hematoma, the persistence of a high SI on T1WI might be caused by recurrent hemorrhage (30). A continued breakdown of RBCs and hemoglobin along with the formation of hemosiderin and the development of fibrosis would be expected to result in foci with a distinctly low signal (11). In our study, fibrosis and hemosiderin-laden macrophages were increased in number after the second week and this remained until eight weeks.
Differentiating between a simple hematoma and a hemorrhagic neoplasm may be difficult in certain patients, both clinically and by means of imaging. Administration of contrast material aids in the exclusion of a neoplasm when the lesion in question does not exhibit enhancement. Conversely, the presence of an enhancing nodule in a muscle lesion may suggest the diagnosis of a neoplasm rather than a hematoma. However, in our animal study, we did not perform a contrast enhancement study. More studies on serial enhancement are needed even though a lesion can be considered to be a hematoma when gadolinium contrast results in no enhancement.
This animal study has several limitations. First, the hematoma size was small because the study was performed on rats. Second, the hematoma size rapidly decreased owing to the excellent muscle regeneration in this species. Therefore, it was difficult to evaluate hematomas at times later than four weeks after injury. Third, we did not perform an analysis of the regional variations of SI. On the quantitative analysis, we used the tibialis anterior muscle as normal muscle and each SI measurement was obtained three times by repeating the measurements in the same section and the adjacent sections to minimize errors. Another limitation is that because biochemical analysis of the hematoma was not possible, we could not define the definite biochemical stage of the hematomas by pathologic examination.
In conclusion, unlike brain hematomas, the experimentally-induced intramuscular hematomas in our study showed increased SI on both the T1 and T2WI from the acute stage onward, and this was correlated with the rich blood supply and rapid healing response to injury in the muscle. A persistence of high SI on the T1WI until the chronic stage might be caused by recurrent hemorrhage. On the T2WI, a peripheral dark signal rim that appeared from seven days post-injury was matched with hemosiderin on the pathology. On the T2WI and GRE imaging, high SI with a peripheral dark signal rim was apparent from seven days to the chronic stage.
 XML Download