

 PDF
PDF ePub
ePub Citation
 Print
Print


INTRODUCTION
Focal eosinophilic infiltration (FEI) of the liver is associated with a variety of eosinophilia-related conditions including parasitic infestation, allergic reactions, hypereosinophilic syndrome, and internal malignancies including lymphoma, leukemia, and cancer of the lung, stomach, pancreas, or ovary (1-5). Several investigators (6-12) have reported the differential radiologic findings of FEI from metastasis in the liver based on sonography, CT, and MRI with gadopentetate dimeglumine (Magnevist; Schering AG, Berlin, Germany) or gadobenate dimeglumine-enhanced MRI (Gd-BOPTA; MultiHance, Bracco SpA, Milan, Italy) using 1.5 Tesla (T). Although specific radiologic findings of FEI in the liver have been previously reported (6-12), it is still difficult to differentiate these foci from hepatic metastasis in patients with extrahepatic malignancies.
Currently, liver MRI using 3.0T with improved image quality due to greater signal-to-noise ratio has been increasingly used for the detection and characterization of focal liver lesions. The recently developed hepatobiliary agent, gadoxetic acid (Gadolinium-ethoxybezyl [Gd-EOB]-DTPA, Primovist, Bayer Schering Pharma, Berlin), is taken up preferentially by hepatocytes and evidences prolonged persistence in the liver, owing to the fact that approximately 50% of the injected dose is taken up by functioning hepatocytes and excreted in the bile, as compared with an uptake of 3-5% for gadobenate dimeglumine and hepatocyte-specific phase imaging after the injection of gadoxetic acid, which can be obtained earlier than gadobenate dimeglumine (13-15). Some investigators (16, 17) have previously reported that gadoxetic acid-enhanced MRI allows for the accurate detection and characterization of focal liver lesions.
To the best of our knowledge, there have been no reports outlining the most decisive radiologic findings to differentiate FEI from hepatic metastasis using gadoxetic acid-enhanced 3.0T MRI. Therefore, the purpose of this study was to evaluate and verify the most useful findings of gadoxetic acid-enhanced 3.0T MRI in the differentiation of FEI from hepatic metastasis.
MATERIALS AND METHODS
Patients
The Institutional Review Board approved this retrospective study, and informed consent was not required. Using a computerized search of our hospital's radiological and pathological information systems from May 2008 to March 2009, a total of 594 cancer patients with metastasis and a total of 38 patients with FEIs in the liver were included in the study. Among them, 51 cancer patients with 79 metastases and 25 cancer patients with 39 FEIs underwent gadoxetic acid-enhanced 3.0T MRI. The patients with metastases were selected solely on the basis of histopathological confirmation. Pathological diagnoses of FEI and metastasis were rendered after a percutaneous biopsy (n = 4, n = 10, respectively), or partial hepatic resection (n = 2, n = 69, respectively). The FEIs (n = 33) that were not pathologically confirmed were clinically diagnosed by consideration of initial peripheral eosinophilia (> 10%), spontaneous disappearance on follow-up imaging, and normalized peripheral blood eosinophilic count (7). The number of FEIs in the liver for a given patient ranged from one in 17 patients, two in six patients, three in one patient, and seven in one patient. The number of metastases for a given patients ranged from one in 35 patients, two in nine patients, three in four patients, four in one patient, and five in two patients.
In 25 patients with FEI in the liver, the primary malignancies included adenocarcinoma in the stomach (n = 10), colorectum (n = 12), cervix (n = 1), breast (n = 1), and common bile duct (n = 1). The patients included 20 men and five women, ranging in age from 35 to 64 years (mean, 56 years). In 51 patients with hepatic metastasis (M:F = 31:20; age range, 31-83 years; mean age, 59 years), the primary malignancies included adenocarcinoma in the colorectum (n = 42), stomach (n = 3), pancreas (n = 2) and gallbladder (n = 1); neuroendocrine carcinoma in the pancreas (n = 2); and malignant gastrointestinal stromal tumor in the small bowel (n = 1).
MRI Examinations
All MR images were acquired with a 3.0T whole-body MRI system (Intera Achieva 3.0T, Philips Healthcare) with a 16-channel phased-array coil used as the receiver coil. The liver was imaged in the axial plane in all patients, both prior to and after administration of gadoxetic acid at a dose of 0.1 mL/kg (0.25 mmol/mL). The contrast agent was automatically intravenously administered at a rate of 2 mL/s with a power injector, followed by a 20-mL saline flush. The MRI protocol included a respiration-triggered T1-weighted turbo field-echo in-phase sequence (repetition time [TR]/echo time [TE], 10/2.3; flip angle, 15°; matrix size, 288 × 230; bandwidth, 434.3 Hz/pixel) and an out-of-phase sequence (10/3.45; flip angle, 15°; matrix size, 288 × 230; bandwidth, 434.3 Hz/pixel), a respiration-triggered single-shot T2-weighted sequence with a reduction factor of 2 or 4 (1342/80; flip angle, 90°; matrix size, 320 × 256; bandwidth, 506.4 Hz/pixel), a breath-hold multishot T2-weighted sequence with a reduction factor of 2 or 4 (2161/70; flip angle, 90°; matrix size, 400 × 280; bandwidth, 235.2 Hz/pixel), a respiration-triggered single-shot heavily T2- weighted sequence with a reduction factor of 2 or 4 (1573/160; flip angle, 90°; matrix size, 320 × 256; bandwidth, 317.9 Hz/pixel) with a 5- to 7-mm section thickness and a 1- to 2-mm intersection gap, and a field of view of 32-38 cm. For gadoxetic acid-enhanced MRI, unenhanced, arterial-phase (20-35 seconds), portal-phase (60 seconds), late-phase (3 minutes), and 20-minute delayed hepatobiliary-phase images were obtained using a T1-weighted 3D turbo field-echo sequence (T1 high-resolution isotropic volume examination, THRIVE, Philips Healthcare) (3.4/1.8; flip angle, 10°; matrix size, 336 × 206; bandwidth, 995.7 Hz/pixel) with a 2-mm section thickness, no intersection gap, and a field of view of 32-38 cm.
Image Analysis
Quantitatively, one author measured the maximum dimension of the lesions 1 cm in diameter or larger in order to reduce any measurement inaccuracies resulting from partial volume effects on both T2-weighted and hepatobiliary-phase images. The three consecutive time measurements of a lesion were averaged, and this average was chosen as the maximum dimension of the lesion. Qualitatively, morphologic MRI findings of 39 FEIs and 79 hepatic metastases were reviewed by consensus of two experienced radiologists. The following findings were evaluated: margin, shape, signal intensity on T1- and T2-weighted images, and the enhancement pattern on gadoxetic acid-enhanced arterial, portal, and 3-minute late phases. Additionally, the presence or absence of target appearance on hepatobiliary-phase images was assessed.
The margin of the lesion was divided as either ill- and well-defined. A well-defined margin was considered as a clear demarcation of the entire lesion on hepatobiliary-phase images. The shape of the lesion was divided into non-spherical and spherical categories. A lesion was defined as spherical when it showed a round or oval shape based on the combined T2-weighted and hepatobiliary-phase images; a lesion was defined as non-spherical when it showed any shape other than a round or oval shape based on the combined T2-weighted and hepatobiliary-phase images. The contrast enhancement pattern of the lesion was evaluated at the arterial, portal, and 3-minute late phases into two types and divided according to the presence or absence of rim enhancement (contrast enhancement at the periphery of the lesion). As seen on the arterial, portal, and 3-minute late phases, contrast enhancement was defined as hyperintensity compared to the surrounding liver parenchyma. Non-rim enhancement included hypointensity to homogeneous or heterogeneous hyperintensity compared to the surrounding liver parenchyma. The target appearance on hepatobiliary-phase images was defined as peripheral rim-like hypointensity compared with central hyperintensity in the lesion.
Two other observers with one and five years of experience, respectively and who were blinded to the clinical information and final diagnosis, reviewed the MR images randomly and independently two times before (session 1) and after (session 2) learning the results of the quantitative and qualitative analyses. Although the observers were aware that focal hepatic lesions in patients with extrahepatic malignancies had been confirmed as either FEI or metastasis, they were unaware of any other histopathological diagnoses or clinical findings. The interval between the reviews of MR images was at least one month. Each observer independently recorded lesions using a five point confidence scale: 1 = definite metastasis, 2 = probable metastasis, 3 = possible FEI, 4 = probable FEI, and 5 = definite FEI. In clinical practice at our institution, the criteria used to distinguish FEI from metastasis on gadoxetic acid-enhanced MR images in session 1 included an irregular, non-spherical shape with fuzzy margins on T2-weighted images and more homogeneous hyperintensity during portal and 3-minute late phase images. A well-defined spherical shape with rim enhancement and a peripheral washout sign on dynamic images and hypointensity or target appearance on hepatobiliary phase images were considered indications of metastasis. Additional criteria used to distinguish FEI from metastasis on gadoxetic acid-enhanced MR images in session 2 included isointensity on T1-weighted images and emphasized ill-defined margin and size change between T2-weighted images and hepatobiliary phase images. All images were evaluated using a Picture Archiving and Communication System (PACS; PathSpeed, GE Medical Systems Integrated Imaging Solutions, MT. Prospect, IL) with an adjustment of the optimal window setting in each case. To avoid a mismatch between the true lesions and the scored lesions, each observer recorded the individual image number, the segmental location of all lesions, and the size of each lesion. For patients with two or more lesions in one segment, detailed descriptions of the location of the lesion in each segment were added in order to avoid confusion in the data analysis. Upon image review, the observers were aware that the sensitivity for FEI detection was calculated with the number of lesions that were assigned a confidence level of 4 or 5. All false-positive findings with confidence levels of 4 or 5 that were confirmed to be metastasis and all false-negative findings with confidence levels of 1, 2 or 3 that were confirmed as FEI were assessed by observer consensus.
Statistical Analysis
The mean difference in the maximum dimension of the lesions 1 cm in diameter or larger, between T2-weighted and hepatobiliary-phase images in two groups was compared by the Student's t tests. For a univariate analysis, statistical differences in morphologic findings and signal intensities on all sequences of MR images between FEI and metastasis were analyzed via the Chi-square test and Fisher's exact test. Multivariate analyses using multiple logistic regressions were employed to determine the most significant MRI features for differentiating FEI from metastasis.
The sensitivity, specificity and diagnostic accuracy were calculated for each observer and each session, and the differences were statistically analyzed using McNemar test. The statistical analyses employed to test for the differences of calculated positive and negative predictive values for each observer and each session were based on a previous report (18). Significant differences were defined as p values less than 0.05.
Kappa statistics were used to evaluate interobserver agreement for the detection of FEI in each session. The degree of agreement was categorized as follows: kappa values of 0.00-0.20 were considered indicative of poor agreement; 0.21-0.40, fair agreement; 0.41-0.60, moderate agreement; 0.61-0.80, good agreement; and 0.81-1.00, excellent agreement (19).
RESULTS
Quantitative Analysis
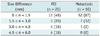
The number of the lesions 1 cm in diameter or larger were comprised of 25 FEIs (mean, 16.5 mm; range, 10.1-34.6 mm) and 60 metastases (mean, 22.1 mm; range, 10.4-61.9 mm) on T2-weighted images. Table 1 shows the differences of the maximum dimension of the lesions 1 cm in diameter or larger between T2-weighted and hepatobiliary phase images in the two groups. The size of FEIs and metastases on T2-weighted images were shown as unchanged in two FEIs (8%) and in four metastases (7%), increased in seven FEIs (28%) and in 43 metastases (72%), and reduced in 16 FEIs (64%) and 13 metastases (22%), on hepatobiliary phase images. The mean difference in the maximum dimension of the lesions 1 cm in diameter or larger between two MR images in two groups were 2.1 mm (range, 0-5.1 mm) in FEI and 0.7 mm (range, 0-3.6 mm), and were statistically significant (p < 0.001).
Qualitative Analysis
Univariate and Multivariate Analyses
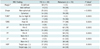
Table 2 summarizes the different MRI features observed in the two groups. All FEIs and metastases appeared hypointense on hepatobiliary-phase images. On univariate analysis, all MRI features of FEIs were significantly different (p < 0.0001) except for hyperintensity on T2-weighted images in comparison with those of metastasis.
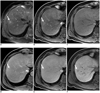
Of the eight significant MRI features on univariate analysis, the results of the multivariate analyses demonstrated that ill-defined margin (p = 0.0155) and isointensity on T1-weighted images (p = 0.0028) (Fig. 1) were statistically significant features. Among the 39 FEIs, 25 (64%) lesions in which ill-defined margins and isointensity on T1-weighted images manifested simultaneously, whereas there was only one (1%) such case among 79 metastases in the liver. The accuracy, sensitivity, and specificity of those combined MRI findings for differentiating FEI from metastasis were calculated as 87% (103 of 118), 64% (25 of 39) and 99% (78 of 79), respectively.
Review of MR Images Before and After Recognition of Results
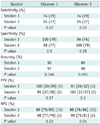
Table 3 shows the sensitivity, specificity, diagnostic accuracy, as well as the positive and negative predictive values between two sessions for each observer. All observers had significantly higher sensitivities and negative predictive values in session 2 than session 1 (p < 0.05). Also, all observers achieved a higher accuracy in session 2 than in session 1 and the difference was statistically significant in observer 2 (p < 0.05).
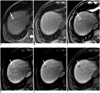
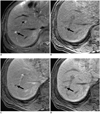
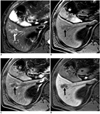
Among the lesions misinterpreted as metastasis in session 1, nine (23%) and eight (21%) FEIs were correctly interpreted by observers 1 and 2, respectively, in session 2. Among these, all observers correctly interpreted four FEIs in session 2 after being misinterpreted as metastasis in session 1 (Fig. 2) In a retrospective analysis, all four lesions showed isointensity on T1-weighted images irrespective of a well-defined margin and spherical shape in three lesions and rim enhancement on dynamic images in one lesion. Two of these lesions decreased in size and the remaining two lesions remained unchanged based on the comparison of hepatobiliary-phase images and T2-weighted images. Two metastases were misinterpreted as FEI by observer 1 in session 2, after being correctly interpreted in session 1. These lesions showed a spherical shape and no rim enhancement on dynamic images (Fig. 3). Only one FEI was misinterpreted as metastasis by all observers in both sessions. This lesion showed a well-defined margin, hypointensity on T1-weighted images, and rim enhancement on dynamic images; particularly in the arterial phase (Fig. 4). There were no FEIs that were interpreted as metastases in session 2 after being interpreted as FEIs in session 1.
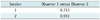
The kappa values between the two observers for each session were in good agreement in session 1, and in excellent agreement in session 2 (Table 4).
DISCUSSION
Recently, a few reports have demonstrated the relatively high rate of coexistence of FEI and metastasis in the liver, which makes it difficult to differentiate FEI from hepatic metastasis in patients with extrahepatic malignancies in clinical practice (1, 3-5). Therefore, based on major MRI findings using high-field strength with a liver-specific agent such as gadoxetic acid, the precise differentiation of FEIs from metastases in the liver is critical for proper management.
Our results revealed that the changes in the sizes of FEIs between T2-weighted and hepatobiliary-phase images were significantly greater than those of metastases. However, the majority of FEIs (92%) and metastases (93%) increased or decreased in size on hepatobiliary phase-images when compared to T2-weighted images, which differed from the assertions of a previous report looking at metastasis (11). Several investigators reported that perfusion abnormalities and inflammatory changes around FEIs with various degrees of damage to hepatocyte function in them (11), as well as changes including sinusoidal congestion, inflammatory cell infiltration and desmoplastic reactions around metastasis (20-23) may occur, which may be responsible for the size difference between T2-weighted and hepatobiliary-phase images.
Several studies (6, 8-12, 16) have described preferable MRI findings of FEIs in the liver. Non-spherical shape (76-85%), ill-defined margin (79-90%), isointensity on T1 weighted images (55-79%), hyperintensity on T2-weighted images (77-94%), and variable enhancement on dynamic imaging may be suggestive of FEIs (6, 8-10, 12, 16), which is consistent with our findings. In contrast, the majority of hepatic metastases in our study showed well-defined margin, spherical shape, hypointensity on T1-weighted images, hyperintensity on T2-weighted images, and rim enhancement on dynamic images as reported previously (20, 24-27).
Several investigators (6, 7, 11, 24, 27) have reported that the typical imaging findings of hepatic metastasis included rim enhancement (40-92%) on dynamic images and a target appearance (63-85%) on gadobenate dimeglumine-enhanced hepatobiliary-phase images. However, although less frequent in FEIs, 5-21% of FEIs in our study and 2-12% of FEIs in previous reports (6, 7, 11, 24, 27) showed rim enhancement on dynamic imaging and 5% of FEIs in our study showed a target appearance hepatobiliary-phase MR images, which may make precise differentiation between the two groups difficult. We assume that perilesional enhancement of FEIs owing to increased vascular permeability caused by the inflammatory process or compensatory arterial overflow due to portal flow obstruction (8, 10, 11), could be sufficient to mimic the rim enhancement of metastasis. Several investigators (11, 24, 28) have suggested that the target appearance of hepatic metastasis may be caused by vascularized tumor cells in the periphery and abundant fibrosis and necrosis in the center on hepatobiliary-phase images. However, we believe that the target appearance of FEI may be imaged by variable degrees of central coagulative necrosis with liver cell damage, as reported previously (8, 10, 21-23).
Although several MRI features of FEIs that differ from those of hepatic metastases have been reported (6, 8-12, 16), most decisive imaging findings for the differentiation of FEI from metastasis, as well as their usefulness in clinical practice, have not yet to be determined. Our results demonstrated that ill-defined margin and isointensity on T1-weighted images were the most useful MRI findings for distinguishing FEI from metastasis. We believe that the peripheral portion of FEI may have a high chance of contrast agent retention by the preserved functioning hepatocytes or inflammation, which may result in an ill-defined margin relative to the peripheral portion of hepatic metastasis has abundant tumoral cellularity (21-23, 28, 29), thus resulting in a well-defined margin.
Several investigators (20, 24-27) reported that the MRI features of hepatic metastasis commonly include hypointensity on T1 and hyperintensity on T2-weighted images, and these findings are attributable to a lack of glycogen within tumor cells and a relative increase in the amount of water in extracellular spaces or tumoral matrices (20). In our study, isointensity on T1-weighted images in FEIs was an important distinguishing finding that was different from hepatic metastasis. We speculate that the isointensity of FEI on T1-weighted images may result from smaller amounts of water due to the inflammatory process of FEI with a relatively lesser extent of necrosis and no change of vascularity compared to hepatic metastasis (28).
Based on the verification of the usefulness of our results in clinical practice, all observers achieved higher sensitivity, diagnostic accuracy, and negative predictive value in session 2 than in session 1. Our diagnostic accuracies (96-98%) in session 2 were superior to the 78% accuracy reported by Jang et al. (7). We believe that focused interpretation based on the most useful MRI findings in our study, may improve the diagnostic accuracy in distinguishing FEIs from metastasis. In our study, interobserver agreement in session 2 was better than in session 1, which may be another positive finding confirming the usefulness of our results. In our study, two false-positive and four false-negative findings in session 2 developed due to the overlap of MRI findings with each other. Therefore, a histopathologic diagnosis such as a biopsy, should be conducted for any inconclusive lesions.
Our study has several limitations. First, hepatic metastases in most patients in our study consisted of adenocarcinoma, and whether results obtained on this basis can generally be applied to patients with various types of malignancies remains a matter of some controversy. Second, MRI findings of FEIs depend on the degree of inflammation and destruction of the liver parenchyma. In our study, not all FEIs were pathologically confirmed. As a result, the correlation between the MRI findings and the pathologic composition of large numbers of FEIs proved to be impossible. However, biopsies were not always performed, partially because the familiarity with the image findings of FEIs has reduced the need for further invasive study, and partially because FEIs were not clearly visible on sonography.
In conclusion, our results demonstrate that with changes in the sizes of FEIs between T2-weighed and hepatobiliary-phase images, ill-defined margin and isointensity on T1-weighted images are the most useful findings for differentiating FEIs from metastases in the liver on gadoxetic acid-enhanced 3.0T MRI.
 XML Download