

 PDF
PDF ePub
ePub Citation
 Print
Print


INTRODUCTION
Elastography was first used for human applications in 1987 by Krouskop et al. (1). It is based on the principle of tissue deformability on the application of pressure. Any tissue or lesion will behave in different ways, depending on its molecular make up, when external pressure is applied on it. Soft tissues will deform more when pressure is applied and hard tissues will deform less. This information is represented on the monitor as a spectrum of colors: blue representing hard areas, red representing soft areas and green representing firm areas with intermediate consistency/stiffness. The tissue contrast seen on sonoelastography is due to differential tissue stiffness. We will be discussing our initial experience with musculoskeletal elastography and where available, we compare our experience with that of the previously published papers. We have also compared our elastographic findings with those of magnetic resonance imaging (MRI) wherever possible.
Principle and Technique of Elastography
When performing sonoelastography, information is obtained before and after tissue compression and this information is based on comparing the differences of signals acquired before and after tissue displacement (2). By measuring the amount of tissue displacement, elastography provides objective information regarding the stiffness of tissues (3). There are several sonoelastographic techniques like compression strain imaging (4), vibration sonoelastography (5), real-time shear velocity (6) and acoustic radiation force generated by the ultrasound pulse (7). For the musculoskeletal sonoelastography, we have employed the free hand compression technique on GE E8 ultrasound equipment with using an 8-12 MHz elastography compatible linear probe. The conventional B-mode ultrasound image is displayed on the right side of the screen while the color coded real time sonoelastogram is depicted on the left side of the screen. The transparency of the color can be optimally adjusted such that the underlying grey scale image can be seen through the overlying color map. The quality and adequacy of the images can be assessed by observing the color bar in the right hand side of the image. Red color in the color bar represents inadequate information from the elastogram and it must not be used for interpretation. The ideal images for interpretation are those with complete green color in the color box. The adequacy of repetitive physical compression also can be assessed by observing the compression graph in the left hand lower corner of the screen. Compression must be minimal and applied in the vertical direction. Movement in the lateral direction (the so-called creep or slip) must be suppressed/minimized. Excessive pressure on the probe must also be avoided.
Achilles Tendon
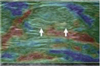
The Achilles tendon is the largest tendon in the body and it is easily accessible for imaging. Tendons in young healthy people usually demonstrate a predominant blue color, suggesting a hard nature with less deformability (8). The patients were made to lie down prone with the foot hanging from the edge of the bed. Sonoelastography was performed with an 8-12 MHz elastography compatible linear probe.
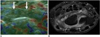
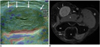
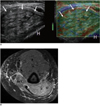
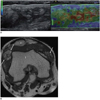
Tobias et al. in their study of 80 asymptomatic tendons found that most of the normal tendons had a hard structure with a predominant blue color (8). In our experience most healthy Achilles tendons demonstrated predominant hardness (blue color) (Fig. 1), asymptomatic geriatric tendons revealed a predominant green color (firmness) (Fig. 2) with traces of blue, while patients with tendinopathy and achillodynia predominantly revealed a red (Fig. 3) color representing a soft consistency. This information will be useful for prognostication and to detect subclinical changes in the tendons even before there are changes on the routine B-mode ultrasound. Two young patients with traumatic tears of the Achilles tendon revealed uniform hardness in the tendons with focal red areas at the site of tears, which probably represented edema/hemorrhage.
Supraspinatus
The supraspinatus tendon can be very well assessed by high resolution ultrasound. The patient is made to sit on an examining stool with the affected hand behind his/her back on the opposite side. Once a routine B-mode examination was performed, we then did the real time sonoelastography by applying a small amount of repetitive compression on the tendon. The information obtained on sonoelastography was interpreted in the same way as that of the Achilles tendon.
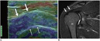
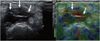
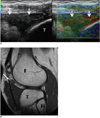
The supraspinatus tendon is commonly injured and it is also affected by tendinosis. Information regarding the stiffness of the tendon and elastic properties can play a role in the treatment and management. In our experience we found that the tendons in asymptomatic young individuals showed a predominant blue color that represented hardness (Fig. 4) while those with tendinosis (Fig. 5) showed a predominant green to red color indicating varying degrees of softness. A few young patients with traumatic supraspinatus tears revealed blue and green color in most of the tendon with traces of red at the site of tears (Fig. 6). This information regarding stiffness and consistency of the tendon may be useful for prognostication and also for treatment planning.
Researchers from Egypt have evaluated the utility of sonoelastography to assess the supraspinatus tendon in 40 symptomatic patients with shoulder pain and 20 healthy volunteers. They compared the results with MRI and concluded that sonoelastography was a sensitive method for making the diagnosis of rotator cuff tears and tendinosis (9). The study performed by Schreiber et al, which aimed to evaluate using real-time sonoelastography for making the diagnosis of fatty atrophy of the rotator cuff muscles, revealed that sonoelastography was comparable to MRI for the detection of fatty atrophy (10). Tendons with atrophy demonstrated the loss of normal elastic properties.
Synovium
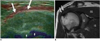
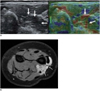
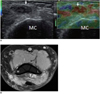
Synovial hypertrophy is commonly seen in inflammatory and infective disorders. In our experience with fifteen patients who had proven inflammatory synovitis and six patients with proven infective synovitis, we have found that the synovium shows a predominant firm to soft consistency in infective synovitis, i.e., a predominant red color with patchy green areas (Fig. 7) and firm consistency (a predominant green color) in inflammatory synovitis (Fig. 8). This information can be very useful for deciding the direction of patient management in the early stages of synovitis where it is difficult to distinguish between inflammatory and infective synovitis.
Soft tissue lesions
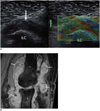
We have evaluated a few soft tissue lesions. In our experience we found that hemangiomas demonstrated a predominant red to green color suggesting a soft to firm consistency (Fig. 9). Neurofibromas revealed predominant green color representing a uniform firm consistency with no focal hard (blue) areas (Fig. 10).
Miscellaneous Lesions
Ganglion Cyst - It showed a predominant green to red color suggesting soft to firm consistency (Fig. 11). There were no significant blue areas that suggested solid areas of hardness. Cystic areas must usually show red color suggesting a very soft consistency. However, cystic lesions may sometimes show all the three colors within it. This occurs due to artifact, as the echo intensities in cystic lesions are low and the displacement in the center and periphery of the cystic lesions can be erroneously interpreted.
Lateral Epicondylitis - The real time sonoelastographic findings in lateral epicondylitis at the elbow have also been described (11), but we have no experience with the elastographic findings of tennis elbow. Tobias et al studied 38 elbows and they concluded that there is intra-tendinous softening in the common extensor origin in cases of lateral epicondylitis (11).
Inflammatory Myositis - Normal muscle usually shows a predominant green color suggesting a firm consistency. In myositis (Fig. 12) with no significant necrosis, the involved muscle shows a predominant green color (firmness) with no significant areas of red color (softening) or blue color, i.e., hardness due to fibrosis.
Botar-Jid et al. (12) described the sonoelastography findings in myositis They found that elastography revealed no significant changes in the muscular elasticity in the early stages of myositis, while in the advanced stages the muscles revealed increased stiffness, which was probably due to fibrosis. This information regarding the hardness or softness of the muscle (blue areas representing hardness and red areas representing soft necrosis) is useful for the prognostication and counseling of patients.
Lipoma Arborescens - Sonoelastography of the villous lipomatous proliferations revealed predominant red color with areas of green suggesting soft to firm consistency (Fig. 13).
Inflamed nerve in the case of neuritis demonstrated a predominant red color, i.e., softness (with the loss of normal firmness) that is probably secondary to edema (Fig. 14).
Pigmented Villonodular Synovitis - Sonoelastography of pigmented villonodular synovitis in the Hoffa's fat pad revealed predominant soft to firm areas (Predominant red to green with a few blue/hard areas) (Fig. 15). Malignant synovial tissue (sarcomas) would show predominant hard (blue) areas.
In conclusion, real-time sonoelastography can be used for various musculoskeletal applications, but the clinical utility is yet to be established. Further multicenter studies with the histopathological correlation need to be performed in order to establish the clinical utility of sonoelastography.


 XML Download