

 PDF
PDF ePub
ePub Citation
 Print
Print


INTRODUCTION
Magnetic resonance (MR) imaging has developed as an efficient and noninvasive imaging tool for making the diagnosis of pancreaticobiliary disease. MR cholangiopancreatography (MRCP) and the gadolinium-enhanced T1-weighted images can be used for this purpose.
MR cholangiopancreatography relies on the use of a heavily T2-weighted sequence. Stationary tissue with a long T2 relaxation time (including water and bile) has high signal intensity. In contrast, tissues with short T2 relaxation times (such as the liver and pancreas) and flowing blood (signal loss from motion) have low signal intensity. This allows for optimal contrast between the hyperintense bile and the hypointense background (1). In clinical practice, MRCP can be used to depict and evaluate the major biliary structures of neonates and small infants to exclude biliary atresia as the cause of neonatal cholestasis by allowing visualization of the common bile duct (2, 3).
The gadolinium-enhanced T1 sequence is also useful for evaluating pancreaticobiliary disease. The paramagnetic gadolinium-containing MRI contrast agents are sometimes termed "positive contrast agents" based on their effective T1-shortening characteristics, which provide an increased signal intensity in the T1-weighted sequences (4). However, gadolinium chelate is known to have not only a T1-shortening effect, but also T2- and T2*-shortening effects. Therefore, it can darken the area of contrast distribution depending on its concentration on the T2-weighted images (5-8). Additionally, the effects of T1- and T2-shortening compete, that is, T1-shortening usually leads to increased signal intensity in an image while T2-shortening results in decreased signal intensity (6).
While some studies have been performed regarding the efficacy of additional gadolinium chelate administration for depicting biliary structures as compared with conventional T2-weighted MRCP for the purpose of improving the diagnosis, the results have been controversial (1, 5). Moreover, the efficacy of gadolinium agents is determined not only by their pharmacokinetic properties, but also by their magnetic properties (T1- and T2-relaxivities) (4). Various factors (including contrast agents, the magnetic field strength and temperature) can influence these relaxivities.
There are many kinds of gadolinium chelate; the majority of the agents are predominantly excreted through the kidneys and not through the biliary system. These contrasts agents affect the signal intensity not in the bile ducts, but in the surrounding soft tissue. However, some contrast agents (hepatobiliary contrast agents) are cleared from the body by both urinary and biliary routes (4, 9). Visualization of the bile ducts can be enhanced with these agents in T1-weighted MRCP (10). Therefore, these different characteristics of contrast excretion can be used in both T1- and T2-weighted MRCP.
Further, the clinical condition of the patient can be an important factor. In evaluating neonatal cholestasis, the use of gadolinium is limited in patients with biliary atresia due to delayed biliary excretion. Yet no previous study has evaluated the proper delay time or the optimal gadolinium concentration to increase the contrast-to-noise ratio (CNR) for the evaluation of biliary trees in cases with delayed biliary excretion.
The purpose of this study was to confirm the T2-shortening effect of gadolinium, to evaluate the effect of different gadolinium chelates and different magnetic field strengths to identify the optimal combination of these conditions, and to determine the maximum CNR for evaluating the biliary system through a phantom study.
MATERIALS AND METHODS
Phantom Study
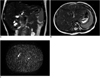
We prepared two sponge phantoms in a rectangular plastic container to simulate background soft tissue. A 1 cc syringe tube was placed in each sponge phantom to simulate a bile duct (Fig. 1). Gadopentetate dimeglumine (Gd-DTPA, Magnevist; Bayer Schering Pharma, Germany) or gadoxetic acid disodium (Gd-EOB-DTPA, Primovist; Bayer Schering Pharma, Germany) was added to normal saline to create different gadolinium concentrations.
One container was used for Gd-DTPA. At first, a plain sponge phantom with normal saline was evaluated to simulate the background soft tissue before contrast administration. Next, Gd-DTPA was dissolved at concentrations of 0.1, 0.3, 0.5, 0.7, and 1.0 mmol/L to simulate the background after contrast administration (5, 11). The tubes were filled with normal saline in this container.
The other container held a sponge phantom with Gd-EOB-DTPA. Gd-EOB-DTPA was also dissolved at concentrations of 0, 0.1, 0.3, 0.5, 0.7, and 1.0 mmol/L in this sponge phantom. The tubes were filled with Gd-EOB-DTPA with different concentrations of 0, 0.5, 1, 1.5, 2, 2.5, and 3 mmol/L in this container (8).
These two sponge phantoms were scanned simultaneously with the same level of gadolinium concentration.
MR Imaging
MR imaging was performed with 1.5-T and 3T scanners (Intera Achieva; Philips Medical Systems, Amsterdam, The Netherlands) using a coil produced by the scanner manufacturer (SENSE head; Philips Medical Systems). Two sponge phantoms were imaged with a T2-weighted single-shot fast spin echo sequence (TR/TE: 620/80, echo-train length: 56, half-Fourier acquisition, matrix: 212 × 210, field of view: 20 × 20 cm, section thickness: 3 mm, received bandwidth: 54.7 kHz on the 1.5T scanner and TR/TE: 960/80, echo-train length: 58, half-Fourier acquisition, matrix: 256 × 256, field of view: 20 × 20 cm, section thickness: 3 mm, received bandwidth: 41.4 kHz on the 3T scanner).
To evaluate the T2 relaxation time of each sponge phantom, T2 relaxometry was performed with the spin-echo sequences (TR/TE: 2000/20, 40, 60, 80, 100, 120, 140, 160, 180 and 200) and the same coil.
Image Analysis
Image analysis was conducted using operator-defined region-of-interest measurements of the mean signal intensity of the inner area of the tube and the sponge. The mean signal intensity was obtained from the signal intensities at three sites for each area.
To simulate the CNR of bile ducts in the liver, the CNR of the syringe tube was calculated by dividing the difference between the mean signal intensities of the sponge and the syringe tube by the standard deviation of the mean signal intensity of the sponge.
The T2 relaxation time of each sponge phantom was recorded from the T2 relaxometry images. Least square fitting was used to calculate the relaxation time.
The signal intensities, CNRs and T2 relaxation time of the two phantoms (with Gd-DTPA and Gd-EOB-DTPA) with different magnetic field strengths (1.5T and 3T) were compared and correlated with the gadolinium concentrations. The maximum value of the CNR for each set of conditions was also evaluated.
Statistical Analysis
The changes in the mean signal intensities, the CNRs and the T2 relaxation times were compared for each set of conditions (with different gadolinium chelates and different magnetic field strengths) using repeated ANOVA (analysis of variance). The relationships between these parameters (signal intensities, CNRs and T2 relaxation times) and the gadolinium concentrations were evaluated with a linear regression test and the regression slopes were obtained. Statistical analysis was performed using statistical software (SPSS, version 17; SPSS, Chicago, IL). Statistically significant differences were defined when the p values were less than 0.05.
RESULTS
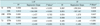
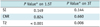
The relationships between the parameters (signal intensities, CNRs and T2 relaxation times) and the different gadolinium concentrations are summarized in Table 1. The results of comparing the parameters between the different gadolinium chelates are summarized in Table 2. The results about the magnetic field strength showed that the magnetic field strength significantly influenced all the parameters with both gadolinium chelates (p < 0.001).
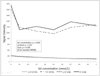
The signal intensities showed a significantly negative correlation with the gadolinium concentration for both contrast agents in both magnetic field strengths (Fig. 2) (Table 1). The signal intensities were higher with 3T for both contrast agents (p < 0.001). However, there was no statistically significant difference between the two gadolinium chelates in either of the magnetic field strengths (p = 0.149 on 1.5T and p = 0.144 on 3T) (Table 2).
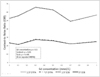
The CNRs showed no correlations with the gadolinium concentrations under any set of conditions (Fig. 3) (Table 1). The CNRs did not change depending on the contrast agent (p = 0.824 on 1.5T and p = 0.660 on 3T) (Table 2). However, the CNRs were higher on 1.5T with both contrast agents (p < 0.001). The maximum CNR could not be obtained for this result.
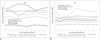
The CNRs of Gd-EOB-DTPA with the different tube gadolinium concentrations were also analyzed with both 1.5T (Fig. 4A) and 3T (Fig. 4B). The CNRs showed a significant correlation with the gadolinium concentrations on 3T (p = 0.007), but not on 1.5T (p = 0.107). There were significant differences between the different tube gadolinium concentrations on both 1.5T and 3T (p < 0.001). However, the maximum CNR could also not be obtained for this result.
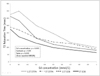
The T2 relaxation time also decreased as the gadolinium concentration increased with both contrast agents for both magnetic field strengths (p < 0.001) (Fig. 5) (Table 1). The T2 relaxation times were longer with Gd-DTPA on both 1.5T (p < 0.001) and 3T (p = 0.006) (Table 2), and they were also longer on 1.5T with both contrast agents (p < 0.001).
DISCUSSION
As mentioned in the introduction, various factors can influence the magnetic properties of gadolinium agents and the efficacy of these contrast agents. Among these factors, we evaluated the effects of contrast agents, the magnetic field strength and the gadolinium concentrations.
We used Gd-DTPA and Gd-EOB-DTPA, which are currently two of the most widely available gadolinium chelates. Gd-DTPA is an extracellular paramagnetic contrast agent and it is predominantly excreted through the kidneys (12). Due to the rapid renal elimination and the lack of biliary excretion, a contrast effect in the bile ducts cannot be achieved with this substance. Gd-EOB-DTPA is a hepatobiliary MRI contrast agent with high T1 relaxivity in the liver. It is cleared from the body by two elimination routes: receptor-specific uptake by the hepatocytes with subsequent biliary excretion and glomerular filtration in the kidneys with subsequent urinary excretion (13). Hepatobiliary elimination accounts for approximately 50% of the total elimination. The peak liver signal intensity is observed 20 minutes after injection and this is followed by plateau-like enhancement over the next two hours. In two studies, visualization of the common bile duct occurred within 10 minutes after injection and this persisted for more than 120 minutes in healthy volunteers. As such, this biliary excretion makes it possible to use this contrast agent for T1-weighted MR cholangiography (10, 14). Bile duct patency can be directly visualized with this technique. However, Gd-EOB-DTPA is not approved for patients less than 18 years old because of its unknown safety and efficacy (13). We think that diverse pediatric biliary diseases, including biliary atresia and choledochal cysts, can be good candidates for the use of Gd-EOB-DTPA, although a proper delay time is still a problem in patients with delayed biliary excretion. Further evaluation of this is needed.
Rohrer et al. (4) reported on the T2 relaxivities of each gadolinium chelate for 1.5T and 3T and they found a difference between the contrast agents. Our study also showed different T2 relaxation times for each gadolinium chelate (p < 0.001). However, these were not significantly influenced by the signal intensities and the CNRs, which could be more important when clinically interpreting the imaging.
The effects of different magnetic field strengths were also evaluated in this study and they were found to influence the signal intensities, the CNRs and the T2 relaxation times. As expected, the signal intensities were higher on 3T. However, the CNRs were lower on 3T despite an increase in the signal-to-noise ratio with high magnetic field strength. This may be due to the susceptibility effect of gadolinium. The T2 relaxation time also decreased on 3T, and this can be explained by the T2-shortening effect of high magnetic field strength.
With regard to the effect of the gadolinium concentration, both the signal intensities and the T2 relaxation times showed a negative correlation with the gadolinium concentration in our phantom study, suggesting the T2-shortening effect of gadolinium. Gadolinium chelate is expected to reach an equilibrium state in no more than 3-5 minutes after IV administration and it is thought to be distributed in the vascular and extracellular spaces at an approximate concentration of 0.1-0.5 mmol/kg (11). Our phantom study revealed a T2-shortening effect of gadolinium chelate at these concentrations. Therefore, the CNR of the saline syringe tube should increase after contrast injection in the sponge phantom with Gd-DTPA. However, the CNRs did not change (Fig. 3). Furthermore, the CNR was also equivocal in the cases with Gd-EOB-DTPA (Fig. 4). Neither the maximum CNR nor the optimal delayed imaging time with a given gadolinium concentration were achieved in this study. This may have been due to the small diameter of the syringe used to simulate a bile duct and a partial volume effect. An in vivo study may be warranted to further explore these questions. The CNRs did not change according to the different gadolinium concentrations. However, they were higher on 1.5T with both Gd-DTPA and Gd-EOB-DTPA. Additionally, Gd-EOB-DTPA is not recommended for the T2-weighted MRCP sequence because of its properties of biliary excretion (1, 15). Our study also revealed a decreased CNR of the syringe tube (simulating a bile duct) with a higher gadolinium concentration. As such, we suggest that gadolinium-enhanced T2-weighted MRCP with Gd-DTPA on 1.5T could increase the CNR without a temporal delay.
In conclusion, there is a T2-shortening effect of gadolinium and this shows a negative correlation with the gadolinium concentration for both the signal intensity and the T2 relaxation time. Additionally, a higher CNR can be obtained with Gd-DTPA at 1.5T.
 XML Download