

 PDF
PDF ePub
ePub Citation
 Print
Print


INTRODUCTION
Hepatic cysts are the most commonly found benign liver lesions on abdominal computed tomography (CT) and these hepatic cysts are characterized by a Hounsfield unit (HU) value of approximately 10 on the precontrast images (1, 2) and no enhancement after the intravenous administration of contrast material and no perceptible wall or septum (3). Nevertheless, making the accurate diagnosis of small hepatic cysts on routine contrast material-enhanced abdomen CT is often difficult when the section thickness of the CT is thick enough to be influenced by the partial volume effect with the adjacent liver parenchyma (4, 5). For the indeterminate hepatic lesions considered to be "too small to characterize" on CT, accurate characterization is often critical to exclude a primary or metastatic malignancy, and this then requires further imaging studies at an additional expense and there is potentially a delay of treatment (6-8).
Using a multidetector CT (MDCT), it is possible to scan the entire abdomen and pelvis within a single breathholding period at a resolution less than 1 mm in the x-, y- and z-axes (9-11). Isotropic voxels less than 1 mm in diameter can be obtained from this data, suggesting that the reformations will be similar in spatial resolution to those in the transverse plane. Demonstration of the benefits of multiplanar reformation for the detection and localization of an intra-abdominal disease process and the anatomical details (12-16) has resulted in coronal reformatting with a thinner section thickness being added to the routine protocol of contrast material-enhanced abdomen CT at our institution. The purpose of this study was to retrospectively assess another advantage of routinely adding the thinner coronal images reformatted from isotropic voxels for characterizing the small hepatic cysts seen on MDCT.
MATERIALS AND METHODS
This retrospective study was approved by our Committee for Clinical Investigations and the study was conducted according to the Institutional Review Board rules for departmental review of research records. Informed consent from the subjects was waived.
Patient Population
The hospital information system records and the medical records from November 1, 2007 to October 30, 2008 were retrospectively reviewed. During this period, 357 consecutive patients with chronic liver disease or underlying intra- or extrahepatic malignancy were referred to our institution for routine surveillance or preoperative evaluation, including an abdomen CT examination or liver MRI. The digitally stored abdomen CT images were preliminarily reviewed by one radiologist with five years' experience in the field of hepatic imaging to select the hypoattenuating hepatic lesions seen on the CT images. Among these patients, 125 individuals showed one or more hypoattenuating hepatic lesions that were distinguishable from the background parenchyma on the portal venous phase images obtained during the initial abdomen CT examination. Liver MRI was used as the reference standard for benign hepatic cysts in this study. Ninety one patients with no additional MRI examinations were excluded and consequently only the patients who had undergone dynamic CT examinations as the initial evaluation remained. The remaining 34 patients included 19 men and 15 women between the ages of 40 and 76 years (mean age: 58.2 years). Nine patients had colon cancer with suspected hepatic metastases, while the remaining 25 had a cirrhotic liver.
To diagnose a simple hepatic cyst, a hypoattenuating hepatic lesion on an abdomen CT scan should satisfy all of the following liver MRI criteria: 1) it is strongly hyperintense on the T2-weighted images and similar to that of the cerebrospinal fluid, 2) there is no evidence of contrast enhancement after intravenous administration of contrast material during all phases of the dynamic imaging and 3) there is no perceptible septum or wall in or around the lesion. Ninety lesions in 34 patients were selected by the study coordinator based on a preliminary review of the liver MRI and CT data. The lesions were marked on the transverse portal venous phase CT images with electronic arrows, and these images were saved on a Picture Archiving and Communication System (PACS) (Centricity RA1000 GE Healthcare, Barrington, IL) for further analyses.
CT Technique
The multiphasic CT examinations were performed with a 64-MDCT scanner (Somatom Sensation 64, Siemens Medical Solutions, Erlangen, Germany). Scanning was performed craniocaudally using the following parameters: detector configuration: 0.6 × 64 mm, gantry rotation time: 0.33 second, pitch: 1, effective mAs: 250 and kVp: 120. Each acquisition was performed during one breath-hold of 4-9 seconds, depending on the scan range. All the patients received 150 mL of IV iodinated contrast agent (Ultravist 300; Schering AG, Berlin, Germany). The warmed contrast medium was administered using an automatic injector (EnVisionCT; Medrad, Pittsburgh, PA) at a rate of 3-5 mL/s through an 18-gauge IV catheter inserted into an arm vein. To reduce contrast medium dilution and pooling in the peripheral venous dead space, all the injections were followed by a flush of 40 mL of saline administered at the same injection rate. After obtaining an unenhanced imaging of the upper abdomen, multiphasic dynamic imaging was performed (the arterial, portal and equilibrium phases). At the time of CT scanning, the arterial and delayed phase acquisitions were restricted to the upper abdomen. The portal venous phase CT examinations included the whole abdomen and pelvis, from the diaphragmatic dome to the anal verge. To determine the scanning delay for the hepatic arterial phase imaging, a 15-second delay from the time of 100 HUs of aortic enhancement was set as the starting time for the arterial phase imaging, and this was followed by portal phase imaging, which was conducted 30 seconds from the starting point of the arterial phase imaging. Three-minute delayed equilibrium phase imaging was added for the triple-phase imaging. The transverse section data was reconstructed twice for the portal venous phase scanning: first with 5-mm-thick sections at 5-mm intervals in the transverse plane and then with 0.6-mm thick sections at 0.6-mm intervals in the transverse plane. The second set of reconstructed transverse scans was then reformatted in the coronal plane with 2-mm sections at 2-mm intervals. Reconstruction was performed with a commercially available console system that was designed for rapid reconstruction (Somaris/5 syngoCT 2006 A-W, Siemens, Erlangen, Germany), which enabled the acquisition of isotropic multiplanar reformations using the source CT data set. The average number of images was 55 for the transverse scan with 5-mm-thick sections (range: 44-60 images) and 65 for the coronal scan with 2-mm-thick sections (range: 60-80 images). For interpretation, both the transverse and coronal image sets were routinely transferred to a PACS as separate series of scans.
MRI Technique
Liver MRI was performed using a 3 T unit (Signa EXCITE; GE Medical Systems, Milwaukee, WI) or a 1.5 T unit (Vision; Siemens). Among the various sequences used for routine liver MRI at our institution, the T2-weighted single-shot fast spin-echo imaging was used for characterization of hepatic cysts. For the T2-weighted imaging, the spectrally single-shot fast spin-echo (SSFSE) images (TR/TE, ∞/98 msec) and half-Fourier single-shot turbo spin echo (HASTE) images (TR/TE, ∞/94 msec) were obtained on the 3 T and 1.5 T units, respectively. Dynamic imaging was performed with the gradient echo (GRE) sequences with the ultrafast image reconstruction performed by the parallel imaging algorithms on the 3 T unit (LAVA; ASSET factor: 2, TR/TE: 3.5-4.2/1.0-1.2 msec, flip angle: 10°, matrix: 320 × 256, slice thickness: 5 mm, slice spacing: 2.5 mm, number of slices: 64, breath-holding period: 16-sec) or on the 1.5 T unit (VIBE; GRAPPA factor: 2, TR/TE: 4.4/2.1 msec, flip angle: 10°, matrix: 448 × 224, slice thickness: 5 mm, slice spacing: 2.5 mm, slices: 72, breath-holding period: 20 s). All the images were obtained in the transverse plane and the dynamic series consisted of the precontrast, arterial, portal and equilibrium phases with an intravenous injection of 15 mL of gadopentetate dimeglumine (Magnevist; Bayer Schering Pharma, Berlin, Germany).
Image Analysis
The size of the lesion at the longest dimension on the transverse images and the height as the greatest craniocaudal dimension along the scan axis on the coronal images were measured using electronic calipers on the magnified views of the lesions displayed on the four side-by-side 2048 × 2560-pixel-resolution gray-scale PACS monitors (Totoku, Tokyo, Japan). The mean HUs in the circular regions of interest (ROIs) drawn in the lesion on either the transverse or coronal images were also measured. The size, height and attenuation of each hepatic cyst was measured and recorded by two abdominal radiologists with 14 and five years of experience, respectively, by working in consensus. To reduce the intraobserver variation, all the measurement processes were repeated at an interval of two weeks by the same radiologists and the mean values of the two separate measurements were used for data description and the subsequent statistical analyses.
The 90 hepatic cysts were categorized into three groups according to the measured size of the lesions as the longest dimension on the transverse images (group I: ≤ 5 mm, group II: > 5 mm and ≤ 10 mm, group III: > 10 mm). All the lesions were classified into another three groups depending on their heights as measured by the craniocaudal dimension on the coronal images (group A: ≤ 5 mm, group B, > 5 mm and ≤ 10 mm, group C, > 10 mm).
Statistical Analysis
One-way analysis of variance (ANOVA), Tukey's multiple comparison test or Student's t test was performed to compare the HUs of the hepatic cysts from the transverse and coronal images based on the size and height categories. Subsequently, a paired t-test was used to compare the HUs of the hepatic cysts measured on the transverse images and those measured on the coronal images. Data analyses were performed with commercially available software (SPSS 2004 for Microsoft Windows, version 13.0, SPSS). We set the significance level at 5%.
RESULTS
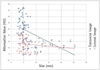
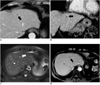
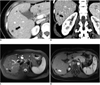
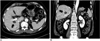
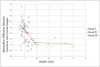
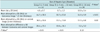
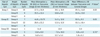
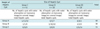
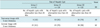
The attenuation densities of the 90 hepatic cysts on the transverse and coronal images are summarized in tables and graphs. The larger the cysts, the more their measured HUs decreased on both the transverse images (p < 0.01) and coronal images (p = 0.02) (Fig. 1) (Table 1). Tukey's multiple comparison tests revealed a significant difference of HUs among all the groups on the transverse images and between group I and group III on the coronal images (Table 2). The mean HUs measured on the coronal images were significantly lower than those measured on the transverse images in group I (44.7 versus 18.3, respectively, p < 0.01) and group II (32.7 versus 13.3, respectively, p < 0.01), but they were not significantly different from that of the group III lesions (14.5 versus 11.3, respectively, p = 0.12) (Figs. 2-4) (Table 1). The mean HU difference between the transverse and coronal images was 26.4 in group I, 19.6 in group II and 3.2 in group III. Of the 70 small hepatic cysts in group I and II (≤ 10 mm in the size), 48 (69%) showed a difference of HUs of over 20 between the transverse and coronal images (Figs. 2, 3). The mean difference of HUs between the transverse and coronal images based on height was larger for the shorter lesions than that for the taller lesions in group I (group A: 29.3, group B: 16.6; p = 0.02) and group II (group A: 30.5, group B: 16.1; p = 0.03) (Fig. 5) (Table 3).
As a rule, the internal components within hepatic cysts have a water-like HU on the unenhanced CT scans. When this diagnostic criterion was applied to the study's results (Table 4), only 12 (group I: 2, group II: 5, group III: 5) of 90 hepatic cysts showing hypoattenuation were confirmed to be true cystic lesions rather than solid components on the transverse images. On the coronal images, 36 (group I: 14, group II: 13, group III: 9) of 90 hepatic cysts could be confirmed to be cysts. Applying the established diagnostic criterion, the overall number of indeterminate lesions was reduced from 78 (87%) for the transverse images to 54 (60%) for the coronal images.
Regarding the sensitivity on the routine contrast material-enhanced CT scan, even for the 20 group III lesions that would be affected by a small partial volume effect due to the adjacent normal liver parenchyma on the 5-mm thickness transverse images as well as the 2-mm thickness coronal images, only nine (45%) demonstrated a water-like HU value below 10 on the coronal images. Most (18 out of 20, 90%) of the group III lesions revealed HU values less than or equal to 20 (Fig. 1). When a HU value of 20 or less was used as a new reference value for the imaging diagnosis of hepatic cyst on the contrast material-enhanced CT (Table 5), 79% (23 out of 29) of the group II lesions and 51% (21 out of 41) of the group I lesions could be diagnosed as benign hepatic cysts by using the 2-mm thick, coronal reformatted images.
DISCUSSION
Small hypoattenuating hepatic lesions are a common incidental finding when performing contrast material-enhanced CT of the abdomen (17, 18). Such lesions are often described as "too small to characterize" and the possibility of these lesions being metastases or primary malignancy is difficult to exclude because of the high attenuation densities of these lesions, which is the result from the partial volume effect or the pseudoenhancement phenomenon (19, 20). To evaluate non-specific abdominal symptoms or during the assessment of patients with primary or metastatic malignancy, the abdomen and pelvic CT with 5-mm-thick transverse image sections are routinely taken during the portal venous phase or the early equilibrium phase after IV injection of contrast agent. Even when performing MDCT, which is capable of isotropic data acquisition, transverse reconstruction of sections less than 5-mm thick is rarely performed to reduce the total number of transverse slices for the user's convenience as well as to minimize the image noise. For the situation of abdomen and pelvic CT with 5-mm-thick transverse images, characterization of small hypoattenuating hepatic lesions is not always easy during the clinical work without an additional review of the raw data or new image reformation using thinner sections. However, such additional processes usually delay the initial image interpretation reports and they are sometimes impossible in a big institution that handles a heavy workload in the limited time.
The current MDCT enables isotropic data acquisition and high quality coronal reformation to be feasible without any additional radiation exposure. Compared to the craniocaudal dimension, the short anterior-posterior dimension of the human body allows considerable scope for the acquisition of thinner section images along the coronal plane without a considerable increase in the number of required slices. Moreover, if the routine transverse images were obtained using the optimized image parameters for the 5-mm section thickness, the potentially increased noise on the additional coronal reformation images with thinner thickness would not be so serious for the clinical work of anatomic localization or focal lesion assessment (21). In this study, we used 2-mm coronal reformation, and we did not experience any major problems when measuring the HUs of the small lesions.
Several researchers have investigated the small hypoattenuating hepatic lesions frequently discovered on CT and they reported that most isolated small hypoattenuating hepatic lesions were benign, as verified on long-term follow-up imaging studies (22, 23). On the other hand, several imaging options besides CT exist for the evaluation of small hepatic lesions. Eberhardt et al. (24) found that targeted liver ultrasonography (US) improved the detection and characterization of hepatic lesions when such lesions were specifically sought and they were larger than 0.5 cm. Similarly, MRI can help to definitively characterize many small hepatic lesions as cysts or hemangiomas (25), and particularly if the heavily T2-weighted sequences such as single shot or turbo fast spin echo are used.
In this study, we found that the attenuation values of the small hepatic cysts and the adjacent liver appear to be additive because of the partial volume effect if the section thickness used for the transverse images exceeds the height of the lesions. Yet once the hepatic cyst was over 1 cm on the transverse images, its attenuation is not influenced as much by the partial volume effect, and there is no significant difference between the transverse and coronal images. Nevertheless, regardless of the size of hepatic cysts, quite a few hepatic cysts have an HU value unlike that of water, and even on the coronally reformatted images. A host of technical factors such as beam hardening can artifactually cause an attenuation increase exceeding 10 HUs, and this was defined as pseudoenhancement by contrast-enhanced CT studies (19, 20). In addition, various MDCT scanners from the different manufacturers behave differently at the lower range of the CT number scale, where the cyst attenuation ranged from -15.7 to 23.9 HU (26). Therefore, a strict criterion of a water-like HU value seems no longer proper for making the diagnosis of benign hepatic cysts on contrast-enhanced MDCT. Based on the results of this study, the HU values up to 20 on the contrast material-enhanced MDCT would be applicable instead of 10 HU as a strongly suggestive feature of hepatic cysts if the section thickness is no more than half the longest dimension of the hepatic lesion.
This study has several limitations. First, no pathological confirmation of our diagnoses was done, and no long-term follow-up imaging data was available due to the high probability of the lesions being benign and their small size. Liver MRI was used as an objective standard in this study. MRIs were obtained using the single-shot fast-spin echo T2-weighted imaging sequence to avoid possible T1 effects; a high resolution 3D dynamic series using gadolinium-based contrast material was also performed to exclude any enhancing components (27, 28). Despite our use of an optimized MRI protocol for the diagnosis of cysts, the detected lesions could be extremely slow-enhancing cavernous hemangiomas or completely liquefied necrotic tumors. But because these other lesions have little clinical impact and they are extremely rare, we think it is unlikely that our conclusions would be affected. Second, it might be argued that we did not compare the 2 mm transverse sections with the 2 mm coronal sections. A direct review of the isotropic raw CT data on the dedicated workstations would allow accurate measurement of the HUs of small hepatic lesions. However, in institutions that must handle many routine CT studies, radiologists might not afford to pay much attention to the details of the raw-data one by one in daily practice. Besides, the expected procedural volume of CT studies, including the raw-data, might be an obstacle for the short-term storage capacity of a PACS for the rapid access that is necessary and the practical interpretation of medical images. Considering these circumstances, the predefined reconstruction of thinner coronal images that cover the entire abdomen seems feasible with using fewer image slices. Yet depending on the available data volume in the PACS and the improved performance of hardware in the near future, thinner transverse reformation could become generalized for routine abdominal imaging. In such a situation, we expect that the incidence of the "too small to characterize" would be minimized on the transverse images. Third, the HUs of hepatic cysts may significantly vary among the different manufacturers' of MDCT machines. In a previous experimental study (26) that used a phantom, the mean attenuation values of a simple cyst with using Siemens scanners, which were utilized in that study, appeared to be centered near 0 HU, while those with the GE and Philips scanners were centered closer to 9-10 HU. When applying this study's results to clinical practice, the sensitivity and specificity of hepatic cysts on MDCT can vary on each vendor's equipment. Fourth, because of the retrospective nature of this study, we have no data about other low-density lesions for comparison to the small benign cysts. Last, we reconstructed the coronal images from the axially reformatted data during the study period; however, direct reformation of the coronal images from the raw data currently looks more feasible to obtain better quality images for most of the contemporary MDCT machines. We believe that direct reformation of the thinner coronal images will provide more reliable data that supports our results.
In conclusion, the results of this study have confirmed that thinner predefined reformation from the raw MDCT data enables us to lower the HU values to around 20, which is the HU value of larger hepatic cysts that are free from the partial volume effect in most cases, for many of the small hepatic cysts that show indeterminate attenuation densities on the routine transverse images. In the situation of imaging interpretation that is restricted by time or with the limited capacity of the data volume for long-term storage of raw data, the routine addition of thinner coronal image sets reformatted from the isotropic MDCT data can help characterize small (< 1 cm) benign hepatic cysts and reduce the number of unnecessary follow-up imaging studies and the requirement for additional MRI studies.

 XML Download