

 PDF
PDF ePub
ePub Citation
 Print
Print


INTRODUCTION
CT coronary angiography using 64-slice multi-detector CT (MDCT) is an emerging, less invasive imaging modality for evaluating the coronary arteries (1-5). CT coronary angiography is obtained by using retrospective electrocardiography (ECG)-gating and this allows the reconstruction of datasets in any phase of the cardiac cycle. In addition to the angiography, the dimensions and volumes of the cardiac chambers can be measured at the same time while performing the CT coronary angiography examination (6).
For patients with cardiac diseases such as coronary artery disease or cardiomyopathy, precise and reliable assessment of the left ventricular (LV) function and dimensions are important for predicting the prognosis (7). Previous studies have demonstrated that the retrospectively, ECG-gated MDCT determination of the LV volumes and consequently the global LV function parameters was feasible and the results were in good agreement with the established imaging modalities such as cine ventriculography, echocardiography and cine magnetic resonance imaging (6-26).
A regular and appropriate range of the heart rate (below 65 beats per minute in our hospital) is necessary for good imaging quality. A beta-blocker such as propranolol is the most widely used drug to slow down the heart rate. Previous studies reported that propranolol had inhibitory effects on the LV function (27-30). However, the sample size of those studies was small and there has been only one study that reported about the hemodynamic effects of propranolol in normal subjects. The purpose of this retrospective study is to determine the effects of propranolol (10 mg) on the LV volume during CT coronary angiography in normal subjects.
MATERIALS AND METHODS
Study Population
According to our cardiac imaging data base, 897 Chinese subjects came to our hospital for health screening examinations, which included CT coronary angiography, from March 2007 to July 2008. All the subjects received beta-blocker (propranolol, 10 mg) per-oral 30 minutes before the CT scan, except those having a heart rate below 65 beats per minutes. The dosage of propranolol was adjusted according to the heart rate to ensure the heart rate was below 65. A total of 403 subjects were excluded from this study due to one of the following criteria: 1) any luminal diameter stenosis in any of the coronary arteries found on images, 2) arrhythmia or an abnormal ECG, or 3) a history of hypertension with or without medication. In the remaining 494 subjects, 126 who took propranolol to decrease their heart rate and another 126 age- and gender-matched ones who had a heart rate below 65 beats were chosen for this retrospective study. The approval from the institutional ethical committee was obtained before undertaking the study. Informed consent was not required.
CT Coronary Angiography Protocol
CT coronary angiography was performed on a 64-slice MDCT scanner (Brilliance; Philips Medical Systems, Cleveland, OH) during a single breath-hold period (8-10 seconds). The parameters of our scanning protocol were 64 × 0.625-mm collimation, 120-140 kV, 800-1000 mA, a 0.42 second rotation time, a pitch value of 0.2, a 0.8-mm slice thickness and a 0.6-mm reconstruction interval. The bolus-tracking method was used and the scanning field included the entire heart from the proximal aorta (1-2 cm below the carina) to the cardiac apex. Sixty to 90 mL of iodinated contrast medium (Ioversol, Optiray 320 mg I/mL, Tyco Healthcare, Canada) was injected intravenously via an antecubital vein at a flow rate of 5 mL/s and this was followed by 50 mL of saline at the same flow rate. A region of interest was placed on the aortic root. The scan was automatically initiated 6 seconds after the CT number of the region of interest reached 120 Hounsfield units. According to the scanning protocol of our hospital, no radiation dose modulation was used to secure good image quality. The average radiation dose was 17.9 ± 3.2 mSv.
Image Analysis
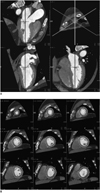
The retrospective ECG-gated reconstructions were performed to generate image data at every 5% of the R-R interval from 0% to 95% of the R-R interval and then the image data was transferred to the workstation for further post-processing (Philips Extended Brilliance Workspace v3.5, The Netherland). The LV volume of twenty phases was estimated by semi-automated methods and this was normalized by the body surface area. The endocardial contours were automatically detected by the software of the workstation; the contour detection was visually checked and manually corrected if considered necessary (Fig. 1A, B). Papillary muscles were included in the LV cavity. The following global LV functional parameters were calculated: the minimal volume as the end-systolic volume (real-ESV), the maximal volume as the end-diastolic volume (real-EDV) and the ejection fraction (real-EF) by using the formula EF (%) = (EDV-ESV) × 100 / EDV.
Data Collection and Statistical Analysis
The average heart rates before the CT scans, after medication if necessary, after breath holding and during the CT scans were recorded. The dosage of propranolol, the heart rate, the systolic blood pressure (SBP) and the diastolic blood pressure (DBP) before and after taking propranolol were recorded.
Data analysis was performed using the STATA 10 software (Stata, TX). To evaluate the inter- and intra-observer reproducibility, two observers performed the analyses independently and one did the second analyses the next week. We then calculated the concordance correlation coefficient for the continuous data. We tested whether the volume of a particularly chosen diastolic phase such as the 0% phase and the systolic phase such as the 35%, 40% and 45% phases could replace the real-EDV and the real-ESV through the use of Student's t-test. The heart rate difference was analyzed by the logistic linear regression model for the mixture of categorical and numerical data with the independent variables, which included the gender, age, height, weight, SBP, DBP and the dosage of propranolol. The differences of parameters, including the real-EF, real-EDV, real-ESV, SBP and DBP, in 252 subjects whether or not propranolol medication was used were tested through Student's t-test. P values less than 0.05 were considered statistically significant.
RESULTS
A total of 252 normal subjects (M:F = 150:102; mean age, 56 ± 11 years; mean body height, 163.1 ± 8.3 cm; mean body weight, 66.7 ± 12 kg and mean body surface area, 1.72 ± 0.18 /m2) (Table 1) were included in this study. All the images of the coronary CT angiography were of diagnostic image quality. For the inter-observer analysis, no statistically significant difference was found between the estimations of the real-EDV (r = 0.976, p > 0.05) and the real-ESV (r = 0.957, p > 0.05). For the intra-observer analysis, no statistically significant difference was found between the repeated measurements of the real-EDV (r = 0.996, p > 0.05) and the real-ESV (r = 0.997, p > 0.05).
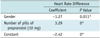
The mean heart rate of the 126 subjects who did not take propranolol was 59 ± 6 beats per minute; the mean heart rates of the other 126 subjects, who had taken propranolol, was 72 ± 7 beats per minute before medication and 63 ± 5 beats per minute after medication, respectively. After evaluation of the factors, including gender, age, height, weight, SBP, DBP and the number of pills of 10 mg propranolol from the logistic regression model, the difference of heart rate before and during CT scan was significantly influenced only by gender and dosage of beta-blocker (Table 2).
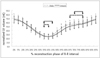
The LV volume of the total 252 subjects was estimated and normalized; the real-EDV ranged from 48.1 to 109 (mean: 70.9 ± 9.9) mL/m2 and the real-ESV ranged from 6.1 to 57.1 (mean: 24.6 ± 6.9) mL/m2. The real-EF ranged from 41% to 88% (mean: 65.6 ± 7%). According the volume data of twenty phases, a volume-time curve (Fig. 2) was obtained. The three global LV functional parameters showed no difference according to gender. The mean real-EDV, the real-ESV and the real-EF of the male and female subjects were 69.1 ± 9.3 and 70.8 ± 8.9 mL/m2 (p > 0.05), 24.1 ± 5.6 and 24.7 ± 4.3 mL/m2 (p > 0.05) and 65.3 ± 5.5 and 65.1 ± 4.8% (p > 0.05), respectively. Fifty eight percent (147 of 252) of the subjects had a maximal LV volume at the 0% phase and 42% (105 of 252) had a maximal LV volume at the 95% phase. Two percent (4 of 252) of the subjects had a minimal volume at the 30% phase, 32% (81 of 252) had a minimal LV volume at the 35% phase, 52% (131 of 252) had a minimal LV volume at the 40% phase, 14% (35 of 252) had a minimal LV volume at the 45% phase and 0.4% (1 of 294) had a minimal LV volume at the 50% phase.
The mean difference between the real-EDV (70.9 ± 9.9 mL/m2), the 0% EDV (70.5 ± 9.8 mL/m2), and the mean difference between the real-EDV, the 95% phase EDV (70.1 ± 10 mL/m2) had no statistical significance (p > 0.05), and neither did the mean difference between the real-ESV (24.6 ± 6.9 mL/m2) and the 40% phase LV volume (26.4 ± 7.5 mL/m2, p > 0.05). However, the mean difference between the real-ESV, the 35% phase LV volume (26.4 ± 7.5 mL/m2, p = 0.0023), and the mean difference between the real-ESV, the 45% phase LV volume (28.9 ± 8.1 mL/m2, p = 0) were significantly different as were the real-EF (65.6 ± 7%) compared to the EF calculated from the 0-35% (62.8 ± 7.9%, p = 0), 0-40% (64.1 ± 7.3%, p = 0.01) and 0-45% phase volumes (59.3 ± 8.6%, p = 0). The percentage of the mean difference between the real- and 0-35%, the real- and 0-40% and the real- and 0-45% phase EF was 3%, 2% and 6%, respectively.
The mean SBP and DBP of the 126 subjects who had not taken propranolol was 123 ± 17 and 80 ± 10 mmHg, respectively. The mean SBP and DBP of the other 126 subjects, who had taken propranolol, were 120 ± 14 mmHg and 80 ± 11 mmHg, respectively. There was no significant difference in the SBP and DBP between these two groups (p > 0.05). The real-EDV, real-ESV and real-EF were 69.4 ± 9.3 mL/m2, 23.5 ± 5.7 mL/m2 and 66.5 ± 5.1% for the 126 subjects without the medication, respectively; and the real-EDV, real-ESV and real-EF were 70.6 ± 8.9 mL/m2, 25.6 ± 3.7 mL/m2 and 63.5 ± 4.6% for the 126 subjects who had taken propranolol, respectively. The real-ESV and real-EF had significant differences between the groups without and with medication (p < 0.05), but the real-EDV showed no significant difference between these two groups (Table 3).
DISCUSSION
Beta-blocker is commonly used to reduce the heart rate to less than 65 beats per minutes in order to get good imaging quality for coronary angiography. Our results show the heart rate difference is influenced by gender and the administered dosage of propranolol during CT coronary angiography. The female subjects in our study had a greater decrease of the heart rate than did the males after taking propranolol. One report showed that women had greater metoprolol exposure than did the men and a greater reduction of the exercise heart rate (31).
In our study, the 35-40% and 65-80% phases of the RR interval in males and the 35-45% and 70-80% phases of the RR interval in females showed the smallest slope, which indicates the least LV volumetric change. These are the most frequent reconstruction phases we used for the evaluation of the coronary arteries (32). One study claimed that 64-slice CT coronary angiography provided the best image quality in mid-diastole such as the 60% and 65% phases with using a Siemens 64-slice CT scanner (33). In another study using dual-source CT, the optimal reconstruction phase was at 75% of the R-R interval in subjects with low or intermediate heart rates. In patients with heart rates faster than 80 beats per minutes, the systolic reconstructions often yield superior image quality as compared to the diastolic reconstructions (34). The slightly different preference in phase selection could be related to the different definition of the % phase of the R-R interval of different CT scanners, such as the beginning of the acquisition window within the R-R interval for the Siemens scanner and the center of the acquisition window for the General Electric, Philips and Toshiba scanners.
Left ventricular EF is one of the indices of cardiac function and it is usually evaluated by the safer but operator dependant echocardiography. It can be calculated from post-processing of the raw data from the CT coronary angiography by retrospective reconstruction of the systolic phase and diastolic phase images, which is nearly as good as MRI and better than two-dimensional echocardiography or ECG-gated single photon emission computed tomography (SPECT) (23-26). Underestimation of the left ventricular volume in our study is possible due to the exclusion of some volume below the mitral valve when we set the upper limit at the concave center of the mitral valve. Overestimation or underestimation of the LV volume has been reported because of the different criteria for selecting the endocardial boundary or the inclusion/exclusion of papillary muscle (6-15, 18, 20-24). Estimation of the real-EF from all twenty phases is more precise; however, this takes more than half an hour with some efforts. From our results, direct choices of the 40% RR interval as the systolic phase and the 0% RR interval as the diastolic phase are recommended because the real-ESV has no statistically significant difference compared to the 40% phase LV volume, and the EF calculated from the 0-40% phase volume has the least variation (2%) from the real-EF, and this is similar to the conclusion of Suzuki's study (17).
One study reported that propranolol administration in the normal subjects decreased the resting heart rate and the EF, it increased the EDV and ESV, but had no effect on the systolic and diastolic blood pressure, although the sample size was small (28). Some of the animal and patient studies have demonstrated that medicating with beta-blocker in subjects who have cardiac disease results in a significant reduction of the heart rate and ejection fraction, whereas the EDV and ESV are increased (27, 29). One animal study reported that the inhibitory effects of propranolol on the LV function were represented by the negative inotropic action on cardiac contractility, which was shown as an increase in the ESV and a marked reduction in the HR, but there was little dilating action on the EDV (30). Similarly, our results revealed that propranolol had no effect on the SBP and DBP, but it caused an increase of the ESV, which contributed to the decrease of the EF; the EDV was not statistically influenced by propranolol medication, but a slight increase was noted.
Our study had some limitations. First, different subject groups were compared for the assessing the effect of beta-blocker effect, although we used age- and gender-matched inclusion criteria to minimize the heterogeneity. Second, there may have been additional independent variables that affected the reduction of the heart rate such as variability of the vasovagal response while breath holding or individual differences of susceptibility to the beta-blocker.
In conclusion, the difference of heart rate is only significantly influenced by gender and the use of propranolol. In addition to the decreased heart rate, propranolol will also increase the end systolic volume of the left ventricle, which contributes to a decrease in the ejection fraction, while the systolic blood pressure, diastolic blood pressure and the end diastolic volume of the left ventricle are not statistically changed.


 XML Download