

 PDF
PDF ePub
ePub Citation
 Print
Print


INTRODUCTION
Congenital lung lesions, including congenial pulmonary airway malformation (CPAM), bronchial atresia, congenital lobar emphysema and pulmonary sequestration, are increasingly undergoing non-invasive imaging evaluation because of vigilant prenatal surveillance. In this regard, CT plays an important role for making the diagnosis by identifying typical findings such as cysts, mucocele and the systemic arterial blood supply (1). Nonetheless, the diagnosis of some of these patients remains inconclusive or the patients have more than two pathologies. Hyperlucency in a lung lesion seen on CT is attributed to a reduced tissue-to-air ratio. This may be due to air trapping, tissue loss or a combination of both. Expiratory CT may be used to confirm air trapping in congenital hyperlucent lung lesions. However, dynamic evaluation of ventilation such as the collateral ventilation is beyond the capability of conventional CT. The recently introduced xenon-enhanced dual-energy CT offers assessing the ventilation function in addition to providing the anatomic details of a lung lesion in a single examination (2). This imaging technique has also been proven to be safe without serious side effects in both children and adults (2-7). Goo et al. (4) demonstrated collateral ventilation and air trapping in a child with bronchial atresia by using xenon-enhanced dynamic dual-energy CT. Ventilation scintigraphy has on rare occasion been used for demonstrating collateral ventilation in congenital hyperlucent lung lesions (8-10). In those reports, collateral ventilation and air trapping were shown in bronchial atresia and pulmonary sequestration, while CPAM was seen as a ventilation defect. However, this imaging modality is critically limited by its poor spatial resolution as well as the technical difficulties in young children. The purpose of this study was to evaluate the resistance to collateral ventilation in congenital hyperlucent lung lesions and to correlate this with the anatomic findings on xenon-enhanced dynamic dual-energy CT.
MATERIALS AND METHODS
This study was approved by the Institutional Review Board of our institution and written informed consent was obtained from all the parents.
Patients
The congenial hyperlucent lung lesions supplied by systemic arteries and that showed indications of pulmonary sequestration on CT were excluded from this study because the intravenous injection of an iodinated contrast agent is necessary for the evaluation of pulmonary sequestration and this would significantly affect xenon enhancement. Between February 2008 and May 2010, nine children with congenital hyperlucent lung lesions underwent xenon-enhanced dynamic dual-energy CT. One of the nine children was excluded from the evaluation due to inadequate xenon inhalation that was caused by a loose fitting face mask. Thus, eight children (median age: 5.5 years, age range: 1-12 years, 4 boys and 4 girls) were finally included in this study: the diagnoses based on CT findings were bronchial atresia in four and CPAM in four. Among the eight, two underwent surgical resection for presumed CPAM seen on CT and they were histologically proven to have CPAM. The locations of the lesions were the left upper lobe in four children, the right upper lobe in two, the left lower lobe in one and the right lower lobe in one. On CT, one segment was involved with a congenial hyperlucent lung lesion in four patients, two segments were involved in two patients, three segments were involved in one patient and four segments were involved in one patient.
The respiratory rate, oxygen saturation and blood pressure were recorded before and after the dual-energy CT. Three young children (1-2 years of age) were sedated for the CT examination with oral chloral hydrate. Hence, only five conscious children (4-12 years of age) could be asked about any uncomfortable feedings or side effects.
Xenon-Enhanced Dynamic Dual-Energy CT
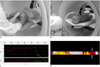
A patient inhaled a mixture of 30% xenon and 70% oxygen via a xenon gas rebreathing system (AZ-726; Anzai Medical, Tokyo, Japan) and a face mask (King Systems, Nobelsville, IN). The mask was fitted to a child's face with hands for a young and sedated child, or with elastic straps for an older and cooperative child (Fig. 1). The concentrations of exhaled xenon and carbon dioxide, as well as the inhaled xenon and oxygen, were monitored with the xenon ventilator. To be in compliance with the physiologic variations of respiration, xenon was inhaled until the exhaled xenon concentration reached 25-30% (the wash-in phase). At this concentration of exhaled xenon, most of the normal lung may be considered to be largely saturated with 30% xenon gas. After the cessation of xenon inhalation, 100% oxygen was inhaled during the rest of the study (the wash-out phase).
The dual-energy (80 kV and 140 kV) CT scan was acquired with a dual-source CT system (SOMATOM Definition; Siemens Medical Solutions, Forchheim, Germany) with 14 × 1.2-mm collimation, a 0.45 pitch, a 0.33 second rotation time and a 512 × 512-pixel matrix. The body weight-adaptive volume CT dose index (CTDIvol, in units of mGy) values for dual-energy CT were the same as those for single-energy pediatric chest CT: 2.7 for 10.0-19.9 kg, 3.9 for 20.0-39.9 kg, 5.7 for 40.0-59.9 kg and 8.8 for 60.0-69.9 kg. The tube current for the 80 kV was adjusted to four times greater than that for the 140 kV to allow comparable image noise at the two kV levels. The dose-length product (DLP, in units of mGy·cm)-based dose estimates of dual-energy CT were calculated according to age, gender and the scanner-specific conversion factors for pediatric CT (11).
For all the patients, the free-breathing 9-11 phase dynamic dual-energy spiral CT scans were acquired at the middle of each lung lesion during the wash-in and wash-out periods of xenon inhalation (Fig. 1). The shortest longitudinal scan coverage, approximately 2.6-3.0 cm, was used to minimize the radiation exposure. A baseline scan was followed by 7-9 dynamic scans that started 20 sec after xenon inhalation, with the interscan delay of approximately 10-20 sec except for 1 min 30 sec for the last scan (Fig. 1). The 2nd-5th dynamic scans were acquired during the wash-in period (Fig. 1).
CT Data Analysis
The axial xenon maps and weighted-average images with a section thickness of 3.0-4.0 mm were reconstructed at a dual-energy workstation by using a class modified from the application class for lung perfusion analysis (Syngo Dual Energy Lung PBV; Siemens Medical Solutions). In the class for xenon extraction, the three material parameters were modified as follows: 1) -990 Hounsfield (HU) at 80 kV and -1000 HU at 140 kV for air, 2) 70 HU at 80 kV and 54 HU at 140 kV for soft tissue, 3) 1.95 for relative contrast material enhancement; minimum value: -1024, maximum value: -300 ~ -500 and range: four. On the other hand, the weighted-average images were generated by using the weighting ratio of 1:4 (140-kV image: 80-kV image) to produce 120-kV equivalent images.
The CT data was analyzed by two radiologists who worked in consensus. For all the patients, the xenon values and CT densities were measured in the whole lung lesion and these were compared with those in the whole normal areas. Out of the whole lung areas, the large pulmonary vessels and the lung portions that showed severe motion artifacts were excluded from the measurements. Their temporal changes were analyzed by means of the time-xenon value and the time-attenuation curves, and the lung lesions were categorized into two groups (the high and low groups) according to the resistance to collateral ventilation. As the threshold of xenon enhancement for this categorization, the amplitude of xenon enhancement (A) value of 10 HU was used since a lower level of xenon enhancement might be affected by the image noise of the xenon maps (up to 10 HU). When fitting errors occurred due to low values, the time-xenon enhancement curves were used for confirming the lesions with high resistance to collateral ventilation. Collateral ventilation does not substantially contribute to lung function in the normal lung because of the considerably high resistance to collateral ventilation in the normal lung (12). On the contrary, the resistance to collateral ventilation may be relatively decreased in lung lesions with impaired airflow through the normal airways, which facilitates collateral ventilation to the lung lesions. Because xenon is a contrast agent for lung ventilation administered through the airways, the xenon enhancement in congenital hyperlucent lung lesions seems to reflect the regional lung ventilation through the collateral pathways. In this regard, the amplitude and the rate of xenon enhancement, as well as the time of arrival of xenon gas, measured in these lung lesions by using xenon-enhanced dual-energy CT may be used for the quantitative assessment of collateral ventilation for these lung lesions. In addition, in-house software based on the Matlab program (Mathworks, Natick, MA) was used to generate A, the rate of xenon enhancement (K) and the TOA50% (the time of arrival of the half maximum xenon concentration) maps. For curve fitting of the time-xenon value curves, a single-compartment exponential model (13), the so-called Kety model, which was created by using a nonlinear least-squares curve-fitting procedure, was used. On the weighted-average images, the morphologic CT findings associated with the lung lesions were assessed, such as cyst, mucocele and accessory or incomplete fissure. The morphologic CT findings were then correlated with the resistance to collateral ventilation.
RESULTS
Xenon-enhanced dynamic dual-energy CT was successfully performed in all the patients with stable vital signs and without severe side effects. Minor and temporary (< several min) side effects were documented in two out of the five conscious children: numbed arms and legs in the one, and discomfort in breathing during xenon inhalation in the other. Side effects could not be recognized in the remaining three sedated children. The xenon wash-in times were variable (60.4 ± 20.2 sec, range: 37-90 sec).
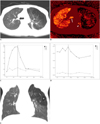
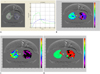
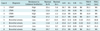
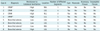
In the normal lung, the xenon values rapidly increased during the wash-in period and they rapidly dropped to the baseline level during the wash-out period with a logarithmic function (Figs. 2, 3). On the contrary, the time-attenuation curves were subject to irregular patterns (Fig. 2D) due to bigger attenuation changes from the different respiration levels during free breathing that made the evaluation difficult or impossible. In three of the total eight lung lesions, the A values were higher than 10 HU and these were categorized into the lesions with low resistance to collateral ventilation (Table 1). In the remaining five lesions, the A values could not be calculated due to fitting error and the maximal xenon enhancement was lower than 10 HU (Table 1). On these occasions, the time-xenon enhancement curve that showed no discernible xenon enhancement in the lesion throughout the wash-in and wash-out periods was used to categorize the lesion as the one with high resistance to collateral ventilation (Fig. 2). For the low resistance to collateral ventilation, the curve showed xenon enhancement higher than 10 HU and lower than the normal level during the wash-in period followed by xenon retention during the wash-out period (Fig. 3). The maximal xenon values (13.8-29.7 HU) in the normal lung were higher than those (-3.6 ~ 10.5 HU) in the congenital hyperlucent lung lesions (Table 1). The A values (21.7-27.5 HU) in the normal lung were higher than those (10.0-13.7 HU) in the lesions with low resistance to collateral ventilation (Fig. 3B, Table 1). The K values (0.04-0.09) in the normal lung were also higher than those (0.01-0.02) in the lesions with low resistance to collateral ventilation (Fig. 3C) (Table 1). The TOA50% values were in the range of 11.3-24.1 sec in the normal lung, while they were delayed in the lesions with low resistance to collateral ventilation (34.3-60.8 sec) (Fig. 3D) (Table 1). The same as for the A values, the K and TOA50% values could not be calculated in the lesions with high resistance to collateral ventilation due to fitting error.
Regarding the morphologic CT findings, cysts were identified in five lesions, a mucocele was identified in four, an accessory fissure was identified in three and an incomplete fissure was identified in two (Table 2). The presence of cysts in the congenital hyperlucent lung lesions was a diagnostic clue for CPAM. In fact, two of the lesions were pathologically proven to be CPAM. On the other hand, the presence of a mucocele suggested the diagnosis of bronchial atresia. In a patient (case 7) with presumed bronchial atresia, it was suggested that CPAM might be present in a portion of the lesion because a few cysts in addition to a mucocele were seen. Of the five lesions showing high resistance to collateral ventilation on xenon-enhanced dynamic dual-energy CT, three lesions had both cysts and an accessory fissure, and each of the lesions showed either cysts or an accessory fissure on the weighted-average CT images (Table 2).
The CTDIvol derived from a 32-cm CTDI phantom and the DLP derived from a 16-cm CTDI phantom of the dual energy CT were 2.7 ± 0.7 mGy and 107.7 ± 38.5 mGy·cm, respectively. The DLP-based effective dose of the dual-energy CT was 2.3 ± 0.6 mSv (range: 1.4-3.0 mSv).
DISCUSSION
This study demonstrated that xenon-enhanced dynamic dual-energy CT is feasible to evaluate the collateral ventilation to congenital hyperlucent lung lesions. Therefore, the lesions could be classified into two categories with a high or low resistance to collateral ventilation on the xenon-enhanced dynamic dual-energy CT. The maximal xenon or A values in the normal lung were higher than those in the congenital hyperlucent lung lesions. In the normal lung, the range (21.7-27.5 HU) of the A values obtained after the curve fitting was, of interest, narrower than that (13.8-29.7 HU) of the maximal xenon values measured directly on the xenon maps. The A values calculated in the normal lungs in this study were slightly higher than those values in a previous study (13-23 HU) (2). This difference might be attributed to the variable washin times that were adjusted to the individual respiratory function and that were used in this study. In addition, the degree of collateral ventilation could be quantified in the three lesions with a low resistance to collateral ventilation. The aerodynamics of the low-resistant collateral ventilation could be characterized by the lower A and K values, the greater TOA values and the delayed wash-out of xenon. These features of the low-resistant collateral ventilation could be similarly demonstrated on xenon-enhanced dynamic dual-energy CT in a canine model with bronchial obstruction (14). In that animal study (14), the TOA-based air flow directions of collateral flow to the obstructed lung segment could be shown, i.e., from the adjacent, normally ventilated lung to the peripheral portion of the obstructed lung via collateral channels and then to the central portion of the obstructed lung via the bronchioles in the obstructed segment. The normal K values were higher in this current study, i.e., 0.04-0.09, than those K values in another previous study, i.e., 0.02-0.03 (2). This difference seems to be caused by fundamental differences in lung physiology between the two study populations, that is, children in this study and adults in the other study. For instance, children have higher respiratory rates and smaller tidal volumes, as compared with adults. Additionally, this difference might have been caused by some differences in the fitting parameters used for the quantitative evaluation of xenon-enhanced dynamic dual-energy CT between the two studies.
Low-resistant collateral ventilation was observed in three of four patients with bronchial atresia in this study. This may be explained by the fact that the resistance to collateral ventilation is low enough to facilitate air flow through collateral channels in a segment with airway obstruction, as opposed to healthy lungs where collateral ventilation does not substantially contribute to lung ventilation because of the 50-times higher air flow resistance through the collateral channels than the resistance through the airways (12). It has been established that collateral ventilation contributes to gas exchange in the lesions with airway obstruction. In this respect, the presence of low-resistant collateral ventilation may play a role in supporting the lung function in patients with bronchial atresia. The aerodynamics of collateral ventilation in bronchial atresia was anecdotally demonstrated on ventilation scintigraphy (8) and xenon-enhanced dynamic dual-energy CT (4). Other imaging modalities such as ventilation scintigraphy and hyperpolarized gas MRI can be used to assess the collateral ventilation. However, ventilation scintigraphy cannot provide anatomic details of congenital lung lesions because of its inherently poor spatial resolution, and ventilation scintigraphy may be limited by the technical difficulties in children who cannot follow breathing instructions. Hyperpolarized gas MRI is also substantially limited by the lack of wide availability. On the contrary, xenon-enhanced dynamic dual-energy CT can provide the regional aerodynamics as well as the anatomic details of the lung lesions during free-breathing. On top of that, this emerging imaging technique has become widely available as more CT systems are capable of dual-energy applications.
Among the morphologic CT findings, cysts and an accessory fissure seemed to be related to the high-resistant collateral ventilation seen on xenon-enhanced dynamic dual-energy CT (Table 2). We can speculate that CPAM may have a high resistance to collateral ventilation as the identification of cysts in the congenital hyperlucent lung lesions seen on CT is an important clue to diagnose CPAM. Markedly decreased ventilation in CPAM was also previously demonstrated by ventilation scintigraphy (9). The high resistance may be attributed to the fact that CPAM has a communication with the airways and CPAM is dysplastic lung tissue with possibly less collateral channels. The accessory fissure adjacent to the congenital hyperlucent lung lesions seemed to act as an anatomic barrier to collateral ventilation, as all of the three patients with an accessory fissure showed high-resistant collateral ventilation on the xenon-enhanced dynamic dual-energy CT in this study. It has been shown that in patients with emphysema, collateral ventilation through an incomplete fissure may incapacitate the therapeutic effectiveness of bronchoscopic lung volume reduction by hampering the collapse of a nonfunctioning lung segment (12). In addition, the recognition of an accessory fissure may alter the surgical strategies for a lung lesion, while an incomplete fissure may contribute to postoperative air leakage.
This study once again confirmed that 30% xenon inhalation for up to 90 sec for the evaluation of lung ventilation is safe with the patients having stable vital signs throughout the CT examination and it was without serious side effects such as respiratory depression. In the sedated children, the recovery from sedation after the xenon-enhanced dynamic dual-energy CT examinations was not different from that after other CT examinations. The radiation dose of dual-energy CT is another safety issue. In this study, the dose estimates (1.4-3.0 mSv) of the xenon-enhanced dynamic dual-energy CT were comparable to the reference dose ranges for single-energy CT in children: 1.3-1.9 mSv at our institution, 2.2-3.4 mSv on a German survey and 3.6-6.3 mSv on a UK survey (11).
Albeit promising, xenon-enhanced dynamic dual-energy CT has several technical limitations. Although the xenon values were less affected than the CT densities by respiratory motions (Fig. 2), the dynamic evaluation is still affected by respiratory misregistration artifacts during free-breathing, and particularly for a lower lung lesion. This limitation can be overcome by respiratory-triggered data acquisition. The low xenon values or their subtle changes might be unnoticed due to background noise (the standard deviation of the xenon values: up to 10 HU). This can be overcome by using greater signal-to-noise ratios and X-ray energy spectra separations with using an additional tin filter. The use of ionizing radiation is a general limitation of CT. However, the CT dose was minimized and individually adapted to the body size in this study. The small number of patients was a limitation of this study. In addition, the fact that only two patients with CPAM were pathologically proven was a limitation of this study. However, surgical resection is generally not an obligatory treatment for asymptomatic patients with congenital hyperlucent lung lesions.
In conclusion, xenon-enhanced dynamic dual-energy CT can visualize and quantitate the various degrees of collateral ventilation to congenital hyperlucent lung lesions in addition to assessing the anatomic details of the lung. Anatomic CT findings such as cysts or an accessory fissure in the lung lesions may be associated with high resistance to collateral ventilation on xenon-enhanced dynamic dual-energy CT.
 XML Download