

 PDF
PDF ePub
ePub Citation
 Print
Print


INTRODUCTION
CT has been the main imaging modality for the detection, characterization and follow-up of lung nodules, and lung nodules are the major radiologic finding of primary and metastatic lung cancers. These tasks have traditionally been performed by a combination of visual assessment and manual measurement by radiologists; however, the advances in CT technology in recent years have enabled newer and better performance in this endeavor with the development of 3D volumetric imaging as well as numerous post-processing techniques. Further, with the advent of picture archiving and communication systems (PACS), access to digital images is now easier and faster than ever before. This unprecedented wealth of digital images has led to the development of computer-aided diagnosis (CAD) for the evaluation of lung nodules.
A good indication for applying CAD can be seen in the use of low-dose CT during lung cancer screening, which is typically a repetitive and burdensome task of dealing with mostly normal images. As a large proportion of the nodules detected on screening CT are smaller than 4 mm in diameter and most of them are benign, determining the malignancy of nodules by nodule characterization is crucial. Nodule growth, which is expressed as the volume doubling time, can be an important discriminator for this purpose. In addition to the screening setting, CAD can also be applied to various oncologic settings for identifying metastatic lung nodules as well as monitoring the therapy for lung metastasis.
The goals of CAD for the evaluation of lung nodules are to assist radiologists in detecting lung nodules, differentiating benign from malignant nodules, monitoring the treatment response and enhancing the workflow. The purpose of this article is to review the current status of CAD in the evaluation of lung nodules and to suggest its future directions.
Nodule Detection
Computer-Aided Diagnosis Performance
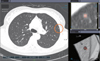
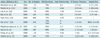
In terms of spatial and contrast resolution, CT is currently the best imaging modality for evaluating lung nodules. However, lung nodules on chest CT, and especially those smaller than 5 mm, can easily be missed by the reader when using visual assessment alone. CAD has been shown in many studies to be able to improve radiologists' performance for detecting these lung nodules (1-7) (Fig. 1). Many investigators have reported a wide range of sensitivities using CAD from 54% to 95% with false positive rates of 0.55 to 8.3 per examination for detecting lung nodules (3-4, 6-13) (Table 1). However, it is difficult to compare the results of CAD's performance from the various studies as most of the performances were evaluated with different data sets, and particularly a different size database, the different nature and characteristics of the nodules and various evaluation methods, as well as the differences in the employed CAD algorithm. In addition, the standard of reference for the presence of nodule in most previous studies was usually determined by an expert panel, and this determination may be subjective. Substantial variability has been reported in establishing a "truth" reference for identifying nodules on CT scans (14).
The scan and reconstruction parameters of CT and the number of false positive detections are also important factors. In general, the sensitivity can be increased at the cost of increasing the number of false positive detections. Das et al. (12) compared the effects of two commercial CAD systems with using the same dataset, and the overall sensitivities for each system were 73% and 75% with false positive rates of 6% and 8%, respectively.
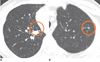
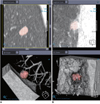
There have been several studies that have compared the performance of radiologists and CAD (11, 15). These studies have shown that the CAD system performs the nodule detection task differently from that of a radiologist. In a study by Lee et al. (15), the sensitivity of the CAD system for detecting isolated nodules was significantly higher than that of a radiologist, while the sensitivities of a radiologist for detecting nodules > 5 mm and nodules attached to other structures were higher than those of the CAD system. Similarly, Marten et al. (11) showed that detection of nodules 5 mm or less in diameter was significantly higher for a CAD system than that for readers. In addition, while the CAD system detected more nodules that were without vascular attachment, the readers detected more nodules with vascular attachment (Fig. 2). If we may sum up these findings, in general, a CAD system is good at detecting isolated and small nodules, while radiologists are better at detecting attached and relatively larger nodules.
It has been shown that for detecting nodules, CAD can assist observers more effectively than a second reader, and therefore the combined performance of radiologists with CAD may be better than that of a double reading. In one such study by Rubin et al. (16), the mean sensitivity for an individual reading was 50% and a double reading resulted in an increase to 63%. Yet with CAD, by setting a threshold of three false positive detections per CT scan, the mean sensitivity was able to be increased to 76%.
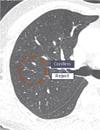
However, high sensitivity has been known to be highly related to the number of false positive markings. As rejecting the numerous false positive markings generated by the CAD system is time consuming, the number of false positive markings should always be a consideration. Although there is no consensus on the acceptable false positive rate, five or less false positive detections per case would be acceptable because the false positive marks when detecting lung nodule with CAD are usually easy to reject. Various features may cause a false positive marking such as scars, bronchial wall thickening, vessel bifurcations, motion artifacts and inadequate segmentation of the mediastinal structures (Fig. 3).
As for the time required to perform CAD, in a study by Beigelman-Aubry et al. (3), the overall reading time on the CAD workstation and the clinical workstation was comparable. The average time required to assess all the CAD marks per case was 39 seconds (3) and most of the CAD false marks could be easily dismissed. The average reading time per CAD mark is usually between 5 to 8 seconds (3, 16).
Detection of Malignant Nodules
The ultimate task of CAD in the detection of lung nodules is whether this approach can enhance the observers' performance for detecting malignant lung nodules (17). Li et al. (18) performed an observer study to evaluate whether a CAD scheme can help radiologists detect the peripheral lung cancers missed at low-dose CT and they showed that the use of CAD could improve radiologists' performance for detecting subtle cancers. In that study, 17 cases with missed peripheral lung cancer and 10 control cases were included. The cases with coexisting benign nodules were excluded. When CAD was applied in the patients who underwent metastasectomy, the sensitivity increased significantly from 86-91% to 94-95% for detecting malignant nodules (5). In another study by Goo et al. (4), the effect of CAD on the observer's performance using a database that included normal cases, benign nodule cases and cases with lung cancers was evaluated. The database consisted of 150 CT scans that included 352 nodules and 23 lung cancers. The readers were asked to record the likelihood of the presence of a nodule and the likelihood of malignancy separately. This study showed that the use of CAD contributed to the detection of additional lung cancers by less experienced readers. Yet on the statistical analysis, while the detection of nodule was significantly increased, the cancer detection rate was not significantly increased. These results indicate that another scheme of characterization in addition to nodule detection may be necessary to achieve the ultimate goal of detecting malignant nodules.
Scanning and Reconstruction Parameters of CT Scanning
Several technical aspects of CT scanning are related to the performance of CAD. The use of a narrow collimation with reconstructions of thin sections significantly improves the detection of nodule, and CAD is not recommended for CTs 4 mm or greater in section thickness (19, 20).
Another technical aspect to consider is the effect of radiation exposure on automated lung nodule detection with using ultra-low-dose CT (21, 22). In a study by Lee et al. (21), 25 volunteers underwent CT scans using four different tube currents of 32, 16, 8, and 4 mAs. Although the sensitivities for detecting nodule decreased with reducing the tube currents, there were no significant differences in nodule detectability between the scans at 16 mAs or 8 mAs versus those at 32 mAs. Hein et al. (22) also compared the performance of two CAD systems at different CT levels of 75 mAs and 5 mAs. For both CAD systems there were no significant differences between the detection rates for the standard and ultra-low-dose data sets.
Mode of Computer-Aided Diagnosis Reading
There are several ways to use CAD: as a first reader, as a second reader and as a concurrent reader. Because the sensitivity of the current CAD systems is not quite good enough, if radiologists only reviewed the CAD marks, then many nodules can be missed. So, this option of using CAD as a first reader cannot be considered for clinical practice at this time. As a concurrent reader (reading the CT scans with CAD marks displayed), it may be able to help save time, but some nodules can still be missed. As discussed above, many studies have shown increased observer performance by using a CAD system as a second reader. In a study by Beyer et al. (23), the sensitivity of reading with CAD as a second reader was significantly higher than that with reading without CAD or with CAD as a concurrent reader, although the reading time was significantly shorter for the concurrent reading (274 seconds) as compared to that with reading without CAD (294 seconds) and that with CAD as a second reader (337 seconds). Given the overall moderate sensitivities of the CAD systems that are currently available, it is clear that CAD should be considered only as a second reader.
Detection of Ground-Glass Nodules
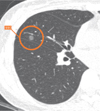
The likelihood of malignancy for ground-glass nodules (GGN) is much higher than that for solid nodules. In a study by Henschke et al. (24), 63% of the partly solid nodules and 18% of the nonsolid nodules were malignant as oppose to only 7% of the solid nodules. Despite this clinical significance, detecting GGNs is not an easy task due to their low contrast compared to the background. In addition, in the early developing stages of CAD, most CAD schemes were solely focused on detecting solid nodules. The first CAD scheme for the automated detection of GGNs was reported by Kim et al. (25), and those researchers used the texture features and Gaussian curve fitting features. More recently, Yanagawa et al. (26) evaluated the performance of a commercial CAD system for the detection of GGNs, and the sensitivity of GGN for radiologists (60-80%) was significantly higher than that for the CAD system (21%). Currently, the CAD system can only play a complementary role in detecting GGNs (Fig. 4).
Nodule Volumetry
Prediction of Nodule Malignancy
Computer-aided volumetry provides more accurate and reproducible measurement of nodules than does human observation for predicting the likelihood of malignancy and for monitoring the response of the tumor to treatment. Although the number of cases was small, it has been suggested that nodule malignancy could be identified based on the changes of the nodule volume. In a study by Yankelevitz et al. (27), all five malignant nodules out of 13 nodules that were evaluated showed doubling times less than 177 days, and in a study by Revel et al. (28), nine malignant nodules among the 22 evaluated nodules showed a doubling time ranging from 37 to 216 days. In a separate study that evaluated 63 nodules, when the upper value of 500 days for the doubling time of malignancy was applied, the sensitivity and specificity of the volumetric software for diagnosing malignancy were 91% and 90%, respectively (29). This study stressed that automated nodule volumetry provided a high negative predictive value of 98% for the diagnosis of malignant lung nodules.
Sources of Measurement Variability
After much early enthusiasm, many studies have revealed that there are many sources of variability in volumetric measurements, including the size and characteristics of nodules, the scan and reconstruction parameters of the CT examinations and the patient-related factors.
The estimate of nodule volume was then based on the total number of voxels within the segmented region. It can be predicted that the percentage of partial volume voxels decreases as the nodule size increases and as the section thickness decreases. For relatively small nodules that have no contact with the surrounding structures, section thickness is one of the most important factors because by decreasing the section thickness the partial volume effect of the surface voxels of a nodule is decreased. Therefore, obtaining CT scans with thin volumetric data is very important for nodule volumetry. Many studies have demonstrated that section thickness has a significant effect on nodule volumetry (30-35). In a phantom study by Goo et al. (30), statistically significant effects could be demonstrated for the segmentation threshold, the section thickness and the interaction of the threshold and section thickness. The effect of the field of view was not reported to be significant on volumetric measurements in several studies (30, 35, 36).
Nodule size is an important factor in determining measurement error as smaller nodules have a larger proportion of surface voxels, which result in an increased number of voxels that are affected by the partial volume effect. In a phantom study, the absolute percentage of error of nodule volumetry progressively increased with the decreasing nodule size (30). A similar effect of increased variability in volumetric measurement for decreasing nodule size was also reported in clinical studies (33).
As the size of the nodule increases, the nodules eventually grow to come into contact with the surrounding vessels and pleura. The resulting nodule attachment makes it difficult to accurately define a nodule's boundaries and therefore to segment a nodule from the background. Segmentation of a nodule from the adjacent structures can be challenging and it may lead to differences in a nodule's volume. In a phantom study by Das et al. (32), the absolute percentage of volume error for pleural nodules was very high compared to that for other types of nodules. Even for expert radiologists, there was considerable variability on how to draw the boundary of a nodule, with the interobserver variability accounting for 40% of the total volume variability (37). In a study by de Hoop et al. (38), the segmentation accuracy was evaluated using six software packages for nodule volumetry. When a threshold of 20% in volume for the maximum mismatch between the overlay provided by a software package and the visual assessment was applied, the software packages provided adequate segmentation for 71% to 86% of the nodules.
With regard to radiation exposure, two studies that compared the measurement error between low-dose and standard-dose techniques showed different results (32, 39). While the bias error was significantly smaller for a 120 mAs scan than that for a 20 mAs scan in a study by Ko et al. (39), a study by Das et al. (32) showed no significant effect on the volumetric measurement error between the low-dose (20 mAs) and standard-dose (100 mAs) protocols.
Volumetric measurements of lung nodules can be significantly affected by changes in the lung volume (40, 41). A study by Goo et al. (40) showed that the mean percent difference in lung nodule volume was 23% between the CT scans obtained at inspiration and expiration. In another study, a 17% mean change in lung nodule volume was observed between the CT scans obtained at the total lung capacity and at the residual volume (41). Although the differences in the lung volumes on the inspiration and expiration scans used in those studies are larger than those typically expected on routine follow-up clinical CT scans, respiration-related variability in measurements should also be a consideration in determining the true growth of a lung nodule.
When six software packages for nodule volumetry were compared using the same dataset, there were significant systemic differences of the mean volumes in 11 of the 15 possible pairs of software packages (38). Therefore, the absolute nodule volumes provided by different software should not be compared.
Range of Measurement Variability
Because obtaining ground truth on nodule volume in vivo is a difficult task, research has been focused on evaluating the precision or reproducibility of such measurements, or whether a true change of the nodule volume can be determined.
In an early phantom study, the measurement variability for a synthetic nodule volume was reported to be as small as 3% (27). Yet in that study, the target nodules were solid, homogeneous, synthetic nodules without vascular attachment and they had a mean attenuation of 175 HU (Hounsfield unit). Measuring this variability is hard to do in an in vivo study. In a study that evaluated stable nodules during a 2-year observation period, the standard measurement error in nodules 2-5 mm, 5-8 mm and 8-10 mm in size was 19%, 11% and 7%, respectively (42). Based on these results, Kostis et al. (42) suggested that the critical time to perform follow-up for nodules with initial sizes of 2, 5, 8 and 10 mm as detected at baseline screening should be 12, 5, 3 and 1 month, respectively.
Furthermore, as the measured difference includes both the true nodule change and variability due to measurement errors, the most essential question may be how we can identify the threshold for classifying the changes in volume as being medically meaningful. To address the issue of measurement variability, several studies that employed a same-day repeat CT protocol in patients with lung nodules (38, 43-46) have been conducted (Table 2). In one study, Wormanns et al. (43) reported that the 95% limits of agreement were -20% to 22%, and the subsequent studies showed that the 95% confidence intervals for the difference in measured volumes were up to 26%. These results indicate that an increase in measured volume by 25% has a 95% likelihood of reflecting true nodule growth rather than measurement variability.
Volumetry in Assessing the Response to Treatment
Assessing the response to treatment has remained predominantly qualitative with performing manual measurements on a single two-dimensional image. However, it has been suggested that changes in tumor volume could be detected more sensitively than the changes in the conventional unidimensional measurements after targeted therapy for lung cancer (47). With regard to the accurate assessment of tumor response to therapy in clinical trials, inaccuracy in the manual measurements of tumor dimensions has been shown to significantly influence the assessment of tumor response (48). Thus, a comparison between automated volumetry and manual measurements was performed by Marten et al. (49) and in their study, while there were no discrepancies of the assessments of patients' response between the observers and the readings using volumetry, 24% of the patients received discordant response classifications when manual measurements were used.
The use of quantitative volumetric CT may be able to reduce the number of total subjects enrolled in a clinical trial and the length of time an individual needs to be followed to reliably establish the treatment response by increasing the analytic power per subject enrolled in clinical trials (50).
Volume Measurement of Ground-Glass Nodules
Most of the reported volumetric methods have been focused on solid lung nodules and not on GGNs due to the low contrast of GGNs compared to that of the lung parenchyma. As such, the absolute volumetric error values for GGNs are known to be higher than that for solid nodules (39). Only a few studies regarding the volumetry of GGNs have been reported thus far due to the difficulty of measuring the volume of GGNs. When computer-aided volumetry was applied to nodules 8 mm or larger, the 95% limits of intraobserver agreement for the measurement of the same nodules were from 15% to 17% and those for the interobserver agreement were up to 24% (51). The interscan variability of nodule volumetry for GGNs in a same-day repeat CT study was reported to be up to 19% (52).
In addition, as tumors manifesting as GGNs show lepidic growth (53), determining the growth of GGNs based on the conventional diameter or volume measurements may not be appropriate. A different approach for determining the growth of GGN has recently been proposed. In one such phantom study, Lee et al. (54) reported that the amount of soft tissue of a nodule (volume × [1 + mean attenuation value/1000]) showed a strong correlation with the reference-standard amount of soft tissue. In a clinical evaluation study, de Hoop et al. (38) also reported that GGN mass measurements showed the smallest measurement variability compared to of the diameter and volume measurements. This mass measurement method was suggested to detect the growth of GGN earlier (425 days) than that of the diameter (715 days) or volume measurements (673 days).
Application of Nodule Volumetry in Screening Trials
In the NELSON (Nederlands-Leuvens Longkanker Screenings Onderzoek) randomized lung cancer screening trial, the nodule management protocol was based on volumetric nodule assessment and the presence or absence of growth (55). Based on the studies in which the measurement variation was evaluated on the same day CT scans (43, 45, 46), growth was defined as an increase in volume of at least 25% between the two scans. In the case of partly solid nodules, only the volume of the solid region was used. In the cases of pleural-based nodules, the diameter was measured at a point perpendicular to the costal pleura. A test was considered to be positive if a solid component of a nodule was more than 500 mm3 (> 9.8 mm in diameter). If the solid component of a nodule was 50 to 500 mm3 (4.6 to 9.8 mm in diameter), then the volume doubling time was calculated with a 3-month follow-up CT scan, and if the volume-doubling time was less than 400 days, then the nodule was considered to be positive.
Morphologic Analysis of Lung Nodules
Conventionally, the likelihood of a nodule being malignant is usually suggested according to visual assessment by experienced radiologists through morphologic analysis of the nodule. In a study that evaluated 80 GGNs, the CT predictors of malignancy for GGNs included a size greater than 8 mm and a lobulated border for pure GGNs, and only a lobulated border for mixed GGNs (56). Studies that focused on observer performance have been conducted to evaluate whether computerized schemes can help radiologists distinguish benign from malignant nodules on CT (57, 58). In a study by Li et al. (57), the computerized output generated from 56 morphologic features and two clinical datasets were provided to 16 radiologists, and their performance was improved with the aid of the CAD scheme. In another study by Awai et al. (58), the computerized output was generated from the morphologic features of density, shape, the calcification volume and the cavity volume, and the use of the CAD system significantly improved the diagnostic performance of radiology residents, while it did not improve that of the board-certified radiologists for assessing the malignancy of lung nodules.
Follow-Up Registration and Nodule Matching
Comparison of serial CT scans to evaluate the growth and shrinkage of lung nodules is a routine clinical task in chest radiology. This process is typically performed by manually matching two series of images and it is quite time consuming. On the basis of the improved registration of images, automated computer assessment may provide the opportunity to rapidly identify and compare nodules over time to detect changes in size. Lee et al. (59) evaluated the performance of automated matching software for patients with metastatic lung nodules by using two serial CT scans with a 5-mm section thickness. The overall matching rate was 67%, and the matching rate was highly associated with changes in the lung configuration between two series of CT scans. The matching rate was higher (82%) for patients with a relatively unchanged lung configuration, compared to that (29%) for patients with substantial interval changes (59). In screening settings, the interval change of the lung configuration is usually less than that in oncologic settings, and the matching rates were reported to be 91% to 93% (3, 60).
Summary and Perspective
The goal of CAD is to improve the radiologic interpretation of nodules, and many studies to date have shown that CAD can indeed improve radiologists' performance for detecting lung nodules and that CAD should be used as a second reader. It also has been shown that nodule malignancy and the response of malignant lung tumors to treatment can be assessed by using nodule volumetry and that CAD has the potential to provide objective analysis of the nodule morphology and thereby enhance the workflow when assessing follow-up studies.
From a technical point of view, the application of CAD systems for nodule detection and volumetry should be performed using thin-section volumetric CT datasets. CT scans should also be obtained with the same protocol that is used for the nodule volumetry, and experts should carefully review the segmentation results (Fig. 5). As most clinicians are not familiar with quantitative results that are expressed as volumes, nodule size also needs to be reported as the effective diameter. An algorithm may be taken into consideration to predict the optimal time to wait for the follow-up scan according to the size of a nodule. Furthermore, every radiologist who clinically uses a CAD scheme should remember that CAD schemes do indeed miss lung nodules and there is considerable variability in computer-aided volumetry. Although only the CAD applications in nodule evaluation were discussed in this review article, by using the volumetric CT data and CAD schemes, a global approach when performing chest imaging is possible. Applying CAD to the assessment of the extent of emphysema and the airway dimensions as well as nodule evaluation is an example of using CAD in a lung cancer screening setting or for patient with chronic obstructive lung disease. CAD outputs can serve as important imaging biomarkers and they should be interpreted within the clinical context. Systems that support clinical decision making, such as using the clinical data and molecular biomarkers in addition to the computerized output based on imaging data, will surely be developed in the near future.
Although many studies have been performed to identify the potential application of CAD to chest CT, these efforts have not reached the stage of daily routine use in the clinical field. The performance of CAD still needs to be further improved for detecting nodules. In addition, streamlining the workflow in CAD is important and a CAD workstation needs to start processing as soon as the CT data is generated. Subsequent integration of the data into a PACS can greatly enhance the radiologists' workflow (17), and a thin-client approach in which computing is performed in a separate server may be a potential solution.
Although many obstacles remain to be overcome, CAD will eventually serve as an everyday tool for the interpretation of chest CT images. To achieve this goal, it is necessary not only to develop better CAD algorithms, but also to investigate how we can apply and optimize the effect of the computer output in clinical practice.

 XML Download