

 PDF
PDF ePub
ePub Citation
 Print
Print


The technological advances in computed tomography (CT) have increased its use as a diagnostic imaging modality (1). CT accounted for 11% of total radiological examinations in the United States in 1999, but about 67% of the medical or man-made radiation dose (2). The increased use of CT has highlighted the concerns of radiation-induced carcinogenesis in the medical community. This has lead to the development and introduction of various techniques for reducing radiation dose by CT examinations. One of the most important techniques for dose reduction is automatic exposure control (AEC) (3), which automatically adapts tube current based on regional body attenuation, while maintaining a constant image noise. Based on the mechanism of adjustment of tube current at different projection angles within each section position, and, at different section positions along patient's length in the z-axis of the scanner, or, both, the techniques are classified as angular AEC, z-axis or longitudinal AEC, or combined AEC, respectively (3, 4).
Previous studies have assessed the weight-based adjustment of AEC, optimizing and managing the dose for abdominal CT (5), although to the best of our knowledge, similar studies for weight-based adjustment of combined AEC technique for chest CT scanning have not been reported. The purpose of the current study was to assess radiation dose reduction for chest CT using weight-based adjusted the AEC technique at 120 kVp.
MATERIALS AND METHODS
Patients
This retrospective HIPAA (Health Insurance Portability and Accountability Act) compliant study was approved by the Institutional Review Board (IRB). Informed consent was waived by the hospital's human research committee.
This study included 117 patients (mean age: 56.1 years, age range: 19-92 years, gender ratio: 60 males, 57 females) who underwent chest CT examinations at our hospital. Amongst these, 60 patients (mean age 59.1 years; age range 20-92 years, 35 males; 25 females) underwent consecutive chest CT with weight-adjusted AEC at 120 kVp, while the remaining 57 weight matched patients (mean age: 52.3 years, age range: 19-88 years, sex ratio: 25 males; 32 females) selected for this study consecutively, scanned at 140 kVp and non-weight-adjusted AEC. Patients in both categories were identified consecutively from a retrospective review (with one year of experience) of our Picture Archiving and Communication Systems (PACS) diagnostic workstation (AGFA Impax ES, AGFA Technical Imaging Systems, Ridgefield Park, NJ). Patient weights were recorded from the electronic medical record system or PACS.
Scanning Technique
All 117 patients were scanned on a 64-slice multidetector row CT scanner (GE LightSpeed VCT, General Electric Healthcare, Waukesha, WI) and received 80-100 ml of intravenous contrast (iopamidol 370 mg%, Isovue-370, Bracco Diagnostics, Princeton, NJ). The scanning parameters for the non-weight-adjusted AEC technique included the use of Auto mA 3D (GE Healthcare) with a noise index of 10 and a mA range of 75-700 mA at 140 kVp. The Auto mA 3D technique used in our study is a combined modulation type of AEC as described above. This technique uses a noise index to determine the tube current needed to obtain the desired image quality at the prescribed noise index. A higher noise index implies greater overall image noise and therefore needs a lower radiation dose. A lower noise index, on the other hand, needs a higher radiation dose to achieve lower image noise or higher image quality. The tube current modulation with Auto mA 3D occurs between a user defined minimum and maximum mA.
Patients were subdivided into three weight groups based on use of the weight-adjusted AEC described for abdominal CT examinations (5) at 5 mm section thickness. Image noise is directly proportional to section thickness if all other parameters are held constant. Thicker sections have lower noise than thinner sections; therefore, thinner sections require a higher radiation dose compared to thicker slices to obtain the same image noise. Thus, after specifying a noise index and section thickness, if a user makes any change to section thickness, the scanner automatically recommends a higher noise index in order to keep the radiation dose in similar proportion. Therefore, for the 2.5 mm chest CT images used in our department, the scanner recommended an increase in the abdominal noise indexes of 10, 12.5 and 15 (5) to noise indexes of 12.5, 15.75 and 18.75, respectively, for the three weight groups (≤ 60 kg [mA range = 75-440], 61-90 kg [mA range = 75-440 mA]; and > 90 kg [mA range =75-720 mA]). All the patients in the weight-adjusted AEC group were scanned at 120 kVp.
The remaining scanning parameters were held constant at a 0.984: 1 beam pitch, 0.5 sec gantry rotation time, 40 mm table feed per rotation, 2.5 mm section thickness at a 2.5 mm inter-section gap, standard reconstruction kernel, and a 64*0.625 detector configuration.
CT Image Analysis
Two subspecialty radiologists (with 2 years and 3 years of experiences, respectively) in thoracic imaging sections conducted subjective image quality assessments for the 60 CT examinations scanned using the weight-adjusted AEC and 120 kVp. All CT examinations were assessed on a standard PACS workstation. Image noise, diagnostic acceptability, and critical reproduction of visually sharp chest structures were graded using the European Guidelines on Quality Criteria for Computerized Tomography document (EUR 16262 www.drs.dk/guidelines/ct/quality/index.htm) (6).
Subjective image noise was scored on a three point scale (1 = less than usual or too little; 2 = optimum; and 3 = too much noise, which affects image interpretation) based on the amount of mottle or graininess present in the entire chest CT examination in the mediastinal windows (400 window width, 40 window level).
Diagnostic acceptability was graded on a 4 point scale (1 = fully acceptable; 2 = probably acceptable; 3 = acceptable under limited condition; and 4 = diagnostically unacceptable). This grading was based on the visualization of abnormalities or in the absence of abnormalities, on the radiologist's perceived likelihood of identifying abnormalities based on the overall image quality.
Lastly, each radiologist also commented on the presence or absence of the critical reproduction of visually sharp chest structures (lung parenchyma, pulmonary fissures, secondary pulmonary lobular structures like interlobular arteries, large and medium sized pulmonary vessels, small pulmonary vessels, large and medium sized bronchi, small bronchi, as well as the pleuromediastinal border, the border between the pleura, and the thoracic wall).
For objective image quality assessment in all 117 patients (patients scanned with weight-adjusted AEC and patients scanned with non-weight-adjusted AEC), objective image noise (standard deviation of mean CT number) was measured at the level of the carina in the descending aorta by one of the study co-investigators. A 30-40 mm square, circular area of the aortic cross-sectional lumen was included in the region of interest for the measurement.
Radiation Dose Assessment
Standard CT dose descriptors, computed tomography dose index volume (CTDIvol), and dose length product (DLP) were recorded for all the 117 patients from the dose page of each chest CT examination. Effective doses (ED) for all chest CTs were calculated from the DLP using a constant of 0.017 as described in the EUR16262 document (6). The minimum and maximum tube current (mA) for all 117 CT examinations were also recorded from the PACS workstation.
In order to correlate patient size to CT dose descriptor, a transverse diameter of the thorax was measured at the level of the carina using calipers (measurement tool on the PACS) from the localizer radiograph. The reason for using the localizer radiograph image was that transverse CT images in many patients did not extend from skin to skin in the reconstructed scan field of view.
Statistical Analysis
Data were analyzed using a standard statistical package (SAS/STAT; SAS, Cary, NC). A student's t-test was performed to determine if there were significant differences in weight, transverse diameter, CTDIvol, DLP, and objective image noise between the two groups of CT examinations performed with and without the weight-adjusted AEC technique. A stratified analysis of the individual weight group was performed using an ANOVA to determine if there are significant differences in the CTDIvol, DLP, and objective image noise for examinations performed with or without the weight-adjusted AEC technique. In addition, linear correlation coefficients between patient weight or transverse diameter and CTDIvol were assessed using Pearson's correlation test. A p-value of less than 0.05 was the criteria set for a significant statistical difference.
Modal scores for subjective image noise, diagnostic acceptability, and visually sharp reproduction of the thoracic anatomic structures were determined using Microsoft Excel (Microsoft Office, Microsoft Corporation, Redmond, WA).
RESULTS
Patients
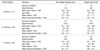
The patient distribution in the two groups; non-weight-adjusted AEC and weight-adjusted AEC is summarized in Table 1. No significant statistical difference was found for the overall weights and transverse diameters of the patients in the two groups (p = 0.4). Likewise, within each group, there was no statistical difference in the weights of patients in the three weight subcategories (p = 0.3 - 0.9). However, there was a significant statistical difference between the transverse diameters of patients in the weight-adjusted and non-weight-adjusted AEC groups for the > 90 kg weight category (p = 0.02), no significant difference was found for the ≤ 60 kg and 61-90 kg weight categories (p = 0.05-0.9).
Radiation Dose
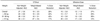
The CTDIvol and the effective doses showed a statistically significant decrease with weight-adjusted AEC technique, when compared to the non-weight-adjusted AEC technique (p < 0.0001) (Table 2). There was an overall decrease of 29% (19.2/27.0 mGy) for the CTDIvol and 27% (12.1/16.2 mSv) for the effective dose. Each weight category also showed a significant decrease in radiation dose with a maximal dose reduction in the 61-90 kg weight group, followed by the patients in the lighter weight category (≤ 60 kg) (p < 0.0001).
The maximum mA (563 ± 45 mA) used in patients weighing more than 90 kg for the weight-adjusted AEC protocol at 120 kVp was significantly lower compared to the maximum mA for the same weight category for the non-weight-adjusted AEC technique (695 ± 42 mA) (p < 0.0001). In addition, a significant statistical difference was present between the maximum mA for CT examinations performed with and without weight adjustment of AEC in the ≤ 60 kg (405 ± 46 mA, and 457 ± 74 mA respectively) and the 61-90 kg (404 ± 60 mA and 506 ± 65 mA respectively) weight categories (p < 0.0001). However, magnitude wise, these differences were much smaller than those of heavier patients weighing more than 90 kg.
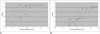
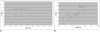
A stronger positive linear correlation of weights and transverse diameters with CTDIvol was found for the weight-adjusted AEC technique at 120 kVp (r2 = 0.83, p < 0.0001 and 0.83, p < 0.0001, respectively) than the corresponding correlation with CTDIvol for the non-weight-adjusted AEC technique at 140 kVp (r2 = 0.66, p < 0.01 and 0.61, p < 0.01, respectively) (Figs. 1, 2).
Image Quality
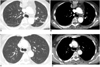
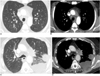
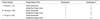
Modal scores for subjective image noise and visual reproduction of thoracic anatomical structures in patients scanned using the weight-adjusted AEC technique is summarized in Table 3. Both readers rated image noise in CT examinations in the weight-adjusted AEC group as optimum or too little (Figs. 3, 4). None of the CT examinations were found to have excessive or unacceptable levels of image noise. According to both the readers, there was a visually sharp reproduction of all anatomical structures in all CT examinations. Also, all CT examinations were considered as diagnostically acceptable by both the readers. Lastly, interobserver agreement between the two readers was substantial (κ= 0.82).
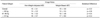
No significant difference was found for objective image noise between the two groups (non-weight-adjusted AEC and the weight-adjusted AEC [p = 0.2]). Moreover, the noise difference was not statistically significant between individual weight categories (p = 0.4 - 0.8) (Table 4).
DISCUSSION
Technological innovations to reduce radiation dose for multidetector CT examinations include improved detector efficiency, pre-patient beam collimation, pre-patient bow tie filters, projection-adaptive reconstruction filters, image post processing filters, and automatic exposure control (3, 4). These techniques either reduce radiation dose while maintaining acceptable image quality, or improve image quality of low radiation CT examinations (3, 4, 7). Prior clinical studies have also shown that diagnostic information can be obtained from CT examinations performed with a lower radiation dose (8-13).
The automatic exposure control technique without weight adjustment for chest CT examinations has been reported to reduce radiation dose by 18-26% compared to the fixed tube current technique (7). Application of the weight-adjusted AEC technique at 140 kVp to abdominal CT examination was also associated with substantial radiation dose reduction (5). However, to the best of our knowledge, there has been no published study on use of weight-based AEC for chest CT scanning.
We found that the weight-based AEC technique at 120 kVp reduces the radiation exposure associated with chest CT while maintaining the structural and diagnostic integrity of the images. The visualization of all the anatomical structures was also intact with the weight-based AEC technique at 120 kVp. Overall, the weight-based AEC technique at the lower kVp showed a 17% to 43% reduction in the CTDIvol compared with the non-weight-adjusted AEC technique at 140 kVp. A substantially stronger positive correlation was found between radiation dose and patient weight, in addition to transverse diameters with weight-adjusted AEC technique at 120 kVp compared to the non-weight-adjusted AEC technique protocol. This suggests that the weight adaptation provided by the AEC technique is more precise in modulating dose according to patient size.
Interestingly, with the weight-based AEC technique at 120 kVp, radiation dose reduction was the least in patients weighing more than 90 kg. One reason for this finding is that the regional size of patients (transverse diameter) in the weight-adjusted AEC group was significantly greater than in the non-weight-adjusted AEC group (p = 0.02). Also, there was a much greater increase (mean difference = 132 mA) in maximum mA with use of the weight-adjusted AEC technique for patients weighing more than 90 kg over non-weight-adjusted AEC technique at higher kVp. A similar argument, however, cannot be made to explain why the dose reduction with the weight-adjusted AEC technique at 120 kVp was greater for the 61-90 kg category compared to patients ≤ 60 kg. It is conceivable that this anecdotal finding may have been due to disproportionately fewer number of patients in the ≤ 60 kg weight category (n = 17) compared to those in the 61-90 kg category (n = 52). It is possible, though not proven, that with the greater number of patients in the lighter weight category in our study, a different trend in dose reduction was observed. The image noise in the weight-based AEC technique was not statistically different from the non-weight-adjusted AEC technique.
Some limitations exist for the current study. Firstly, it is a retrospective review of the CT examinations performed with weight-adjusted AEC and non-weight-adjusted AEC, in a different set of patients. However, patients in these two groups were similar in terms of gender and weight distribution. Another limitation is that we did not evaluate subjective image quality in the CT examinations performed with the non-weight-adjusted AEC technique at 140 kVp, as these examinations were performed at a higher radiation dose compared to those performed with the weight-adjusted AEC technique. Also, prior studies have already reported acceptable image qualities with the non-weight-adjusted AEC technique for chest CT technique employed in our study (7). Also, no formal evaluation of the effects of lower radiation dose CT examinations using the weight-adjusted AEC technique on lesion conspicuity or detection was performed in our study. However, the two radiologists did grade diagnostic acceptability of images based on their ability or confidence in identifying any abnormalities or the absence of abnormalities, based on their perceived likelihood in identifying potential abnormalities. We did not separately assess radiation dose reduction with the weight-adjusted AEC technique. Dose reduction reported in our study was a composite effect of lower kVp and the weight-adjusted AEC technique. Another limitation of our study is that the results of our study pertain to a combined modulation technique of one vendor and may not be applicable or relevant on similar techniques for other vendors. This was not feasible as we did not have access to all the different vendors' CT systems.
The implications of the current study proves that 120 kVp is sufficient for chest CT scanning, regardless of patient weight or transverse diameter. Although conventionally, adjustment to the AEC technique is recommended to modify radiation dose and image quality for different clinical indications. We found that the automatic exposure control technique needs to be further adapted to patient weight in order to obtain additional radiation dose reduction compared to the non-weight-adjusted AEC. Lighter patients should be scanned with lower noise index compared to the heavier patients. Use of the non-weight-adjusted AEC technique is not adequate for obtaining the full benefit of the technique. Also, further adjustment to the automatic exposure control technique is necessary to adjust for prospective acquisition of thinner sections, as was performed in our study. Although scanners automatically increase the noise index when section thickness is decreased, the radiologists, physicists and technologists using this instrument need to ensure that such a change in noise index maintains a constant radiation dose regardless of section thickness and that the noise index is not over-written or rejected unless there are over-riding concerns for obtaining higher image quality.
In conclusion, chest CT scanning using a weight-based automatic exposure control technique at 120 kVp helps in substantial radiation dose reduction compared to the non-weight-adjusted AEC technique and 140 kVp. Furthermore, the use of 120 kVp and the weight-adjusted AEC does not compromise image quality, diagnostic acceptability, and visually sharp reproduction of the thoracic anatomic structures.
 XML Download