

 PDF
PDF ePub
ePub Citation
 Print
Print


The contrast obtained in breast cancer tissue for saturation transfer ratio imaging at frequency offsets of 7 and 19 ppm from the water resonance frequency, has been shown to correlate with the malignant potential of the cells and the extent of fibrosis, respectively (1). In an in vitro nuclear magnetic resonance study, Callicott et al. (2) found that the cross-relaxation rate is a more sensitive parameter than the saturation transfer ratio for characterizing human breast tissue. The cross-relaxation rate is defined as the magnetization transfer rate constant. We further refined this technique and demonstrated that the cross-relaxation rate could be calculated using a simple equation. We named this technique 'equivalent cross-relaxation rate imaging' (ECRI). Equivalent cross-relaxation rate (ECR) imaging is an MRI technique used to quantitatively evaluate a change in the protein-water interaction. The contrast on ECRI is highly dependent on offset frequency. ECRI is a cell-weighted imaging technique that operates at offset frequencies below 10 ppm in previous studies (1, 3-5). Moreover, we demonstrated that ECRI is a useful method for cellular density imaging of axillary lymph nodes (7).
Treatment strategies and prognosis of malignant lymphoma (ML) are affected by histologic type. Both follicular lymphoma (FL) and diffuse large B-cell lymphoma (DLBCL) are common, with DLBCL requiring emergent treatment. Pathological diagnosis by biopsy is indispensable for treating ML, and although diagnostic imaging is used for staging of ML, a qualitative evaluation is not very easy with current imaging techniques. The establishment of diagnostic imaging techniques for qualitative evaluation is thus highly anticipated (8-11).
In the present study, we retrospectively compared the ECR values and the histological findings, in terms of tumor cellularity, in ML. We attempted to differentiate between FL and DLBCL using ECRI, which is a relatively new MRI technique.
MATERIALS AND METHODS
Patient Population
We obtained Institutional Review Board approval to conduct this study as well as written informed consent from all patients prior to examination. Fifteen patients (5 women and 10 men; mean age, 55.5 years; range, 36-71 years) with untreated ML that was confirmed histologically as FL (n = 8) or DLBCL (n = 7) were studied at our institution.
Equivalent Cross-Relaxation Rate Imaging Techniques
Off-resonance saturation imaging is an MRI technique that selectively alters the contrast on the basis of tissue macromolecular environments by magnetization transfer and spin lock (5, 6); the contrast obtained is highly dependent on the offset frequency (5, 12). The cross-relaxation rate (1/TIS) is defined as the magnetization transfer rate constant, i.e., [1/TIS = 1/T1* - 1/T1], where T1 and T1* are the longitudinal magnetizations of the observed water protons before and after irradiation, respectively, of the saturation transfer pulse on polymer protons. We further refined this technique, which we named ECRI, and showed that the cross-relaxation rate can be calculated using a simple equation (3, 4). We suggested that at frequency offsets below + 10 ppm, the ECR is not only dependent on the rigidity of gels, but also on the fundamental states of copolymer gels with water. Moreover, the chemical structure (i.e., the number of hydroxyl groups) and the mean ordinate values in the parallel region appear to reflect differences in rigidity (3). For instance, ECRI of breast cancer can provide better contrast than a saturation transfer image in demonstrating tumor cells and fibrosis at frequency offsets below + 10 ppm (4, 13). Moreover, ECRI can be used to quantitatively evaluate a change in the structural organization using MRI (3, 4).
MRI Techniques
Imaging was performed using a Signa 1.5T clinical scanner (GE Medical Systems, Milwaukee, WI). The position of morbid regions was confirmed based on axial and coronal T2-weighted images with fat saturation (FST2WI). We used diffusion-weighted imaging (b-factor = 1,000 s/mm2) and maximum intensity projection imaging to detect lymph node enlargement. MRI parameters were as follows: field of view, 48 cm; slice thickness, 8 mm; overlap location, 0; matrix, 128 × 128 with 512 zip (zerofill interpolation process); TR/TE, 4,200/76 ms.
To determine the ECR values and perform the ECRI, cervical and abdominal examinations were conducted using neurovascular and torso coils, respectively. Coronal images were obtained by 3-dimensional spoiled-gradient recalled acquisition in the steady state (3DSPGR) and saturation transfer prepared 3DSPGR (ST-3DSPGR). The 3DSPGR and the ST-3DSPGR pulse sequences are standard GE sequences. We adopted the off-resonance technique for preferential saturation of the immobile protons to evaluate the ECR values. The single ST pulse frequency at an 18 msec interval was employed at a frequency of 7 ppm downfield from the water resonance. The off-resonance saturation pulse had a bandwidth of 140 Hz and a flip angle of 900 degrees. The peak pulse amplitude was 3.26 µTesla for the ST sequence. This technique has demonstrated a peak specific absorption rate of 2.89 W/kg, which is within the FDA (Food and Drug Administration) recommended value of 8 W/kg. MRI parameters were as follows: field of view, 20 cm and 45 cm in the cervical and abdominal regions, respectively; slice thickness, 5 mm; overlap location, 0; locations per slab, 8; matrix, 256 × 96 with 512 zip; TR/TE, 39/6.9 ms; flip angle, 30°; magnetization transfer pulse, 3.6 µT; and offset frequency, 7 ppm. For field homogeneity, we adjusted the range of half values for the water signal to < 2 ppm during imaging. For motion artifacts, MR images were obtained on unsaturated and saturated images with breath-holding, respectively. We confirmed the correspondence between both images and the scan time was about 27 s with breath-holding. For blood flow and pulsation, we confirmed that little noise was present in the measured lymph node area.
ECR was defined as follows: ECR (%) = (M0 - Ms) / Ms × 100
Where, M0 is the signal intensity in unsaturated 3DSPGR images and Ms is the signal intensity in saturated ST-3DSPGR images. The ECR images were constructed based on the ECR of each pixel. To clarify the morbid regions, ECR images were obtained.
Evaluation Items
Two radiologists analyzed all the images. ECR of the morbid regions was measured and compared between FL and DLBCL patients. The measured lesions were all enlarged lymph nodes or tumors ≥ 10 mm in diameter; the largest section of each lesion was traced and the ECR values measured. The average ECR values were then calculated. The measured areas of the lesions ranged from 78.5 to 7,187 mm2 (median, 786.3 mm2).
The number of cells per unit area (cellular density) for the tumor cellularity of the pathological specimens Hematoxylin and Eosin stain of ML, were measured. The most common location in the measurement area was decided by a pathologist. All specimens were examined using a ×20 objective lens and a ×10 eyepiece (×200 total magnification); the measured area was 1.4 × 10⁻³ mm2. The cellular density was measured in three fields from a single pathological specimen. The number of cells was calculated using Win Roof ver. 5 (Mitani Corporation, Fukui, Japan), and included both neoplastic cells and normal lymphocytes. We also obtained the number of nuclei using this aforementioned software. For the purposes of the study, we assumed that the number of nuclei was the same as the number of cells.
Statistical Analysis
We described the median and range of the ECR values in enlarged lymph nodes and tumor masses, as well as the cellular density in histological specimens of patients with ML. Because of the small sample size in this study, nonparametric statistics were used. The Mann-Whitney U test was used to compare the ECR values and cellular density. Differences were considered significant for p values less than 0.05. A regression graph for ECR and cellular density was plotted and the correlation coefficients were calculated. The ECR value cut-off points were used to compare between FL and DLBCL.
RESULTS
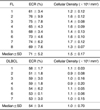
A histological examination confirmed all 15 cases as either FL or DLBCL. ECR and cellular density were measured in all cases. We used diffusion maximum intensity projection imaging to detect lymph node enlargement. Both ECR and cellular density were significantly lower in DLBCL than in FL. Strong correlations existed between ECR and cellular density in ML (Table 1).
Comparing Equivalent Cross-Relaxation Rate Values between Follicular Lymphoma and Diffuse Large B-Cell Lymphoma
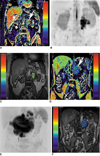
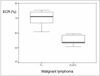
All tumor masses were detected on FST2WI, diffusion-weighted imaging and ECRI. A fusion image with FST2WI and ECRI was used to calculate the ECR value. The enlarged lymph node in FL was yellowish-green, whereas for DLBCL, it was blue. Therefore, the ECRI intensity in FL was higher than that in DLBCL (Fig. 1). Box plots of ECR data for FL and DLBCL indicate that the median ECR values were 71% (range; 60.7 to 75.5) in FL and 54% (50.8 to 59.4) in DLBCL (Fig. 2). A statistically significant difference was observed between FL and DLBCL (p = 0.001).
Correlation Equivalent Cross-Relaxation Rate Imaging with Pathological Specimen in Malignant Lymphoma
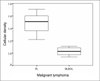
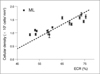
In Figure 3, Hematoxylin and Eosin stain showed the photomicrographs of FL and DLBCL. Pathologic images in FL revealed intermingled neoplastic cells and normal lymphocytes, while those in DLBCL were almost completely filled with neoplastic large cells and fibrosis (Fig. 3). Box plots of the cellular density data for FL and DLBCL indicated that the median cellular density was 1.51 ± 0.17 × 10⁶ / mm2 for FL and 1.03 ± 0.70 × 10⁶ / mm2 for DLBCL (Fig. 4). A statistically significant difference was observed between FL and DLBCL (p = 0.001). In Figure 5, a correlation between ECR and cellular density in ML was demonstrated, in which the symbol ▪ represents ML. The regression line was determined using cellular density as the outcome variable (Y) and ECR values as the predictor variable (X). The regression line equation was the following: Y= 0.028X-0.49 for ML. The regression graph indicated a linear relationship between the ECR values and cellular density; the correlation coefficient and p value were 0.88 and p = 0.001, respectively.
We set a cut-off point of 60% as observed in Figure 2. The sensitivity and specificity of the ECR value for FL and DLBCL using the cut-off point for judging the presence of DLBCL were calculated. Both the sensitivity and the specificity were 100%.
DISCUSSION
According to the Working Formulation (WF) (1982), ML was classified into low, intermediate, and high malignancy categories. This classification was effective for determining prognosis and treatment strategies, and has been widely used in Japan and the USA. In 1994, the revised European-American Classification of Lymphoid Neoplasms (REAL) classification was advocated. More recently, the WHO classification criteria have become more commonly used. Treatment strategies differ greatly between low-grade lymphoma and intermediate-high-grade lymphoma (14). In the present study, FL was selected as an low-grade lymphoma and DLBCL was selected as an intermediate-high-grade lymphoma.
In patients with ML, the biopsy remains the standard procedure for establishing an unequivocal diagnosis and determining histological type. Diagnosis of cell type has been attempted in recent years using imaging techniques: Schöder et al. (15) reported that FDG uptake was lower in indolent lymphoma when compared to aggressive lymphoma. Diffusion-weighted MR imaging (DWI) is increasingly used for the evaluation of malignant tumors. DWI explores the random motion of water molecules within extracellular space and so DWI was used to indirectly evaluate the cellularity of the tumor (16). The ECRI technique is applied to quantitatively evaluate a change in the protein-water interaction; whereas, ECR is able to directly provide information regarding cell content when the offset frequency of the MT pulse is less than 10 ppm. Matsushima et al. (7, 17, 18) used ECR to evaluate the degree of malignancy of the axial lymph node swelling in patients with breast cancer, and demonstrated that ECR values of normal lymph organization are more than 100% and that ECR provides useful results regarding the diagnosis of benign and malignant lesions. The ECR values of FL and DLBCL are less than 100%.
In pathological specimens, the size of neoplastic cells in FL or DLBCL is generally approximately 2-3 times larger than normal lymphocytes. In FL, neoplastic cells mingle with normal lymphocytes, follicular structure is held, and increases in neoplastic cells are observed. In DLBCL, progress is seen in the neoplastic cells, with breakdown of follicular structure and fibrosis of tissue. Therefore, cellular density (cell counts per unit area) is expected to be greater in normal lymph nodes than in FL and DLBCL. Moreover, cellular density is thought to be greater in FL than in DLBCL, as observed in the present study.
The regression graph showed a linear relationship between ECR and cellular density; these results confirm a strong correlation. ECR values were ranked as normal lymph organization » fibrous ingredients (17, 18). The cellular density of DLBCL was lower than that of FL, and the photomicrograph of DLBCL demonstrated an increase in fibrous ingredients. We therefore considered that the ECR values were lower in DLBCL than in FL. We demonstrated that the evaluation of ML using the ECR value cut-off points was set at 60%. The ECR values obtained by our noninvasive technique could differentiate between FL and DLBCL. The limitations of this study include the small number of patients.
In conclusion, a strong correlation between ECR and cellular density in two malignant lymphomas could be shown and the ECR might be useful technique to differentiate between FL and DLBCL.

 XML Download