Abstract
Objective
To determine the feasibility of using T2 mapping as a quantitative method to longitudinally follow the disease activity in children with Duchenne muscular dystrophy (DMD) who are treated with steroids.
Materials and Methods
Eleven boys with DMD (age range: 5-14 years) underwent evaluation with the clinical functional score (CFS), and conventional pelvic MRI and T2 mapping before and during steroid therapy. The gluteus muscle inflammation and fatty infiltration were evaluated on conventional MRI. The histograms and mean T2 relaxation times were obtained from the T2 maps. The CFS, the conventional MRI findings and the T2 values were compared before and during steroid therapy.
Results
None of the patients showed interval change of their CFSs. On conventional MRI, none of the images showed muscle inflammation. During steroid treatment, two boys showed increased fatty infiltration on conventional MRI, and both had an increase of the mean T2 relaxation time (p < 0.05). The remaining nine boys had no increase in fatty infiltration. Of these, three showed an increased mean T2 relaxation time (p < 0.05), two showed no change and four showed a decreased mean T2 relaxation time (p < 0.05).
Duchenne muscular dystrophy (DMD) is a fatal X-linked recessive muscular dystrophy that affects approximately one in 3,500 boys (1). It is characterized by progressive muscle weakness that starts in the pelvic girdle and this spreads to the distal extremities. Disease progression ultimately results in death, which often occurs during the 3rd decade (1). Steroid therapy can slow the progression of muscle weakness by decreasing the inflammation, which is thought to be an early process of the disease. However, steroid therapy is associated with long term side effects (2-4). Thus, it is essential to monitor the progress of disease in these children to determine the therapeutic effect.
A clinical functional grading system to assess muscle strength by using the clinical functional score (CFS) has been adapted from Swinyard et al. (5) as a practical method to monitor the disease activity of patients with DMD. However, the CFS has limitations for assessing an uncooperative child and for evaluating individual muscles in a given patient (6-8). Conventional magnetic resonance imaging (MRI) has shown superior sensitivity for assess the disease severity in patients with DMD, as compared to that of CFS (9). However, the conventional MRI findings of signal intensity changes that suggest muscle inflammation and fatty infiltration are subjective, rather than being objective or quantitative.
T2 relaxation time mapping (T2 mapping) has been used as an advanced technique to detect microarchitectural changes in the articular cartilage and that occur with early degeneration or inflammation (10, 11). However, there are relatively few reports in the medical literature regarding applications of T2 mapping for evaluating diseases of the soft tissues, and specifically muscles (11, 12). A previous study that used T2 mapping of the lower extremities in patients with DMD showed an increased T2 relaxation time of the fatty infiltration within muscles (12). Another study that utilized T2 mapping of the lower extremity muscles of patients with dermatomyositis showed an increased T2 relaxation time of inflammation (13). These prior studies used T2 mapping to evaluate a single time point in a disease process. To the best of our knowledge, there have been no longitudinal studies that have utilized T2 mapping of the muscles, and none that have specifically done so in children.
The purpose of our study was to determine the feasibility of using T2 mapping as a quantitative method to follow the longitudinal disease activity in children who are undergoing steroid therapy for DMD. We performed T2 mapping to identify any statistically significant quantitative changes in the muscles prior to and during the course of steroid treatment.
This prospective study was approved by the Institutional Review Board of our institution and written informed consent was obtained from all participants' parents or guardians prior to enrollment. The patients diagnosed with DMD and who presented to our institution from June 2006 to October 2008 were recruited. The inclusion criteria were 1) the diagnosis of DMD was confirmed by genetic analysis or muscle biopsy, 2) a CFS of no (value = 1) or minimal (value = 2) muscle weakness and 3) they were planned to undergo oral steroid (deflazacort) treatment. Eleven boys (mean age: 8.5 years, age range: 5 to 14 years) were included in this study.
All the enrolled children underwent clinical assessment at two time points: prior to steroid treatment and during the steroid treatment. The CFS was assessed by two pediatric neurologists by consensus and they used the Medical Research Council (MRC) scale with grading from 1 (normal) to 8 (severe dysfunction). The CFS was obtained at the same visit when the MRI assessment was obtained. Each patient started treatment with a 12-18 month course of oral steroids (deflazacort) immediately after the clinical assessment and the initial imaging assessment.
Conventional MRI and T2 mapping were done prior to and during a 12-18 month course of steroid treatment. Twenty-two MRI studies were completed with a mean interval of 14.6 months between the MRI examinations.
Conventional MRI was performed using a 1.5T imaging system (12X HD Excite, GE Medical Systems, Milwaukee, WI) with an 8 channel receive-only phased array cardiac coil (USA Instruments, Aurora, OH). Each conventional MRI study included at least one water sensitive sequence either in the coronal or axial plane: a fat-suppressed fast spin-echo (FSE) T2-weighted sequence (a TR/TE [msec] of 2,500-5,000/64-82-5, an echo train length of 6-8, a 256 × 192 matrix, a slice thickness of 6-8 mm and a 1 mm slice gap) or a FSE inversion recovery-weighed sequence (a TR/TE of 4,500/35, an inversion time of 155 msec, an echo train length of 8, a 256 × 192 matrix, a slice thickness of 3-5 mm and a 1-2 mm slice gap). The axial and coronal conventional T1-weighted images were performed without fat suppression (a TR/TE of 500-600/14-23). The field of view ranged from 20 to 28 cm and this was determined by the patient's size in order to fully include the gluteal muscles.
The axial and coronal T2 maps without fat saturation were obtained through the pelvic girdle using a T2-weighted multislice, multiecho sequence to quantify the spatial distribution of the T2 relaxation times. A nine echo train length was utilized: TE = 9, 18, …, 99 msec, TR = 1,500 msec. The acquisition time for each T2 map was approximately 3.5 minutes. The total imaging time for both the conventional MRI and the T2 mapping sequences ranged from 45 to 60 minutes. No intravenous contrast or sedation was utilized. As the T2 values can be affected by exercise or activity (14), the patients were requested to not excessively ambulate or exercise for the 12 hours prior to the MRI evaluations.
The conventional MRI examinations were interpreted by two radiologists (one with pediatric radiology fellowship training and 17 years' experience, and the other with both pediatric and musculoskeletal radiology fellowship training and 3 years' experience) by consensus. Using the conventional T1-weighted sequence, the gluteus muscle fatty infiltration was assessed. Muscle inflammation was assessed by the increased signal intensity on the fat suppressed FSE T2-weighted images, or the FSE inversion recovery sequence. The initial and follow-up MRI examinations were compared to identify interval changes of the fatty infiltration and inflammation. The examinations were evaluated without the radiologists being informed about the patients' identity.
The axial and coronal T2 maps through the pelvic girdle were generated. The T2 relaxation time pixel scale was color coded for easier interpretation and comparison over time. A region of interest (ROI) was traced by a single radiologist around the entire right gluteus maximus muscle. Using an institutional software program, the distribution of the T2 relaxation time was determined in the right gluteus maximus muscle ROI. A histogram and the mean and standard deviation of the T2 relaxation time were obtained. As a given patient can have different muscle volumes at each time point, the histogram was normalized to a muscle volume of 2,500 pixels.
Statistical analysis was performed using SAS® (statistical software version 9.1, SAS Institute, Inc., Cary, NC). For each subject, a Chi-square test was used to assess the change in the distribution of the histogram between the two T2 maps generated at each imaging assessment. P values less than 0.05 were considered to be statistically significant.
The changes in the CFS, the conventional MRI examinations and the T2 maps are summarized in Figure 1. Before steroid treatment, all the boys had no or minimal weakness, which was determined by a CFS of 1 or 2. During the course of steroid therapy, no change was detected in the CFS of any patient. For the 11 patients, there was a wide range of mean T2 relaxation times obtained from the T2 maps prior to steroid therapy. The values ranged from 56.5 msec to 125.6 msec with an average of 79.1 msec.
On the follow-up conventional MRI examinations, two boys showed a subjectively judged increase of their fatty infiltration. The other nine boys' conventional MRI examinations showed no change. None of the conventional MRI examinations showed any abnormally increased signal on a fat suppressed FSE T2-weighted or FSE inversion recovery sequence to suggest inflammation, on either the initial or follow-up MRI examination.
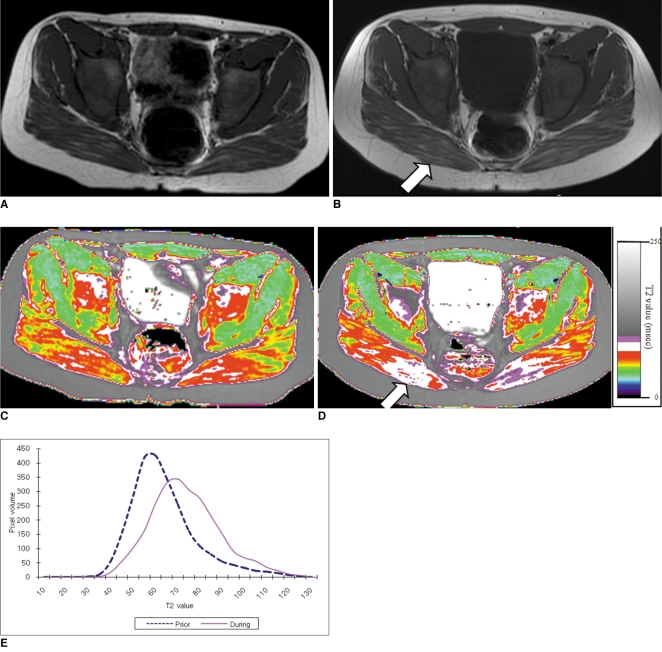
The two boys with increased fatty infiltration seen on their follow-up conventional MRI showed statistically significant different distributions of the T2 relaxation times on the histograms between the initial and follow-up studies. Both boys had a statistically significant rightward shift of their histograms (P < 0.05) with an increase in the mean T2 relaxation time (Fig. 2).
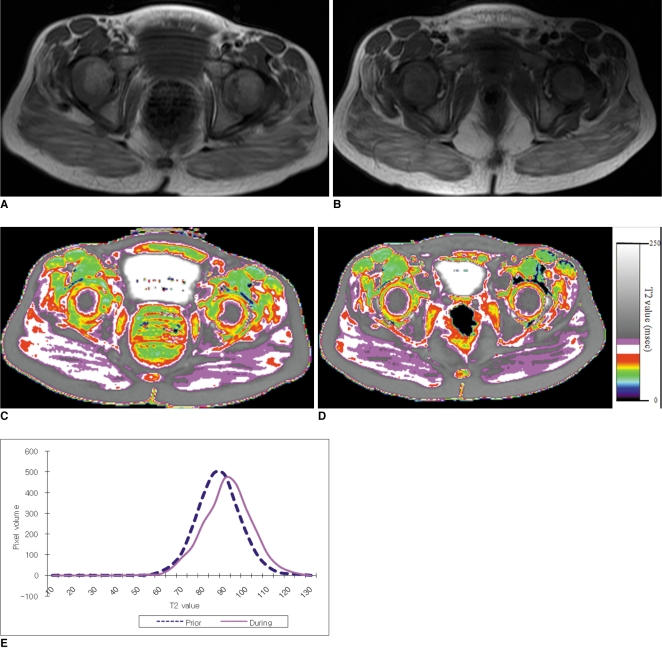
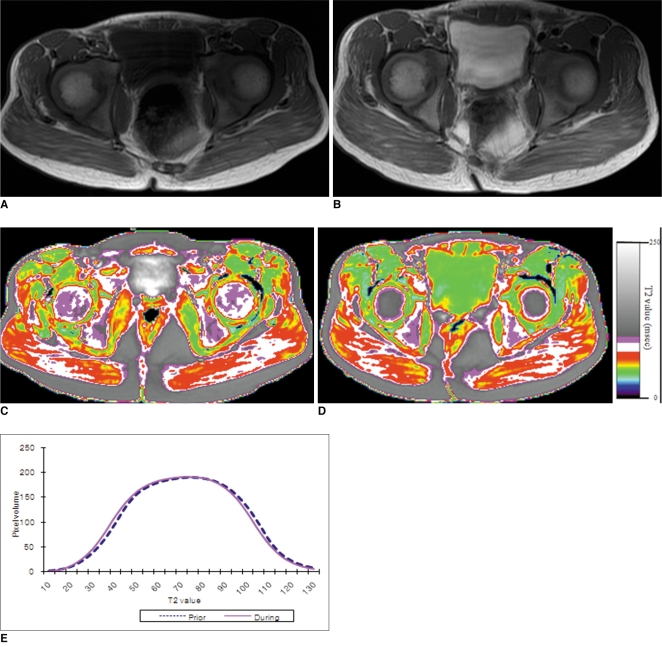
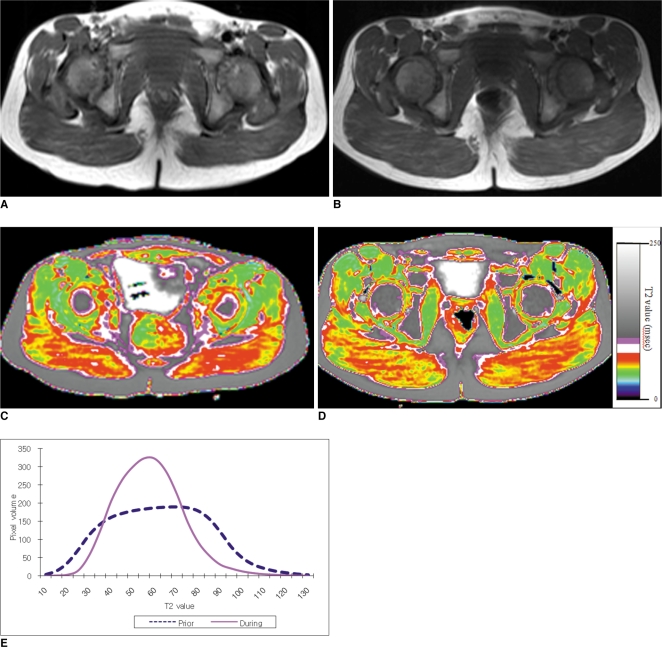
The T2 maps from the remaining nine boys who showed no change of muscle signal on conventional MRI showed different distribution patterns on the histograms. Three of the nine boys showed a statistically significant rightward shift of the histograms (P < 0.05) between the initial and the follow-up examinations (Fig. 3). Two of the nine boys showed no statistically significant different distribution of the histograms (Fig. 4). The remaining four boys showed a statistically significant leftward shift of the histograms (P < 0.05) with a decrease of the mean T2 relaxation time (Fig. 5).
Duchenne muscular dystrophy is an inherited disorder that is associated with an abnormal gene located at the Xp21 location, and this causes the absence of dystrophin. This leads to reduced stability of muscle and the muscles are rendered more susceptible to necrosis (1). Muscle necrosis subsequently leads to progressive fatty infiltration, which results in the characteristic findings of increased signal intensity on the T1-weighted images of conventional MRI (9). This fatty infiltration involves the gluteus maximus and adductor muscles with relative sparing of the sartorius, gracilis, semitendinosus and semimembranosus muscles (9). However, the increased signal intensity, which can be seen on the water sensitive sequences such as the T2-weighted images with fat suppression or FSE inversion recovery, suggests that muscle edema or inflammation might play a role in the early phases of muscle damage prior to the replacement of muscle tissue by fatty or fibrotic tissue (15). The inflammatory pathway in DMD has also been suggested in clinical studies that have evaluated the effect of steroid therapy as a method to stabilize the muscle fiber membranes and attenuate muscle necrosis, and steroid therapy offers an immunosuppressive effect with a reduction of the mononucleated cells (16-19).
T2 mapping has been less frequently used to quantitatively measure the inflammation or fatty infiltration that results from diffuse muscle disease. A previous study that used T2 mapping of the lower extremity muscles at single time point in patients with DMD showed an increased T2 relaxation time in patients with severe muscle weakness, as compared to the T2 relaxation time in those patients who were less affected. Those authors suggested that the increased T2 relaxation time resulted from the fatty infiltration within the muscle (12, 20). Another study utilizing T2 mapping of the thigh muscles in patients with juvenile dermatomyositis showed an increased T2 relaxation time in patients with active disease, as compared to those patients who were thought to be inactive or who were normal controls. That study suggested that an increased T2 relaxation time was the result of inflammation (13). The increased T2 relaxation time identified in muscles after exercise suggests that muscle activation results in an increased water content within the intracellular spaces (14).
The variable therapeutic effect of steroids in patients with DMD is well documented (21, 22). Likewise, in our study, the mean change of the T2 relaxation time in the boys on steroid treatment was variable, including an increased, a stable and a decreased mean T2 relaxation time. The increase in the mean T2 relaxation time, as was determined by T2 mapping, was seen in five patients, included two who also showed a subjective increase in fatty infiltration within the gluteal muscles on conventional MRI. This increase in the mean T2 relaxation time might be due to increased fatty infiltration despite steroid therapy. These findings support the natural progressive course of DMD despite therapy. However, notwithstanding the eventual outcome, it is possible that steroid therapy might slow the progress of DMD.
The lack of a statistically significant change of the mean T2 relaxation time in two of the boys on therapy might reflect the ability of steroids to diminish the natural progression of DMD. Prior clinical studies have shown a relatively longer steroid effect in a group of patients with DMD and who also had the N 363S polymorphism, as compared to a non-carrier group (22). Although none of the patients in our study were evaluated for this specific gene, we suggest that some boys achieved a relatively stable disease state on steroid therapy. Kissel et al. (19) showed a significant decrease in mononuclear cells in the muscle biopsies from patients with DMD and who were treated with steroids, as compared to an untreated group, and this suggested the steroids reversed the inflammatory changes. In four children in our study, a decrease in mean T2 relaxation time was seen while they were on steroid therapy. This finding might reflect a decrease in muscle inflammation, despite that there were no identifiable changes on conventional MRI or on clinical assessment.
Our study has several limitations. The study group size was small and the follow-up time was limited. No patient underwent muscle biopsy during steroid therapy to confirm the histologic changes suggested by the T2 mapping. Furthermore, T2 mapping was not performed in a longitudinal fashion for boys who had not undergone treatment. Further study with longer term follow up of a larger patient group may needed to determine the meaning of the different changes of the T2 relaxation time after steroid treatment in DMD patients. Future studies with larger size cohorts might be useful to predict the response to treatment in patients with different compounding factors, such as the patient age at disease onset, the disease severity and the degree of muscle inflammation before treatment.
We conclude that T2 mapping is a feasible quantitative technique that can be used in the longitudinal assessment of the muscle changes in children who are on steroid therapy for DMD. The T2 maps generated in children who are undergoing steroid therapy might reflect alterations in the disease activity, which includes the changes in the extent of inflammation and fatty infiltration even when the conventional MRI examinations and CFSs remain stable.
References
1. Sarnat HB. Kliegman R, editor. Neuromuscular disorder. Nelson textbook of pediatrics. 2007. Philadelphia: Saunders;p. 1680–1696.
2. Strober JB. Therapeutics in duchenne muscular dystrophy. NeuroRx. 2006; 3:225–234. PMID: 16554260.

3. Chen YW, Nagaraju K, Bakay M, McIntyre O, Rawat R, Shi R, et al. Early onset of inflammation and later involvement of TGFbeta in Duchenne muscular dystrophy. Neurology. 2005; 65:826–834. PMID: 16093456.
4. Burrow KL, Coovert DD, Klein CJ, Bulman DE, Kissel JT, Rammohan KW, et al. CIDD Study Group. Dystrophin expression and somatic reversion in prednisone-treated and untreated Duchenne dystrophy. Neurology. 1991; 41:661–666. PMID: 1781820.

5. Swinyard CA, Deaver GG, Greenspan L. Gradients of functional ability of importance in rehabilitation of patients with progressive muscular and neuromuscular diseases. Arch Phys Med Rehabil. 1957; 38:574–579. PMID: 13459572.
6. Brooke MH, Fenichel GM, Griggs RC, Mendell JR, Moxley R, Miller JP. Clinical investigation in Duchenne dystrophy: 2. Determination of the "power" of therapeutic trials based on the natural history. Muscle Nerve. 1983; 6:91–103. PMID: 6343858.

7. Sookhoo S, Mackinnon I, Bushby K, Chinnery PF, Birchall D. MRI for the demonstration of subclinical muscle involvement in muscular dystrophy. Clin Radiol. 2007; 62:160–165. PMID: 17207699.

8. Stern LM, Caudrey DJ, Perrett LV, Boldt DW. Progression of muscular dystrophy assessed by computed tomography. Dev Med Child Neurol. 1984; 26:569–573. PMID: 6510558.

9. Liu GC, Jong YJ, Chiang CH, Jaw TS. Duchenne muscular dystrophy: MR grading system with functional correlation. Radiology. 1993; 186:475–480. PMID: 8421754.

10. Kight AC, Dardzinski BJ, Laor T, Graham TB. Magnetic resonance imaging evaluation of the effects of juvenile rheumatoid arthritis on distal femoral weight-bearing cartilage. Arthritis Rheum. 2004; 50:901–905. PMID: 15022333.

11. Dunn TC, Lu Y, Jin H, Ries MD, Majumdar S. T2 relaxation time of cartilage at MR imaging: comparison with severity of knee osteoarthritis. Radiology. 2004; 232:592–598. PMID: 15215540.

12. Huang Y, Majumdar S, Genant HK, Chan WP, Sharma KR, Yu P, et al. Quantitative MR relaxometry study of muscle composition and function in Duchenne muscular dystrophy. J Magn Reson Imaging. 1994; 4:59–64. PMID: 8148557.

13. Maillard SM, Jones R, Owens C, Pilkington C, Woo P, Wedderburn LR, et al. Quantitative assessment of MRI T2 relaxation time of thigh muscles in juvenile dermatomyositis. Rheumatology (Oxford). 2004; 43:603–608. PMID: 14983103.

14. Patten C, Meyer RA, Fleckenstein JL. T2 mapping of muscle. Semin Musculoskelet Radiol. 2003; 7:297–305. PMID: 14735428.
15. Mercuri E, Pichiecchio A, Allsop J, Messina S, Pane M, Muntoni F. Muscle MRI in inherited neuromuscular disorders: past, present, and future. J Magn Reson Imaging. 2007; 25:433–440. PMID: 17260395.

16. Muntoni F, Fisher I, Morgan JE, Abraham D. Steroids in Duchenne muscular dystrophy: from clinical trials to genomic research. Neuromuscul Disord. 2002; 12:S162–S165. PMID: 12206811.

17. Weller B, Massa R, Karpati G, Carpenter S. Glucocorticoids and immunosuppressants do not change the prevalence of necrosis and regeneration in mdx skeletal muscles. Muscle Nerve. 1991; 14:771–774. PMID: 1891001.
18. Davies KE. Challenges in Duchenne muscular dystrophy. Neuromuscul Disord. 1997; 7:482–486. PMID: 9447604.
19. Kissel JT, Burrow KL, Rammohan KW, Mendell JR. CIDD Study Group. Mononuclear cell analysis of muscle biopsies in prednisone-treated and untreated Duchenne muscular dystrophy. Neurology. 1991; 41:667–672. PMID: 2027481.

20. Phoenix J, Betal D, Roberts N, Helliwell TR, Edwards RH. Objective quantification of muscle and fat in human dystrophic muscle by magnetic resonance image analysis. Muscle Nerve. 1996; 19:302–310. PMID: 8606693.

21. DeSilva S, Drachman DB, Mellits D, Kuncl RW. Prednisone treatment in Duchenne muscular dystrophy. Long-term benefit. Arch Neurol. 1987; 44:818–882. PMID: 3632394.
22. Bonifati DM, Witchel SF, Ermani M, Hoffman EP, Angelini C, Pegoraro E. The glucocorticoid receptor N363S polymorphism and steroid response in Duchenne dystrophy. J Neurol Neurosurg Psychiatry. 2006; 77:1177–1179. PMID: 16980656.

Fig. 1
Summary of changes on conventional MRI, T2 relaxation mapping and clinical functional score for study group.

Fig. 2
9-year-old boy with Duchenne muscular dystrophy. Conventional MRI and T2 maps obtained prior to and during 12-month course of steroid therapy.
A. Axial T1 weighted image (TR/TE 550/14) shows very minimal fatty infiltration within gluteus maximus muscle. Clinical functional score was assessed as 1 (normal).
B. Follow-up axial T1 weighted image (TR/TE 600/14) shows minimal increase of fatty infiltration (arrow) within gluteus maximus muscle. Clinical functional score was assessed as 1 (normal).
C, D. Color coded T2 map shows color change to higher scale color (from red to white) within gluteal muscles (arrow in D).
E. Histogram demonstrates statistically different distribution between two time points. Mean T2 value for this patient increased (from 71.2 msec on initial study to 77.3 msec on follow-up study).

Fig. 3
5-year and 2-month-old boy with Duchenne muscular dystrophy. Conventional MRI and T2 maps obtained prior to and during 18-month course of steroid therapy.
A. Axial T1 weighted image (TR/TE 517/22) shows mild fatty infiltration within gluteus maximus muscle. Clinical function score was assessed as 1 (normal).
B. Follow-up axial T1 weighted image (TR/TE 517/14) shows no interval change of fatty infiltration within gluteus maximus muscle. Clinical functional score was assessed as 1 (normal).
C, D. Color coded T2 map shows color change to higher scale color (from white to violet) within gluteal muscles.
E. Histogram demonstrates statistically different distribution between two time points. Mean T2 value for this patient increased (from 87.2 msec on initial study to 91.3 msec on follow-up study).

Fig. 4
75-month-old boy with Duchenne muscular dystrophy. Conventional MRI and T2 maps obtained prior to and during 12-month course of steroid therapy.
A. Axial T1 weighted image (TR/TE 517/14) shows very minimal fatty infiltration within gluteus maximus muscle. Clinical function score was assessed as 1 (normal).
B. Follow-up axial T1 weighted image (TR/TE 650/14) shows no interval change of fatty infiltration within gluteus maximus muscle. Clinical functional score was assessed as 1 (normal). Hyperintense T1 signal within bladder is from intravenous MRI contrast agent, which was administrated for cardiac study that was performed previously on same date.
C, D. Color coded T2 map shows no color change within gluteal muscles between initial (C), and follow-up (D) examinations.
E. Histogram demonstrates no statistically significant difference in distribution between two time points. Mean T2 value for this patient decreased slightly, but change was not statistically significant (from 72.4 msec on initial study to 71.1 msec on follow-up study, p value > 0.05).

Fig. 5
5-year-old boy with Duchenne muscular dystrophy. Conventional MRI and T2 maps obtained prior to and during 16-month course of steroid therapy.
A. Axial T1 weighted image (TR/TE 600/23) shows very minimal fatty infiltration within gluteus maximus muscle. Clinical function score was assessed as 1 (normal).
B. Follow-up axial T1 weighted image (TR/TE 517/14) shows no significant interval change of fatty infiltration within gluteus maximus muscle. Clinical functional score was assessed as 1 (normal).
C, D. Color coded T2 map shows color change from higher scale color (red) (C) to lower scale color (yellow) within gluteal muscles (D).
E. Histogram demonstrates statistically significant different distribution between two time points. Mean T2 value for this patient decreased (from 62.1 msec on initial study to 57.4 msec on follow-up study).


 PDF
PDF ePub
ePub Citation
 Print
Print


 XML Download