

 PDF
PDF ePub
ePub Citation
 Print
Print


The size of the left atrium (LA) is considered to be an important prognostic factor of cardiovascular morbidity and mortality in patients with cardiovascular disease (1-4). The prognosis for atrial fibrillation is associated with the LA volume. Therefore, evaluation of the LA volume is very important during the follow-up period in order to assess the results of catheter ablation treatment in patients with atrial fibrillation (5, 6). Echocardiography has been the most commonly used diagnostic modality for assessing LA volume in daily clinical situations. However, volume measurement using echocardiography may be difficult to obtain as well as inaccurate due to the complex shape of the LA (7). Furthermore, echocardiography underestimates the LA volume compared to angiography (8), magnetic resonance imaging (MRI) (9), or multidetector computed tomography (MDCT) (10, 11).
Cardiac MDCT has been introduced as a promising modality for coronary artery imaging (12-14). Imaging data are continuously acquired throughout the entire cardiac cycle under retrospective electrocardiographic (ECG) gating. Therefore, we can select the appropriate phases for the maximum and minimum LA volumes at the end-systole and end-diastole based on the ECG (15). However, the measurement methods for the evaluation of LA volumes and functions using cardiac MDCT have rarely been discussed. Previous studies reported that the diameter-length method using cardiac MRI, referred to as the two dimensional (2D) length-based (LB) method in this study, would be available for assessing LA volumes based on the geometrical assumptions suggested by trans-thoracic echocardiography (TTE) (16, 17). These studies, however, have not established how the 2D LB method, using cardiac MDCT or MRI, accurately measures the LA volumes when compared to results obtained from the 3D volumetric threshold-based (VTB) method which allows direct measurement without geometrical assumptions of the LA volumes. Therefore, the purpose of this study is to prospectively assess the relationship between the 2D LB method and the 3D VTB method for the evaluation of LA volumes and function using ECG-gated cardiac MDCT. We will also compare the results of the 3D VTB method using cardiac MDCT to results obtained using ECG.
MATERIALS AND METHODS
Patients Preparation
This study was approved by the respective Institutional Review Boards. Thirty-five patients who underwent cardiac MDCT as a screening examination for coronary artery disease were included in this prospective study. Twenty of the 35 patients were men, and 15 were women. Their mean age at the time of the examination was 60 years (age range; 36-81 years). An additional ECG was performed to assess the LA volumes. The mean period of time between cardiac MDCT and ECG was 6.8 days (day range; 2-13 days). This study was undertaken after informed consent was obtained from the patients for cardiac MDCT and ECG.
Multidetector CT Scanning Protocol and Image Reconstruction
Cardiac MDCT was performed using a 64-MDCT scanner (Somatom Sensation 64 VB30, Siemens Medical Solutions, Forchheim, Germany). Patients with a heart rate of more than 65 beats per minute (bpm) were given an oral β-blocker (40 mg propranolol hydrochloride; Pranol, Dae Woong, Seoul, Korea) one hour before examination to reduce their heart rate. With the patient in the supine position, cardiac MDCT was performed in the cranio-caudal direction during a single breath-hold at end-inspiratory suspension. A total of 65 mL of contrast medium (Optiray 350; Tyco Healthcare, Kanata, Canada) was administered intravenously at a rate of 4 mL/sec followed by 50 mL of normal saline at a rate of 5 mL/sec using a power injector (Stellant, Medrad, Indianola, PA). Imaging was performed using a real-time bolus tracking technique (CARE; Siemens Medical Solutions, Germany) in which the region of interest (ROI) was located at the ascending aorta. The scans were started 5 seconds after a trigger threshold of 100 HU was reached. The duration of the breath-hold ranged from 10 to 14 seconds, with an average breath-hold of 12.3 seconds. The breath-hold was achieved by all patients and ECG was recorded for each patient simultaneously. The scanning parameters were as follows: 370 msec gantry rotation time, 120 kV, 700 mAs, 0.6 mm slice collimation, 3 mm slice width, and 2.4 mm table feed per rotation. The estimated radiation dose under the ECG-gated modulation technique ranged from 8 to 12 mSv depending on the scanning range and the patient's body weight.
Imaging reconstruction was performed on the scanner's workstation using commercially available software (Syngo, Somaris/5, Siemens Medical Solutions, Germany). We used the partial scan algorithm, which provided a heart-rate-dependent temporal resolution between 93 and 185 msec from a 370 msec gantry rotation. The reconstruction parameters were as follows: a 0.75 mm slice thickness, 0.5 mm increment, 512×512 pixel image matrix, medium smooth kernel (B25f), and a 18-20 cm field of view.
In order to obtain the maximum and minimum sizes of the LA, we reconstructed the image sets at the maximum systolic constriction and diastolic relaxation phases based on retrospective ECG triggering; the maximum systolic constriction phase was determined when the reconstruction window was located halfway in the ascending T wave on ECG. Whereas, the end-diastolic relaxation phase was determined when the reconstruction window was located at the start point of the QRS complex on ECG (15). The image sets were then transferred to a separate workstation (Leonardo, Siemens Medical Solution, Germany) for analysis.
Multidetector CT Data Analysis
Two radiologists independently evaluated the LA volumes and function using commercially available software (3D Volume Measurement, Leonardo, Siemens Medical Solution, Germany). They were blinded to the results of ECG.
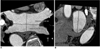
Left atrial volumes were measured using two different methods with retrospective ECG-gated cardiac MDCT. The methods were the 2D LB and 3D VTB methods. For the 2D LB method, the size of the LA was measured along the three-orthogonal planes (transverse, anterior-posterior, and longitudinal) based on the techniques suggested by Ho et al. (16) and Jayam et al. (17). The transverse diameter of the LA was defined as the distance between the midpoint of the pulmonary veins on the right and left sides of the atrium using an oblique axial image. The anterior-posterior and longitudinal (cranio-caudal) diameters were measured at the midpoint of the transverse diameter using the oblique axial and sagittal images of the LA (Fig. 1). The oblique axial images were obtained when four pulmonary veins were connected to the LA on one image plane. The volume of the LA was assessed using the following equation: LA volume = π×TD×AP/2×LD/2, where TD is the transverse diameter, AP is the anterior-posterior diameter, and LD is the longitudinal diameter.
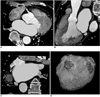
For the 3D VTB method, the endocardial contours of the LA were semi-automatically traced on the axial slices using the analysis software. We applied the lowest value of CT attenuation to cover the entire contrast-enhanced LA cavity as well as to eliminate the pericardial fatty tissue within an ROI. The lowest values of CT attenuation were determined when the LA cavity was completely included in the LA volume. The atrial appendage was excluded from the LA volume. We also excluded the pulmonary vein confluences from the volume calculations (Fig. 2).
Echocardiography
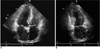
Echocardiography was performed with a commercially available ECG system (Vivid Seven, General Electric, Milwaukee, WI). A single experienced sonographer obtained the standard apical 2-chamber and 4-chamber views at the left ventricular (LV) end-systole, just prior to the opening of the mitral valve. All images were interpreted by a single cardiologist who had more than 15 years of experience in the interpretation of ECGs, and was blinded to the results of the cardiac MDCT. The maximum LA volumes were calculated using the modified biplane Simpson's method from the apical 2-chamber and 4-chamber views. At the mitral annulus, a straight line was extrapolated connecting the attachment points of the leaflets to the valve ring (Fig. 3). An automatic volume calculation was performed using the commercially available software package programmed with the modified Simpson disc summation method (18). The LA appendage and pulmonary confluences were excluded from the LA volume calculations.
Statistical Analysis
A Pearson's correlation and Bland-Altman analysis (19) were performed to determine the correlation and limits of agreement for the LA volumes and function between the 2D LB and the 3D VTB methods of cardiac MDCT. A linear regression and Bland-Altman analysis were used to determine the correlation and limits of agreement for the LA volumes between the 3D VTB method of cardiac MDCT and ECG. We used a Wilcoxon's signed rank test to evaluate the statistical significance of the differences in the LA volumes and function between the 2D LB and the 3D VTB methods of cardiac MDCT as well as between the 3D VTB method of cardiac MDCT and ECG. A p-value of less than 0.05 was considered to be statistically significant. The statistical analyses were performed using the SPSS software (version 12.0.1, Statistical Package for the Social Sciences, Chicago, IL).
The inter-observer variability (Var) for the LA volume, measured by cardiac MDCT, was assessed using the following equation: Var = (LA volume1 - LA volume2) / (LA volume1 + LA volume2) × 0.5.
RESULTS
The mean heart rate of the patients during the scan ranged from 46 to 93 bpm (mean, 63 bpm). Seven patients with a heart rate of more than 65 beats per minute were given oral β-blockers (mean, 80 bpm). Cardiac MDCT allows for a clear delineation of the endocardial contours of the LA. Although minor stair-step artifacts were visualized in some patients with a heart rate greater than 70 bpm, there were no difficulties in evaluating the LA volumes. These artifacts were more frequent during the end-systolic constriction phase.
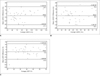
The measurement data using cardiac MDCT are summarized in Table 1. The LA end-systolic (73 ± 20 ml) and end-diastolic (46 ± 12 ml) volumes (LAESV and LAEDV) measured by cardiac MDCT using the 2D LB method correlated well with those measured by cardiac MDCT using a 3D VTB method (LAESV = 79 ± 17 ml, r = 0.763, p = 0.001; LAEDV = 47 ± 12 ml, r = 0.786, p = 0.001). The LA ejection fraction (37 ± 8%) measured by cardiac MDCT and using the 2D LB method showed a moderate correlation with the measurement by cardiac MDCT using a 3D VTB method (41 ± 7%, r = 0.489, p = 0.003). There were significant differences in the mean LAESV and LA ejection fraction (p < 0.05). However, there was no significant difference in the LAEDV between the 2D LB method and the 3D VTB method of cardiac MDCT (p > 0.05) (Fig. 4) (Table 1).
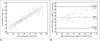
Using the modified biplane Simpson's method, the mean LAESV (79 ± 17 ml), measured by cardiac MDCT using the 3D VTB method, showed a good correlation with the volume (62 ± 15 ml) measured by ECG (r = 0.864, p = 0.001) (Fig. 5A) (Table 2). There were significant differences in the mean LAESV between cardiac MDCT using the 3D VTB method and ECG using the modified biplane Simpson's method (p < 0.01). Cardiac MDCT significantly overestimated of the LAESV of 17 ± 9 ml (22%) when compared to ECG (Fig. 5B).
The inter-observer variability for the LA volumes, measured by cardiac MDCT using the 2D LB method was 7.6% for the LAESV and 1.2% for the LAEDV. The variability for the LA volumes measured by cardiac MDCT using the 3D VTB method was 7.4% for the LAESV and 3.2% for the LAEDV.
DISCUSSION
This study showed that the LAESVs and end-LAEDVs measured by cardiac MDCT using the 2D LB method correlated well with those measured by cardiac MDCT using the 3D VTB method. In addition, the LA ejection fraction measured by cardiac MDCT using the 2D LB method showed a moderate correlation with measurements by cardiac MDCT using the 3D VTB method. The LAESV measured by cardiac MDCT using the 3D VTB method correlated well with that measured by ECG. Cardiac MDCT overestimated the LA volume by 22% compared to ECG (p < 0.01).
In clinical situations in which it is necessary to evaluate the LA size in patients with cardiac arrhythmia, ECG has been the most commonly used diagnostic tool for making these measurements (18, 20). When various methods for assessing the LA volume using ECG are used, the American Society of Echocardiography recommends using a quantification method for measuring the LA volumes by biplane ECG either using Simpson's rule or the area-length method (18). The advantages of ECG include a high temporal resolution and short acquisition time. However, a narrow echo window and geometrical assumptions limit the accuracy of ECG.
Some studies have recently reported that cardiac MDCT could be useful in evaluating cardiac function and a myocardial mass without additional radiation exposure in patients with suspected coronary artery disease (15, 21, 22). Specifically, the 3D VTB method provides the potential to easily measure the LV volume and function. This could be a simpler, less user-dependant, and time-saving method compared to the 2D area-based method after short-axis reconstruction of the LV (21, 23). A shorter gantry rotation time, lower collimation, and an increase in the number of detector rows have improved the temporal and spatial resolution of cardiac MDCT. These improvements make it more suitable for the assessment of cardiac volumes and function. Kircher et al. (10) reported that LA volume measured by cine CT showed an excellent correlation with ECG measurements. However, cine CT overestimated the LA volume by 23% compared to ECG. In our study using a 64-slice MDCT scanner, cardiac MDCT using the 3D VTB method overestimated the LAESV by 22% compared to ECG using the modified biplane Simpson's rule.
The recent study also showed that ECG following the biplane modified Simpson's rule underestimated the maximum LA volume by 35% compared to cardiac MDCT using new 3D reconstruction software (11). One reason for the differences of ESV between cardiac MDCT and ECG may appear to be the administration of β-blocker prior to the CT examination. Some previous reports have clearly demonstrated that the application of β-blocker results in a significant reduction heart rate, ejection fraction, cardiac contractility and cardiac index, whereas ESV and EDV increase (24, 25).
The measurement of LA volume is difficult due to its complex shape. Multiple methods which use various geometric assumptions about the atrial shape have been developed for assessing LA volume using ECG (11, 18, 20). Previous studies reported that the 2D LB method using MR imaging would be helpful in evaluating the LA volumes by using the size measurements of the LA along the three-orthogonal (transverse, anterior-posterior, and longitudinal) planes (16, 17). However, to the best of our knowledge, the relationship of the LA volume measurements between the 2D LB and the 3D VTB methods of cardiac MDCT have not been previously studied. The 2D LB method analyzes LA volumes under the assumption that the LA resembles the shape of an ovoid cylinder. The 3D VTB method allows direct volume measurement of the LA without geometrical assumptions because 3D images can be reconstructed by excellent volumetric acquisition of cardiac MDCT with the isotropic voxel (11).
In our study, the LA volume measurements using cardiac MDCT showed a good correlation between the 2D LB and the 3D VTB methods. The measured LA volumes were relatively consistent using the two measurement methods of cardiac MDCT. These results show that the 2D LB method for LA volume measurement provides similar results to the 3D VTB method when the LA appendage and the pulmonary vein confluences are excluded. However, there were significant differences between the two methods of cardiac MDCT in the measurement of LAESVs. The differences in these measurements may be related to the limited temporal resolution which is poorer in systole than in diastole. Ritchie et al. (26) reported that a temporal resolution of approximately 20 ms was needed in order to completely avoid motion artifacts in cardiac imaging. Thus, the limited temporal resolution used in our study may have an adverse effect on our ability to measure LA volumes at the end-systolic phase compared to the end-diastolic phase. With the introduction of dual-source CT, the increased temporal resolution of 83 ms improves the assessment of cardiac function in CT. Recent study shows the dual-source CT offers the possibility to quantify left ventricular function from coronary CT angiography datasets with sufficient diagnostic accuracy with MRI as standard of reference (27).
A stair-step artifact can affect the ventricular function evaluations in the systolic phase, but not in the diastolic phase (28). For both measurement methods, the inter-observer variability was higher in the evaluation of the LAESV than in the evaluation of the LAEDV. Our study has some limitations. First, we did not evaluate the LA volumes in sick patients or patients with arrhythmias who could increase the error range in the LA volume assessments. Therefore, further study will be needed for the results to be generalized in sick patients or patient with arrhythmias. Second, the proper values of CT attenuation were not considered in the evaluation of the LA volume using cardiac MDCT with the 3D VTB method. Inhomogeneous enhancement of the LA cavity may influence the LA volume assessment using the 3D VTB method. Third, we did not compare the results measured by cardiac MDCT with those acquired by cardiac MR imaging, which is generally accepted as the gold standard for evaluation of ventricular function. However, MR imaging still has limitations in that it provides the 2D images of the complex structures of the LA including the pulmonary veins and atrial appendage, which results in a difficulty to measure the LA volumes. Therefore, a comparison study between cardiac MDCT and cardiac MR imaging or further, a study to guide the standard measurement methods with cardiac MR imaging will be performed for the evaluation of the LA volumes. Finally, we used 64-slice MDCT with a 370 ms gantry rotation time which provided limited temporal resolution and caused the measurement errors for the LA volumes. Therefore, further studies in the evaluation of the LA volumes should be performed using a recent ultra-high channel MDCT with above 128-slice detectors as well as shorter temporal resolution in the future.
In conclusion, there is good correlation between the two different measurement methods for evaluation of the LA volumes using cardiac MDCT. In addition, cardiac MDCT correlates well with ECG in evaluating the LA volumes. However, there are significant differences in the LAESV between the two measurement methods using cardiac MDCT and between cardiac MDCT and ECG.
Cardiac MDCT may be useful in evaluating the LA volume and function using either the 2D LB method or using the 3D VTB method in patients without arrhythmias. However, there are fewer measurement errors in the end-diastolic phase than in the end-systolic phase, regardless of which specific measurement method of cardiac MDCT is used.


 XML Download