

 PDF
PDF ePub
ePub Citation
 Print
Print


Breast MRI (bMRI) is a well established method for making the diagnosis of invasive breast cancer with sensitivity that approaches 100%, yet the specificity rates have been reported to be lower (1-7). Therefore, the current research on bMRI has focused on improving this parameter (8-14).
Several approaches have been suggested; additional sequences, such as diffusion weighted imaging or MR spectroscopy, might add further information for making the differential diagnosis (10, 11, 13, 14). A computer aided diagnosis (CAD) can be used to evaluate bMRI and this might improve the diagnostic accuracy (8, 9).
Yet the drawback of these approaches is the additional scanning time and/or the extra costs for the hard- and/or software. This is why further investigations have focused on the analysis of the morphologic and dynamic descriptors to improve the specificity of bMRI (1-3, 15, 16). One of these descriptors is the adjacent vessel sign (AVS), which was previously described by our research group (1-3); the AVS is positive if one or more vessels leading to a lesion can be visualized on the T1 weighted sequences after the application of contrast media, and this indicates malignancy. To the best of our knowledge, the correlation of the AVS with the histological subgroups, the tumor size and the tumor grade has not been performed in a large study (1-3). Therefore, this blinded, prospective study of the previously acquired examinations of 1,084 histologically verified lesion was designed to 1) verify the previous reports on the diagnostic accuracy of AVS and 2) assess the correlation between the AVS, the histopathological diagnosis, the lesion size and the grade of the lesion.
MATERIALS AND METHODS
The Patients and Lesions
This study was approved by the local ethics committee. All the patients gave us their written consent for the examination. This study was based on a database that contained all the consecutive bMRI performed at our institution over the previous 12 years. Subsets of this database have been addressed in previous investigations by our team, e.g. (17). All the patients were referred by the Clinic of Gynecology of our university. According to the standards of our clinical routine practice, the indications for bMRI were: (a) unclear findings (e.g. Breast Imaging Reporting and Data System [BI-RADS] III) on X-ray mammography and/or ultrasound, and (b) preoperatively staged BI-RADS IV or BI-RADS V lesions.
Only those lesions with histopathological verification at the Department of Pathology of our university after bMRI were eligible for this study. In order to eliminate any possible post-therapeutical artifacts, all the patients with a history of surgical or minimal invasive breast biopsy and chemo or radiation therapy up to one year before undergoing bMRI were excluded. Therefore, the BI-RADS VI lesions were not eligible for this investigation. Due to this strict study protocol, 1,012 patients were included into this study.
Imaging
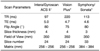
Dedicated bilateral breast coils with the patient lying in the prone position were used for image acquisition (Phillips: Intera/GyroscanACSII; Siemens: Symphony/VisionPlus). All the bMRIs were performed by scanners at 1.5 T field strength (Table 1). We used standardized protocols for the axial plane images, starting with the dynamic T1-weighted gradient echo sequences (Phillips: FFE; Siemens: GRAPPA; all 2D). Initially, one native scan was acquired, and this was followed by a bolus injection (3 ml/s) of Gd-DTPA (Magnevist, Bayer HealthCare, Leverkusen, Germany; 0.1 mmol/kgbw). Thirty seconds after bolus injection, the dynamic scanning was continued with the same sequence parameters under identical tuning conditions at 1-minute intervals for a total of 8 minutes. Commercially available software provided by the vendor was used to process the subtractions of the pre-contrast dynamic images from the postcontrast dynamic images. The technical details of the protocol are listed in Table 1.
Histopathological Workup
Only those lesions that were histologically verified at the Department of Pathology at our university were included in the study. Histopathological verification was performed by experienced breast pathologists. The benign breast lesions were divided into the following subcategories:
Malignant lesions were histopathologically classified by a board certified pathologist according to the World Health Organization (WHO) classification of breast carcinoma. The Elston-Eillis method was used for grading. It was performed to classify the histological grading as G1 ('well differentiated'), G2 ('intermediate differentiated') or G3 ('poorly differentiated') (18).
Image Analysis
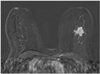
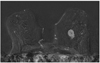
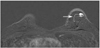
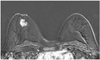
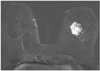
The AVS was visually assessed on the subtracted dynamic contrast-enhanced T1-weighted sequences. It was rated positive if a vessel leading to a lesion could be clearly delineated on any of the subtraction scans (Figs. 1, 2, 3, 4, 5, 6).
To assure that our readers had a high level of experience, only radiologists (n = 6) who specialized in bMRI and had performed at least 500 bMRI were eligible for image analysis. Before the evaluation was initiated, all the readers completed a one week training session together to optimize the assessment of the descriptor and to minimize the inter/intraobserver variability. Two readers evaluated the presence of the AVS by working in consensus. For the cases of unclear classification, the AVS was rated as negative.
The readers were blinded to the histopathological outcome. The maximum diameter of all the lesions was measured on the MR images using electronic scales or calipers. According to the maximum diameter of the lesions on the contrast enhanced T1-weighted sequences, we dichotomized the studied lesions into two groups of small (1-20 mm) and locally advanced (> 21 mm) lesions.
Statistical Analysis
We used Excel 2003 (Microsoft, Redmond, WA) and SPSS 15 for Windows (SPSS, Chicago, IL) for data collection and analysis. Two-sided Pearson's chi-square tests were applied to test for significant differences between the prevalence of the AVS in each subgroup. Fisher's exact test was used if one or more cells showed an expected count less than 5. P values smaller or equal to 0.05 were regarded as significant, and those p values less than 0.001 were regarded as highly significant. If the p values were < 0.1 and > 0.05, then they were interpreted as a trend.
The diagnostic accuracy of the AVS was evaluated using standard statistical parameters, including the sensitivity, specificity and positive predictive value (PPV). As the pretest probability can influence the standard predictive values, we additionally calculated the advanced statistical parameters. As these are not dependent on the pretest probability within the given subgroups, they were chosen to compare the diagnostic accuracy of the AVS between subgroups. The advanced statistical parameters included the positive/negative likelihood ratios (LR+/-) and the diagnostic odds ratios (DOR).
RESULTS
Patients and Lesions
Following the above stated criteria. 1,012 patients who showed 1,084 histologically verified lesions were included into this study (mean: 55.5 year, range: 16-91 years, standard deviation: 13.1 years). The data published by Malich et al. (3) (641 lesions) and Fischer et al. (1, 2) (132 lesions, including 32 with a recent history of chemotherapy and core biopsy) represents the subgroups of our study collective.
The Overall Prevalence and Diagnostic Accuracy
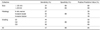
The AVS was diagnosed in 33% of all the lesions (360 of 1,084). The malignant lesions exhibited this sign highly significantly more often than did the benign ones (p < 0.001). The overall accuracy of the AVS with applying the standard and advanced statistical parameters, as well as the performance within subgroups, is summarized in Tables 2 and 3.
Malignant Subgroups
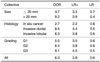
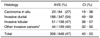
Sixty percentages of all the lesions were histologically confirmed as malignant (648 of 1,084). 64% were smaller or equal to 20 mm (416 of 648) and 36% measured more than 20 mm in diameter (232 of 648). 87% of all the malignant lesions were invasive cancers (564 of 648), 62% of this subgroup were invasive ductal cancers (347 of 564), whereas 19% consisted of invasive lobular cancers (108 of 564). As demonstrated in Table 4, the less frequent invasive tumor entities such as invasive tubular, papillary, mucinous and medullary tumors were summarized as 'other' invasive cancers (109 of 564: 19%). 13% of all the malignant lesions were in situ cancers (84 of 648). Out of these, 82% were pure ductal carcinomas in situ (DCIS: 69 of 84), 8% were pure lobular carcinomas in situ (LCIS: 7 of 84) and 10% were DCIS with LCIS components (8 of 84).
The AVS was present in 47% of all the malignant lesions (306 of 648). Table 4 summarizes the prevalence of the AVS in the malignant subgroups. There was no significant difference between the prevalence of the AVS on comparing the invasive ductal versus lobular cancers (p = 0.21). The difference between the incidence of the AVS on comparing in situ versus invasive neoplasia of the breast was highly significant (p < 0.001). Pure DCIS exhibited the AVS in 30% (21 of 69), compared to 25% of the DCIS with LCIS components (2 of 8). The AVS could not be demonstrated in any case of the pure LCIS.
Grading
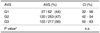
Definite grading was possible upon histological examination for 532 of all the invasive carcinomas (Table 5). 12% were G1 (62 of 532), 48% were G2 (253 of 532) and 41% were G3 lesions (217 of 532). The correlation of the AVS and the grading was not significant. Yet, there was a trend towards a higher prevalence of the AVS for the poorly differentiated breast carcinomas (G1 versus G3: p = 0.08; G2 versus G3: p = 0.06).
Benign Subgroups
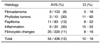
The histopathological diagnosis was benign in 40% of all the cases (436 of 1,084). 78% of all the benign lesions were ≤ 20 mm (341 of 436). 45% of the benign lesions were solid tumors (196 of 436), 24% of all the benign lesions were fibroadenomas (103 of 436), 19% were papillomas (83 of 436) and 2% were phyllodes tumors (10 of 436). Concerning the non solid benign lesions, 51% were fibrocystic changes (220 of 436) and 5% were inflammations (20 of 436).
The AVS was present in 12% of all the benign lesions (54 of 436). Table 6 summarizes the prevalence of this descriptor in the benign subgroups. The benign diagnoses that exhibited the AVS most frequently were inflammatory changes (6 of 20) and phyllodes tumors (3 of 10), and both exhibited the AVS in 30%. However, these differences were only significant regarding the inflammatory changes (p < 0.05).
Size
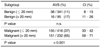
The proportion of malignant lesions was 71% within the lesions > 20 mm (232 of 327) and 55% for the lesions ≤ 20 mm (416 of 757). This difference was highly significant (p < 0.001). The prevalence of the AVS was 26% for the lesions smaller or equal to 20 mm (193 of 757), whereas this sign was present in 51% of all lesions > 20 mm (167 of 327; p < 0.001). The prevalence of AVS, as correlated with the lesion size and histology, is summarized in Tables 7 and 8.
DISCUSSION
In the current study we demonstrated that the AVS is significantly more often found in malignant lesions than in benign lesions, and the AVS exhibited a specificity of 88% and a PPV of 85%. The invasive ductal and lobular carcinomas - the most common neoplasia - presented the AVS with a similar frequency. However, this feature was observed significantly less frequently in the preinvasive cancers.
The previous publications from our group with different study designs and smaller patient cohorts were in good agreement with the current results (1-3). Malich et al. (3) reported a specificity of 72% (155 of 215) and a PPV of 82% (268 of 328) for the AVS on 641 lesions. As that previous investigation was designed to evaluate a potential interpretation model for bMRI, no detailed analysis of the subgroups was published by Malich and co-workers. Yet this was done by Fischer et al. (1) on a cohort of 132 lesions. They found specificity rates of 80% and a PPV of 87%. However, in that investigation, lesions with a history of core biopsy and radiation- or chemotherapy were included. Basically, any intervention of the breast might cause inflammation (24). As a result, hyperemia and vessel dilatation can occur, and both pose the risk of mimicking AVS (22, 24). Therefore, the prevalence of this feature in a post therapeutic setting could be increased (24). As these physiological reactions might impose bias for the evaluation of AVS, we excluded all the lesions with a history of intervention, chemotherapy or radiation up to one year before the bMRI.
This is why we designed this investigation to further evaluate the AVS. Due to the larger collective of 1,084 cases, it was possible to statistically validate the subgroups and to correlate the AVS versus the histopathological diagnosis and the grading of invasive carcinomas.
Our findings underline the important role of neoangiogenesis for the development of breast neoplasia (23). It is well known from experimental studies that expansive tumor growth needs neovascularization in order to supply itself with oxygen and nutrients (24-26). This is why the AVS could be interpreted as an indicator of neovascularization in malignant tumors (1). Preinvasive tumors may show a decreased level of neoangiogenesis (24, 27, 28). This is a possible explanation why the AVS was seen significantly less frequently in the preinvasive cancers compared to the invasive cancers, and this resulted in a lower sensitivity when comparing preinvasive cancers versus invasive cancers (7, 27, 28).
Although AVS was significantly more frequently visualized in the malignant tumors compared to the benign tumors, there were also false positive cases in the current study (54 of 1,084). These were mainly solid benign tumors (in particular papillomas and phyllodes tumors) and inflammatory changes (24). It is well known from histopathological studies that not only malignant tumors, but also benign tumors induce angiogenesis, yet this is less pronounced for the benign tumors (29). This process could serve as the histopathological basis for the false positive AVS cases in solid tumors. Similarly, inflammatory changes might cause a false positive AVS as well. Inflammatory conditions are known to cause hyperemia and vessel dilatation (24). Such physiological reactions might be a possible explanation for the high prevalence of the AVS in benign inflammatory changes. Notably, the largest subgroup of our benign subset was fibrocystic changes. According to the data published by Langer et al. (22) this subgroup contributes the majority of false positive bMRI examinations. Considering that the AVS showed a significantly lower prevalence in the fibrocystic changes, as compared to the remaining benign lesions, this sign might decrease the false positive MRI mammograms in this context.
Our analysis didn't show any significant correlation between the AVS and the tumor grade. Invasive breast cancers are known to initiate neoangiogenesis at an early stage (24, 30, 31). This might explain why the AVS was already positive in the well differentiated early stage tumors. As the AVS is feasible to assess lesions irrespective of the nuclear grading, it should be considered as a useful tool to make the differential diagnosis using bMRI.
The AVS could be visualized significantly more often in malignant tumors exceeding 2 cm in size, as compared to those malignant tumors smaller or equal to 2 cm. However, when comparing the small benign tumors (≤ 20 mm) with the benign tumors > 20 mm, only a slight, but not statistically significant increase of the AVS's prevalence was observed. The clinical value of these findings is the higher potential for making the differential diagnosis of advanced lesions compared to small lesions with a DOR of 9.2. However, the positive likelihood ratios didn't significantly differ between the small and advanced lesions (3.3 versus 3.9). This demonstrates the potential of the AVS for making the differential diagnosis for lesions ≤ 20 mm. The reason for the higher prevalence of the AVS in tumors > 20 mm is probably the higher angiogenetic activity of such lesions according to the higher demand for nutrients and oxygen. However, it should be considered as well that very small vessels might be missed on bMRI due to the partial volume effects (16) and so the sensitivity of the AVS for tumors < 20 mm is decreased. A smaller slice thickness and/or higher resolution might be one approach to solve this issue. As our rationale was to evaluate the morphologic descriptors of bMRI by using a well established standard protocol in a standard clinical setting, we did not apply the high resolution sequences.
As stated above, certain benign lesions require neoangiogenesis as well, following the same basic principles as those for malignant tumors (24, 29, 30). However, tumor growth and cellular turnover are much lower in benign tumors, resulting in a lower demand for nutrients (24, 29, 30). These findings could explain why on the one hand benign tumors sometimes presented with an AVS, but on the other hand they didn't show any significant correlation of the AVS and tumor size.
Finally, some critical aspects and limitations of this study should be addressed. The AVS was visually rated by experienced radiologists on a nominal scale. Morphologic descriptors such as the AVS are ultimately subjective parameters and they are susceptible to intra- and interobserver variability (21). To decrease bias due to intra- and interobserver variability, the study design was as follows: 1) The AVS was defined as precise and as straightforward as possible to enhance the understandability and applicability. 2) Diagnosing an AVS was done by two experienced readers working in consensus. 3) The level of experience of the readers was kept as high as possible and only radiologists who had performed at least 500 bMRI were eligible. 4) Before the evaluation was initiated, the readers completed a one week training session to optimize the assessment of the descriptor and to minimize the inter/intraobserver variability.
From previous studies it is well known that the morphologic characteristics seen on bMRI, when assessed in a standardized way using descriptors, provide vital information for making an accurate differential diagnosis (4). This is why all the major interpretation systems of bMRI have included morphologic descriptors (3, 32, 33). However, the intra- and interobserver variability could decrease the reproducibility of morphologically assessing bMRI. According to the design of this investigation as a consensus study, systematic evaluation of the intra- and interobserver variability was not possible (21). This should be the rationale of future investigations that will address the interand intraindividual reproducibility of morphologic descriptors.
Assessing the diagnostic accuracy depends on the pretest probability (21). Thus, if the routine of referral for bMRI is altered, then our results might not be reproducible. However, this must be taken into account for every clinical trial dealing with diagnostic accuracy and this problem cannot be solved completely. In our practice, bMRI usually is the last diagnostic test for working up women with breast disease (34). This explains why the pretest probability for detecting breast cancer on bMRI was much higher in our practice than it would be in a screening setting. In this study, histological verification was performed after bMRI. This is in accordance with our common practice. In other centers, the routine for referral might be different, and bMRI might be preferably performed after histological verification of the BI-RADS VI lesions. Furthermore, as reported by Liberman et al. (35) the pretest probability of malignancy correlates with the size of the lesion seen on bMRI. This explains why the proportion of malignant lesions in our collective was significantly higher within the subgroup of lesions > 20 mm as compared to those ≤ 20 mm.
To solve this issue, the pretest probability should be addressed by choosing appropriate statistics. Standard predictive values critically depend upon the pretest probability and so they should be interpreted with care. This is why we applied advanced parameters that are independent of pretest probability to assess the diagnostic accuracy of AVS (21). Thus, the bias due to different pretest probability was decreased and the parameters L+/- and DOR could be compared directly between the subgroups without a selection bias.
This study addresses the diagnostic accuracy of AVS as a single descriptor. If a new diagnostic test is evaluated, it is reasonable to assess diagnostic accuracy as a single assessment approach. If the evidence as a single diagnostic test is sufficient, then this test should be evaluated in combination with the standard methods. Thus, the incremental value of the new single diagnostic tests can be identified (21). As evidence for the AVS as a single diagnostic test is still limited, this study addressed the diagnostic accuracy of the AVS as a single descriptor. Consequently, the incremental value of the AVS cannot be estimated according to our study. This is why future studies should focus on this issue. Such investigations might address the diagnostic accuracy of bMRI using standard criteria, such as an MRI BI-RADS lexicon with and without AVS (16).
In conclusion, the AVS has high potential to differentiate benign breast lesions from malignant breast lesions on bMRI (specificity: 88%; L+: 3.8). The AVS was particularly accurate for evaluating advanced lesions (DOR 9.2). However, the likelihood of malignancy was high in small and advanced lesions (L+ 3.3 versus 3.9). The correlation revealed the potential to accurately characterize invasive breast carcinomas, even if the cancer was still well differentiated.

 XML Download