

 PDF
PDF ePub
ePub Citation
 Print
Print


Degenerative and inflammatory processes in musculature often lead to visible changes in standard T1- or T2-weighted magnetic resonance images (MRIs) (1, 2). In addition, 31P magnetic resonance spectroscopy (MRS) has been established as a remarkable tool providing insight into mitochondrial function and energy metabolism during exercise (3, 4).
Proton magnetic resonance spectroscopy (1H-MRS) is sensitive to small fractions of lipids inside myocytes (intramyocellular lipids; IMCL) and adipocytes in fatty septa between the muscle bundles (extramyocellular lipids; EMCL) (5-7). 1H-MRS allows higher spatial resolution (approximately 1 cm) than 31P MRS (8). Due to the anisotropic geometry of muscle fibres and fatty septa, 1H-MRS is capable of distinguishing between the two different lipid compartments IMCL and EMCL (5-7). However, this capability depends on the muscle fibre orientation with respect to the outer static magnetic field.
In the past decade, research studies (human and animal) has proven that regulation of muscular lipids (especially IMCL) is very complex and is dependent on internal (e.g., genetics and muscle fibre composition) (9) and external (training, nutrition) factors (10-12). Since the amount of muscular lipids is significantly increased in subjects with reduced insulin sensitivity and with a tendency towards developing type two diabetes and/or metabolic syndrome (13, 14), muscular (and hepatic) lipid measurement by 1H-MRS is under investigation in many ongoing metabolic and endocrinology-oriented studies.
Most exercise studies suggest that IMCL play a major role as an energy supply in aerobic states (15, 16), as prolonged moderate exercise can decrease IMCL within hours (15). In addition, there is evidence that well trained athletes show a higher storage of muscular lipids in resting muscle compared to normal, untrained subjects (17).
The aim of this case study was to use the highly sensitive 1H-MRS to determine pathologic changes in muscle metabolites of isolated muscle hypertrophy. This case allowed us to examine muscular lipids in isolated hypertrophy of the medial portion of the gastrocnemius muscle (GM) without any conspicuous signal changes of musculature in MRI. Both agonistic muscles, the GM, and the soleus muscle (SOL) were examined on the affected right side and on the normal left side of the patient by standard MRI and by volume localized 1H-MRS. The results were compared with a control group comprised of four healthy volunteers.
SUBJECTS AND METHODS
Patient Data
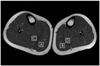
Four years prior to the 1H-MRS study a 13-year-old girl suffered from an abscess on the back of her right knee, which was then therapeutically drained. A small scar from this procedure remains. Two years later, the patient was referred to our hospital for the first time with a non-inflamed swelling of the right calf. Conventional MRI with T1- and T2-weighted sequences and magnetic resonance angiography did not indicate any tumor or hemangioma, but an enlargement of the medial portion of the right GM was clearly depicted (Fig. 1), accompanied by a slight augmentation of the lateral portion. Clinical examination did not show significant differences between the legs concerning muscular strength or the pattern of reflexes. Electrophysiological examinations of the right GM did not reveal neurological deficits of this muscle. After all, a larger circumference of 3 cm of the right calf was stated compared to the left side, interpreted as muscular hypertrophy. Partial denervation or irritation of related branches of the tibialis nerve due to the former abscess and its treatment was supposed to be the reason for the hypertrophy of the GM. A muscle biopsy was not performed due to normal morphology and a lack of muscular dysfunction.
For assessment of muscular lipids under these specific pathologic conditions, a combined MRI and 1H-MRS examination was performed after informed consent by the patient and her parents. The aim of the examination was to evaluate whether there is any substantial local effect on the lipid stores in the affected muscle and its agonist.
Healthy Volunteers
The results of the patient were compared to the data from both calves of four healthy young (age 30-35 years) volunteers without any history of metabolic or muscular diseases. All subjects gave written consent, and the studies were approved by the local Ethics Committee of the University School of Medicine.
MRI and 1H-MRS
MR examinations were performed on a 1.5 Tesla whole-body system (Magnetom Vision; Siemens, Erlangen, Germany). In both legs two muscles of the calf were examined: the SOL and the medial portion of the GM, both being functional agonists and muscles with high oxidative capacity. Standard multi-planar T1- and T2-weighted imaging allowed assessment of possible changes in muscular signal characteristics and of hyper- or hypotrophy. Positioning for localized 1H-MRS was performed on the T1-weighted images as indicated in Figure 1. Localized 1H spectra with a voxel size of 2.4 cm3 were recorded from representative regions in the muscles using the standard extremity coil for radiofrequency excitation and signal recording. The region of interest (ROI) was positioned in the central part of the muscles in order to avoid contributions from macroscopic fatty layers between the muscle groups and field distortions due to large vessels or bony structures. It is known from chemical shift imaging (CSI) examinations that the IMCL level tends to be rather homogeneous inside a specific muscle while EMCL contributions show more variations for changed ROI position (18). Volume selective shimming was performed for each new voxel position. Spectra were recorded using a stimulated echo acquisition mode (STEAM) technique with TR = 2 s / TE = 10 ms / TM = 15 ms and with frequency selective water suppression. The recorded signals underwent common post-processing procedures, which included the following: Gaussian filtering with maximum at 0 ms and half maximum after 150 ms, Fourier transformation, constant and linear phase correction. For both, SOL and GM muscles, total muscle lipids (TML) were measured as the area under the signal curve in fixed frequency borders (TML; 1.3-1.8 ppm, covering all methylene signals). In addition, the methyl creatine signal (3.05-3.25 ppm; maximum signal set to 3.15 ppm) was calculated for each spectrum. Since fibre orientation in GM leads to overlapping signals from IMCL and EMCL, separate IMCL values could only be determined for SOL (frequency borders: 1.3-1.5 ppm), where both signal portions were distinguishable in the spectrum. TML and IMCL values are given as signal ratios between the integral lipid signals and the integral of the creatine signal.
Values in the control group were compared by a Student's t-test after passing a normality test. Differences were considered to be statistically significant if p < 0.05.
RESULTS
Patient
A transverse T1-weighted image of the patient's lower legs is depicted in Figure 1 indicating an enlarged transsection area of approximately 50% of the right GM when compared to the left side. Other muscles of the lower leg do not show any remarkable difference in size or morphology when compared to the left side.
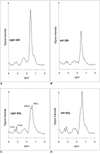
When the same calibration of the MR system (coil system, transmitter, receiver, signal calibration, post-processing) was applied, integral values of the creatine signals at 3.15 ppm of both muscles, the SOL and the GM, did not reveal any remarkable side differences (SOL: 34.0 versus 32.0 a.u.; GM: 22.4 versus. 23.9 a.u.). The 1H-spectra indicate a TML in the left GM of 24.0 and a clearly higher content of 38.7 in the right hypertrophic GM (integral lipid values referenced by integral of creatine in the same spectrum) (Fig. 2A, B). The spectra from the GM showed high quality (narrow line width), but did not allow the separation of IMCL and EMCL signals, due to the unfavourable orientation of the muscle fibres with respect to the static magnetic field. The lateral portion was not investigated due to the flat shape of the muscle and the artefacts expected in 1H-spectra when the voxel would be positioned too close to the subcutaneous fatty tissue (Fig. 1).
In contrast, 1H-spectra of SOL clearly distinguish between EMCL and IMCL signals (Fig. 2C, D). Those spectra show a difference in IMCL between the right and the left leg of the patient: IMCL content of the right SOL - the same side as the hypertrophy of GM - is clearly lower compared to the left SOL (9.2 versus 14.7).
Control Group
In the control group no remarkable intra-individual differences in the circumferences of the legs were found. Individual creatine values were similar for the left and right calf (SOL: 32.9 ± 1.6 versus 35.4 ± 1.5, p = 0.1; GM: 25.8 ± 1.8 versus 29.0 ± 1.8, p = 0.3).
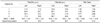
Table 1 summarizes the TML data in the control group and indicates also comparatively moderate side differences: for SOL the TML values of the normal controls revealed no significant difference between both sides (18.4 ± 3.0 versus 17.0 ± 2.8; p = 0.5).
Patient versus Control group
Total muscle lipid values of the patient's SOL muscles (19.3 and 18.2) were within the range of the control group. For the GM the patient presented a TML of 24.0 for the left side that was within the normal range, but a clearly higher value of 38.7 for the hypertrophic right GM (Table 1).
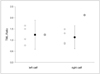
To proof the relation between the muscular lipid content of the agonistic GM and SOL, TML-ratios were calculated (TML-ratio = TMLGM/TMLSOL) for each leg. For the patient's hypertrophic right leg the TML-ratio amounted to 2.1 (versus 1.13 ± 0.16 in the control group) (Fig. 3) (Table 1). TML-ratio of the (unaffected) left leg of the patient was in the middle range of the normal controls (1.24 versus 1.24 ± 0.20) (Fig. 3) (Table 1).
DISCUSSION
Muscle pathologies are diagnostically accessible by MR techniques. As shown in multiple MRI studies, certain muscular pathologies show specific changes in MR images (19). MR imaging characteristics of denervated hypertrophic musculature can include excessive amounts of interspersed fatty septa within the muscle (19-22). For true hypertrophy, Petersilge et al. (19) only found an isointense enlargement of the muscle, but spectroscopy was not performed to investigate the EMCL and IMCL content. Narayana et al. (23) earlier described spectroscopic changes of the total lipid signal in hypertrophied muscle undergoing botulinum toxin therapy. It should be noted that spectral quality and the aspect of the two different lipid compartments was not given at that time.
The case presented in our study was diagnosed as paradoxical hypertrophy with neurogenic origin based on clinical history even though other subjective supportive clinical data were absent. Inflammatory and dystrophic muscular diseases were excluded by clinical history and functional tests as well. There were no typical patterns revealing systemic muscular disease or pathological blood test showing increased creatinine kinase levels. On clinical database and conventional MRI, this pathologic case can be considered as both true hypertrophy and pseudohypertrophy of neurologic origin (19, 23). By performing 1H-MRS signals of muscular lipids can be assessed and distinguished more clearly. True hypertrophy of skeletal muscle leads to a different composition of intracellular metabolites because the increase in muscle mass demands energy substrates such as IMCL (15, 17, 18). In our case, the hypertrophic GM on the right side showed an elevated TML content while its agonistic ipsilateral SOL did not show significant differences in total muscular lipids, but lowered IMCL when compared to the left side. Side differences in four healthy volunteers serving as controls were less pronounced compared to the patient.
However, there is an age difference between the patient and the controls. It is known from the literature on localized 1H-MRS of musculature in vivo and from our experience with several hundreds of examinations in metabolic studies that 1H-MRS spectra of skeletal musculature show only minor age dependences (mainly with slightly increased fractions of EMCL in the elderly). Furthermore, the normal leg of the patient shows signal patterns in the spectra which are very similar to the controls (Table 1). An aged-matched group could not be investigated due to ethical concerns.
The increased total lipid signal of the right hypertrophic GM cannot unambiguously be attributed to IMCL or EMCL since fibre orientation of this muscle in relation to the B0 field (parallel to the body axis) led to markedly superimposed signal contributions in the spectrum. Compared to SOL, fibres in GM are more angulated with respect to the B0 (magnetic field strength), resulting in a lower separation of the lipid fractions as demonstrated by Boesch et al. (6). On the other hand, since there are no signs of fatty degeneration or increased amount of fatty septa of this muscle in conventional imaging, the measured extremely high TML level in the hypertrophic muscle is most probably due to an increased amount of IMCL in this muscle. Since there was no neurological deficit of the right GM on electrophysiological examination, hypertrophy of GM and the increased level of lipids in this muscle can be interpreted as a result of muscle training. The reason might be the irritation of the tibialis nerve resulting in a modification of the electrical stimulation pattern of this muscle resulting in increased activity of this muscle and consecutively to higher storage of lipids within the muscle cell. The agonistic right SOL performed less physical activity leading to a decreased muscular lipid content compared to the contralateral SOL. This interpretation would be in accordance to a study of Zehnder et al. (17) who found a higher IMCL content in muscles of well-trained subjects.
To our knowledge this is the first clinical case of isolated, externally induced hypertrophy of a muscle in which 1H-MRS was performed to quantitatively assess muscular lipid content. In musculature with fibre orientation nearly along the body axis (and along the applied outer magnetic field) even separate determination of metabolically highly active IMCL and less active EMCL is possible (5, 6, 10). In conclusion, 1H-MRS could be helpful in the assessment of muscle metabolism in cases with partial denervation or nerve irritations. Follow-up studies with 1H-MRS could become a tool for monitoring the success of therapeutic interventions.
 XML Download