

 PDF
PDF ePub
ePub Citation
 Print
Print


Coronary CT angiography (CCTA) imaging is gradually becoming mainstream clinical application with the introduction of the 64-row detector CT with fast gantry rotation speed and wide coverage that can cover the whole heart in less than 10 seconds (1-5). The need to reduce X-ray dose to cardiac patients has also grown considerably (6-8). This is because cardiac helical CT scans use sub-millimeter slice thicknesses and slow helical pitches to satisfy the requirements of complete coverage for all cardiac phases for high resolution coronary artery imaging and functional measurement. Special attention has been paid to younger patients, and also to female patients due to the exposure of breasts during cardiac scans (9).
Many hardware and software techniques have been developed in CT applications to effectively reduce the X-ray dose required to obtain a desired image quality (10-13). Recently, the step-and-shot cardiac imaging mode has also been introduced to avoid overlap scans, which are inherent to the helical mode, and dramatically reduces the dose to the patients (8). The tube current for CT is normally measured in milliamperes (mA). Commercially available automatic mA modulation methods (13-15) are commonly used in body applications to obtain the desired and consistent image quality for patients of different sizes. For the CCTA application, the mA modulation, which is based on electrocardiogram (ECG) signals, is commonly used to provide full signal strength for selected cardiac phases to reduce the overall dose to patients (11, 13). However the ECG mA modulation method does not compensate for the attenuation variations of different patients. So far, there is still no commercially available automatic mA modulation method for a CCTA that combines spatial and cardiac phase information. The adjustment of mA for different patients for cardiac CT is still mostly empirical. Thus far, patient size, body weight, or body mass index (BMI)-dependent mA selection methods for cardiac CT applications have been proposed and produced relatively good results (16-18). However, these methods sometimes lack precision and accuracy due to attenuation variation in the chest of patients with similar body weights or BMI values.
The purpose of this study was to propose a quantitative method for individualized mA selection for a CCTA to improve the precision and accuracy of getting the desired cardiac image noise, and to evaluate its ability to obtain accurate and consistent image quality in clinical applications with patients of various BMI values.
MATERIALS AND METHODS
The investigation was divided into two parts: the establishment of a quantitative mA selection method and the evaluation of the robustness of such a method for obtaining consistent image quality and optimizing the radiation exposure to patients of various BMI values. All patients provided informed consent and the Institutional Review Board of our hospital approved this study. Patients with an irregular heartbeat or could not hold their breath for 10 seconds were excluded from the study.
Establishment of an Adaptive Milliamperes Selection Method
The establishment of a quantitative method involved two steps: 1) analyzing the correlation between the image noise of the timing bolus (TB) and CCTA scans, both acquired at a patient-independent mA; and 2) expressing the required (patient-dependent) CCTA mA to achieve a predetermined CCTA image noise using the correlation coefficient, as well as the TB noise measurement and other known scan parameters.
Image noise is defined as the standard deviation of the CT values over a relatively uniform area on the image. In our study, we placed a region-of-interest (ROI) at the center of the root of the ascending aorta. We measured the noise Nb and Nc from the TB and CCTA images, respectively. Since the scan geometry and tube voltage selection are fixed, the image noise for the same patient is inversely related to the square root of the image slice thickness and the tube current times for the gantry rotation speed (expressed in mA x second, or mAs) (19), and can therefore be linked to Nb and Nc in the following way
where, Nc, T(c), and mAs(c) denote the image noise, image slice thickness, and tube current multiplied by the gantry rotation speed, respectively, for the CCTA examination and Nb, T(b) and mAs(b) denote the same parameters for the TB scan. Parameter k is a constant.
Equation [1] can also be expressed as
For the analysis of the correlation between the two sets of image noise (Nc and Nb), we obtained the correlation coefficient c. Since the scan technique mAs(b) and mAs(c) and the image slice thicknesses T(b) and T(c) for the TB and CCTA scans were known through pre-selection for the correlation study, we could obtain the parameter k using the conversion of equation [3].

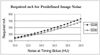
With the determination of parameter k, we converted equation. [1] to express the required CCTA scan technique mAs(rc) for obtaining the desired CCTA image noise Nc(d) using the known parameters T(b), T(c) and mAs(b) and the measured image noise Nb from the TB scans for each individual cardiac patient.
The desired CCTA image noise Nc(d) was pre-selected at 28 HU by radiologists. The preset noise level was determined based on the analysis of more than 200 existing cardiac patient scans. These cardiac patients were scanned with a standard scan protocol with a fixed mA value and evaluated using the same 5-point scale described in the image analysis section. For this group of patients, image noise varied due to the variation in patient size and the use of a fixed tube current. For certain large patients, image noise was greater than 30 HU and, the image quality score began falling below 3. Therefore, in our institute we have chosen 28 HU as the desired noise level for CCTA images. Equation 5 was then used for the individualized mA selection to obtain the desired CCTA image noise and to produce a consistent image quality across the patient population.
Patient Selection and Data Acquisition
To determine the coefficient c and parameter k, we retrospectively analyzed whether a correlation was present between the two sets of noise measurements from the TB and retrospectively-gated CCTA images of 80 patients (Group A: 42 men and 38 women; mean age, 63.3 years) who underwent cardiac examinations using a 64-row detector LightSpeed VCT (GE Healthcare, Waukesha, WI) with standard scan parameters, including a patient-independent tube current. Patient body weight, height, and heart rate were recorded. The TB scans were acquired using a 1×5 mm collimation cine scan mode at 120 kV, 80 mA and a 0.5 second rotation speed (40 mAs). For patients in Group A, the CCTA scans were acquired using a 64 × 0.625 mm collimation cardiac helical scan mode at 120 kV, 80 mA, and a 0.35 second rotation speed. The ECG mA modulation method was used with 650 mA and 130 mA for the cardiac phases at 40-80% as well as the rest of the cardiac phases, respectively. The peak tube current value of 650 mA for the ECG mA modulation was kept the same for all patients in this group. The helical pitches were automatically selected by the scanner, based on patient heart rates, and were between 0.18 and 0.26.
We then scanned a second set of 80 consecutive cardiac patients (Group B: 39 men and 41 women; mean age, 63.1 years) with an individually adjusted mA, which was calculated using equation [5] for evaluation. The target image noise level was set to 28 HU. Groups A and B were comparable with respect to patient distribution (Table 1). For Group B, the scan parameters were similar to those in Group A, except that the peak tube current value for ECG mA modulation was patient attenuation-dependent and determined using equation [5]. The CT dose index (CTDI) values for both groups were recorded and converted into an effective dose (ED) using the European DLP method (ED = DLP*conversion coefficient), with the coverage being 12 cm.
Image Analysis
Images were reconstructed using a standard reconstruction kernel, in which the image thicknesses, T(b) and T(c), for the TB and CCTA scans were 5 mm and 0.625 mm, respectively. The images were then transferred onto an Advanced Workstation (AW4.2, GE Healthcare) for analysis and display. Two experienced radiologists quantitatively evaluated the image quality blindly by evaluating the vessel sharpness, image noise, and image artifact using score scale of 1-5: 1 = very high noise, vessels cannot be clearly identified, 2 = high noise, distal vessels cannot be clearly identified, 3 = moderate noise without affecting the identification of plaques, distal vessels can be identified, 4 = low noise, sharp edges for major vessels and clear identification of plaques, and 5 = minimum noise, sharp edges for all vessels and clear identification of plaques. The final scores were obtained in consensus between the two reviewers. Image noise Nb and Nc were measured with a ROI placed at the center on the root of the ascending aorta for the TB and CCTA images. The ROI covered about 75% of the aorta. To minimize measurement variation, the average noise measurement from three consecutive slices was used for the CCTA images. The CCTA image noise (Nc) was plotted against the TB image noise (Nb), and analyzed to determine the correlation coefficient (c). The parameter k was calculated using equation [4], which was in turn used to calculate coefficient c with the other known scan parameters. We performed statistical analyses on the patient BMI values, heart rates, image quality scores, image noise measurements and the effective dose measurements from the two sets using SPSS version 10.0 (Chicago, IL). Statistical significance was set at equal to or less than 0.05 for the difference between the two groups.
RESULTS
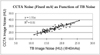
The noise correlation between the CCTA and TB scans from the cardiac patients with constant mAs scan protocols is shown in Figure 1. A good linear correlation was observed with a coefficient of c = 1.51. Using equation [4] and the other scan parameters used in our study, we obtained a value of 1.62 for the parameter k. Using equation [5], the determined parameter k, and the other known parameters T(b), T(c), and mAs(b), we determined the relationship between the required CCTA tube current and the measured TB image noise necessary to obtain the desired CCTA image noise. Figure 2 plots out such a relationship at the two different desired noise levels (standard deviations of 28 HU and 30 HU, respectively). As we relaxed the noise requirement, the overall CCTA tube current was reduced. At the present time, the additional clinical task of measuring TB noise and calculating the required mA added an additional 20 seconds to our routine clinical tasks.
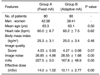
The patient distributions with respect to BMI and heart rate, image quality scores and image noise measurements, average tube currents, as well as effective dose calculations for Groups A and B, are listed in Table 1. The average heart rates, BMI values, and image quality scores for Groups A and B are 60.0, 25.3, 4.03 and 60.2, 25.0, 4.27, respectively. The statistical analysis indicated no statistical difference for these corresponding parameters between the two groups.
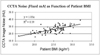
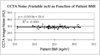
The average CCTA image noise in Group B at the patient-dependent mA selection was 28.55 HU, which was within 2% of the preset value of 28 HU. Even through the average image noise in Group B was higher than that in Group A, the image quality score analysis indicated that the slightly noisier images in Group B did not have a statistically significant impact on the image evaluation and clinical diagnosis (p = 0.07). The adaptive mA method in Group B also produced a more consistent image quality with the standard deviation of the image noise measurements less than 2 HU. This value was much smaller than the 5 HU obtained for the patients in Group A with a constant mA. Figures 3 and 4 show the scatter plots of the CCTA image noise as a function of the patient BMI for Groups A and B, respectively. As demonstrated in Figure 3 for patients in Group A, where a constant mA was used, the CCTA image noise showed a strong dependency on patient BMI values with a slope of 1.05. This would indicate an over-exposure for smaller patients and an under-exposure for large patients. On the other hand, for patients in Group B with the proposed adaptive mA selection method, the curve fitted to the image noise and patient BMI, had a slope of almost zero with a constant of 28.6, indicating image noise in this group being independent of patient BMI values.
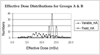
The effective dose distributions for patients in Groups A and B are shown in Figure 5. For Group A, which has a constant mA, the small variation for the effective dose came from the heart rate-dependent helical pitches ranging from 0.18 to 0.26. For the cardiac patients in Group B, which were scanned with an adaptive mA selection using equation [5], the mAs values had a much wider range; 56 mAs to 245 mAs. The average effective doses for patients in Groups A and B were 14 mSv and 10.1 mSv, respectively. We achieved about a 30% dose reduction with the use of an adaptive mA and the noise goal of 28 HU.
Figure 6 shows an example of the CCTA images with a fixed (left) and an adaptive mA (right) for patients in Groups A and B, respectively. Both images were rated excellent (score of 5). However, for patients in group B, where the tube currents were adjusted based on the TB noise measurement, a lower tube current. Effectively, a lower tube current was required to achieve an excellent image quality for smaller sized patients, which resulted in dose saving of about 50% in this particular patient compared using a fixed mA.
DISCUSSION
A multi-slice CT in clinical applications, especially in cardiac applications, has shown tremendous growth in recent years. Over a relatively short period of time, CT technology development has propelled a CCTA from a research topic to a mainstream clinical application with its convenience, non-invasiveness, and high accuracy. The explosion of the number of CT cardiac procedures and the intrinsically higher doses using helical CCTA scans has accelerated the pace for developing dose reduction strategies. The use of X-rays in imaging has pros and cons. An adequate X-ray flux is necessary to create good quality images, which are necessary for clinical diagnostic purposes. Increasing the X-ray dose will improve image quality. It will also increase the patient's exposure to X-rays, which will have potential long-term health risks. It is thus important to balance the tasks of providing clinically acceptable images and dose reduction. The as low as reasonably achievable (ALARA) concept in dealing with radioactivity is being widely accepted in the CT imaging community. Radiologists are working hard to optimize scan protocols to find the lowest possible X-ray dose to patients, while maintaining a clinically acceptable image quality. This is a systematic study and the key for such a study is to be able to accurately and consistently obtain the desired image quality across a patient population. In order to achieve a consistent diagnosable image quality, while achieving dose optimization, it is necessary to be able to adjust the tube current quantitatively and accurately for patients of different size and weight. Das et al. (20) reported a study which used 16-MDCT chest examinations with a body weight-adapted tube current selection for obtaining weight-independent image noise. Currently, for CT applications other than coronary artery imaging, many commercially available methods exist that automatically adjust the tube current in both x-y and z planes to obtain a consistent image quality for patients of different sizes (13-15). However, the automatic mA method accounting for anatomic attenuation changes is currently not available for cardiac CT imaging where tube currents are commonly adjusted based on the ECG signal. Tube current selection based on patient size, body weight, body mass index, or phantom calibration (21) for cardiac CT applications have been proposed and have yielded relatively good results. However, due to the patient sectional attenuation variations, we have seen some noise measurement variations in patients with similar body weights or BMI values. In addition to be able to produce a consistent image quality, we also wanted to be able to predict the accurate noise levels for the cardiac images. With the individual patient attenuation dependent tube current selection, our method was able to provide a consistent image at the desired image noise level.
Timing bolus scans are still an integrated part of the cardiac CTA examination in some hospitals. They are performed before the CCTA examinations to measure the time delay for the contrast to get to the heart after the contrast bolus injection. The mean CT value in the ascending aorta is usually measured and its change with time is generated to determine the appropriate start time delay for the CCTA examination. In our method, we added the TB image noise measurement, which is currently an additional clinical task. However, since the CT value measurement is automatically displayed from the TB scans, we would expect that it is fairly easy to display the noise value in addition to the CT value in the same ROI in the future. Also, in this study, we elected to measure image noise at the center of the ascending aorta when it was filled with contrast agent for the CCTA and at the peak concentration for the TB scans because for most CCTA imaging, targeted reconstructions are performed to magnify the heart, so the ascending aorta provided us a reasonable large uniform area where we could perform relevant noise measurement for the coronary arteries. In addition, for the TB scans, it is consistent with the CCTA imaging condition where coronary arteries are filled with contrast agents to depict the location and severity of stenosis and cardiac lesions. Realizing that the existence of contrast agents may sometimes cause artifacts and introduce variation to the noise measurements, we used the average of the noise measurements from three consecutive slices to represent the noise level for CCTA imaging to reduce measurement variation. This image noise preset of 28 HU, for this study, was higher than what was stated by Fei et al. (22), due to the fact that the noise level determined by Fei et al. was measured on the water background, while the noise preset used in our study was for the measurement on the ascending aorta with contrast agent.
In conclusion, we have proposed a quantitative and effective method for individualized tube current selection for a CCTA to obtain a desired noise level and consistent image quality based on the measured TB image noise for the individual patient. This method was based on noise analysis of images obtained with timing bolus scans for an individual cardiac patient, and thus was adaptive to patient attenuation variations in the chest. In addition, this method provided a practical way to obtain a consistent image at the desired image noise level for an individual patient, while making full use of the ECG mA modulation feature to reduce patient dose. The proposed method was evaluated using cardiac patients of various sizes and BMI values. The results demonstrate that the proposed quantitative method is robust and can be effective at obtaining the desired cardiac image noise and consistent image quality across a patient population and at the same time, which would in turn optimize radiation exposure to patients.
 XML Download