

 PDF
PDF ePub
ePub Citation
 Print
Print


Magnetic resonance (MR) imaging has been accepted to be a primary imaging modality for evaluating prostate cancer on the basis of its excellent soft tissue resolution. Traditionally, conventional T2-weighted imaging (T2WI) with the combined application of endorectal and phased-array coils was considered to be the most accurate MR imaging technique for detection, localization, and staging of prostate cancer. However, over the past few decades, investigators have shown that T2WI has limited value when it comes to detecting cancer in the central gland. In addition, post-treatment monitoring issues such as low signal intensity (SI) on T2WI can result from many non-cancerous conditions as well as prostate cancer (1, 2). In order to improve the diagnostic performance of MRI, investigators have applied diffusion-weighted imaging (DWI), dynamic contrast-enhanced (DCE) MRI, and MR spectroscopy (MRS) to cancer detection, staging, monitoring of treatment effect, and guidance from prostate biopsy. Recently, the majority of basic and clinical researches of prostate cancer are shifting to these functional MR imaging techniques. In addition, many studies have demonstrated the superiority of functional MR imaging over conventional anatomic imaging information (e.g., T2WI) in various clinical trials. However, investigators have also noted the challenges of the various MR techniques, which may lead to artifacts and misleading information. Therefore, accurate diagnoses require a comprehensive understanding of the advantages and limitations, histologic background related with image findings, and their clinical relevance in relation to the evaluation of prostate cancer. This article will review the basic principles, imaging protocols, and clinical significance of each functional MR technique for prostate cancer evaluation while focusing on recent issues cited in the literature.
Diffusion-Weighted Imaging
Basic Principle
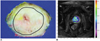
Diffusion is the process of thermally-induced, or Brownian, random motion of molecules and causes a signal decay on DWI according to the degree of magnetization dephasing by water motion between the two diffusion gradients. Therefore, the degree of diffusion can be expressed by the following equation:
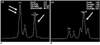
ADC = - (log SIα - log SIβ)/(bα - bβ)
where b is the diffusion weighting value (s/mm2), SIαand SIβ are the SIs at the b-value of bαand bβ, and apparent diffusion coefficient (ADC) is the apparent diffusion coefficient (mm/s2) (Fig. 1).
The SI on DWI is principally influenced by T2 relaxation (e.g., T2 shine-through effect), and diffusion. A low b-value DWI is a greater contributing factor to T2 relaxation, and therefore a high b-value is recommended for obtaining a more accurate diffusion measurement. Moreover, to eliminate the T2 shine-through effect, an ADC map should be obtained with two or more b-values.
Another issue regarding the ADC is its possible contamination by perfusion when a b-value of 0 s/mm2 is used for its calculation. According to Le Bihan et al. (3), the measured ADC in vivo is often higher than expected due to the effect of microcirculation through the capillaries within a voxel. He suggested that the ADC be calculated with two b-values greater than 0 s/mm2 in order to eliminate this perfusion effect (3, 4) (Fig. 2).
Classically, the attenuation of SI on DWI, with respect to an increasing b-value, has been known to follow a monoexponential pattern. However, more recent findings have identified a biexponential characterization of water diffusion decay curves over an extended b-factor range in the prostate (5), which has already been observed in the brain. The authors suggested a new equation as follows:
SI = (Afast exp[-ADCfast b] + Aslow exp[-ADCslow b]),
where SI is the SI at a certain b-value; SI0 is the SI at a b-value of 0 s/mm2; b is the b-value; Afast and Aslow are the apparent amplitudes of the fast and slow component; and ADCfast and ADCslow are the fast and slow ADCs, respectively.
Histological Background for Application of Diffusion-Weighted Imaging to Prostate Disease
The diffusion property in the tissue is determined by the distribution of water molecules between extracellular and intracellular spaces. Extracellular water has a greater range of diffusion than intracellular water because diffusion of water is more restricted by membranes or other cellular structures in the intracellular space (6, 7). The prostate is an organ containing an abundance of glandular tissue with extracellular spaces. In contrast, prostate cancer shows decreased diffusion since it has abundant inter- and intracellular membranes, a high cell density, substantial cellular edema, and elevating interstitial pressure due to the loss of ATP-dependent sodium-potassium pumps (1, 8). These histological characteristics result in different diffusion properties when comparing a normal gland to cancer tissue in the prostate.
Similar to prostate cancer, non-cancerous tissue of the prostate has various diffusion properties according to its various tissue composition types. A benign prostatic hyperplasia (BPH) gives rise to inhomogeneous diffusion patterns as it changes the distribution of cellular density. Whereas, BPH-related increased cellular density decreases the diffusion of the central gland, which is usually less predominant than prostate cancer but may mimic prostate cancer (9, 10). Prostatitis may also change the diffusion properties of the prostate as it causes increased interstitial pressure and the aggregation of various inflammatory cells. As these histological changes tend to restrict diffusion, prostatitis can cause high SI on DWI, as well as decreased ADC, thereby mimicking prostate cancer (11).
Even in normal prostate tissue, the ADC is significantly higher in the peripheral zone , which has abundant glandular tissue (12), compared to the transitional or central zones (10, 13) due to the fact that prostate tissue in the transitional and central zones have more compact stroma and more longitudinally arranged smooth muscle than in the peripheral zone tissue. Moreover, SI on DWI and the ADC may change with increasing age due to atrophy in the prostate, which leads to reduced cell volume and enlarged glandular ducts (14).
Apparent Diffusion Coefficients between Prostate Cancer and Non-Cancerous Tissue
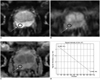
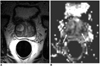
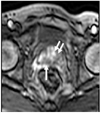
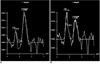
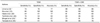
It is widely known that the ADC is lower in prostate cancer than in non-cancerous tissue. Moreover, when the ADC was compared in non-cancerous tissue based on its anatomic location, the transitional zone or central gland showed a lower ADC than the peripheral zone (10, 12, 15, 16) (Fig. 3) (Table 1). Recently, Kim et al. (10) reported that the ADC was significantly lower in the prostatic base than in the transitional and peripheral zones, and suggested that the lower ADC in the prostatic base was caused by a significantly lower ADC in the central zone.
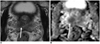
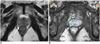
Despite the tendency of different ADC values in prostate cancer and non-cancerous tissue, studies have also shown a significant overlap of the ADC values between prostate cancer and non-cancerous tissue, which is attributed to the fact that the ADC varies widely in both prostate cancer and non-cancerous tissue (Figs. 4, 5). This overlap of the ADC limits the accuracy of DWI in cancer detection. This overlap seems to be prominent between both prostate cancer and non-cancerous transitional zone tissue because it has a lower ADC than peripheral zone tissue (10, 16-18). Therefore, a higher diagnostic accuracy based on a region-of-interest analysis in previous studies might be exaggerated, and the actual diagnostic accuracy for cancer detection may not be as satisfactory as expected in clinical practice.
Imaging Techniques
Recently, single shot echo planar imaging (EPI) has been most widely used for DWI. Since EPI is vulnerable to distortion and artifacts in areas with magnetic susceptibility, such as air-tissue interfaces or chemical-shift effect in fat-water interfaces, fat suppression is mandatory.
The types of coil used seems to vary by study; some studies used endorectal coils, while others used pelvic phased-array coils. An endorectal coil provides a superior signal-to-noise ratio (SNR) but causes reduced patient compliance and increased susceptibility effects. Whereas, the pelvic phased-array coil results in a relatively inferior SNR, which may be overcome by increasing the number of averages used in imaging; however, the compensatory strategy results in a longer image acquisition time (19).
Diffusion-weighted imaging is likely to perform better with a 3T, as opposed to a 1.5T system, since a 3T system provides greater SNR as well as a greater spatial and temporal resolution. Since an endorectal coil is available with a 3T system, the combination of a phased-array and endorectal coil can be used for prostate DWI, which according to some authors, provides an improvement in the image quality for DWI (8, 19). A higher sensitivity to susceptibility is a potential drawback of a high field system. The sensitivity can be reduced by applying parallel imaging techniques, which in turn decrease echo spacing and echo train length (19).
Clinical Significance: Advantages and Challenges
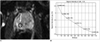
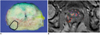
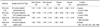
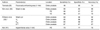
Advantages - DWI demonstrates a high SI for prostate cancer compared to normal prostate tissue. Also, a decrease in diffusion for prostate cancer shows a low signal on an ADC map (Fig. 3). Prostate cancer appears more conspicuous on DWI or an ADC map than for conventional T2WI. Since DWI requires a short scan time, it can be used as an adjunct to standard MR imaging for the identification and localization of prostate cancer and can improve the diagnostic performance of MRI for cancer detection. Recent studies have evaluated the diagnostic ability of prostate cancer detection per se (9, 13, 20-23). Many studies showed a significantly improved diagnostic accuracy when combining DWI and T2WI compared to T2WI alone (9, 13, 22-25) (Fig. 3) (Table 2). Consequently, it seems to make sense to combine DWI and T2WI, since DWI can be readily acquired as a part of standard clinical prostate MR protocol rather a replacement of the conventional T2WI.
High lesion conspicuity on DWI and ADC maps can help the introduction of an image-guided biopsy in patients with previous negative biopsy results and elevated serum prostate-specific antigen (PSA) levels (11, 26) (Fig. 6). According to Park et al. (26), prostate cancer was detected in 17 of 43 patients (40%) with a previously negative biopsy. Moreover, the location of the unidentified cancer on the previous biopsy was more common in the transitional zone (76%) than in the peripheral zone (24%). In addition to tumor detection, high lesion conspicuity on DWI can improve the diagnostic accuracy for prostate cancer staging. According to Kim et al. (27), the combination of DWI and T2WI showed a better diagnostic performance than T2WI alone for predicting seminal vesicle invasion. For example, the area-under-curve (AUC) for T3b was 0.815 for T2WI with DWI and 0.696 for T2WI alone.
Challenges - A significant overlap exists for the ADC values between prostate cancer and non-cancerous tissue as well as heterogeneous ADC values according to zonal anatomy, and also the presence of non-cancerous conditions that decrease diffusion, such as BPH and prostatitis. These represent the main challenges for the application of DWI and ADC maps in prostate cancer detection (10) (Fig. 7). Gibbs et al. (28) reported that quantitative T2 mapping and DWI of the prostate central gland showed no statistical difference when comparing the T2 value and the mean ADC between BPH and prostate cancer. They postulated that morphological changes of BPH subsequently cause changes in the tissue structure that can affect the properties of water diffusion. These structural changes can lead to inaccurate ADC measurements in the transitional zone and false positive results on DWI. Haider et al. (22) demonstrated that, even with combined DWI and T2WI, the accuracy of detection for prostate cancer was lower in the transitional zone (AUC, 0.78) than in the peripheral zone (0.89).
Another factor which likely affected the diagnostic value of DWI was the subjective interpretations of individual radiologists. One study reported substantial interobserver agreement (Kappa value, 0.73) for the diagnosis of seminal vesicle invasion by DWI and T2WI (27), while another study showed only a fair interobserver agreement (Kappa value, 0.51) for cancer detection by ADC and T2WI (24). Moreover, other studies have demonstrated that more experienced observers achieve a greater diagnostic accuracy for cancer detection or staging by DWI compared to less-experienced observers (9, 24, 27).
Dynamic Contrast-Enhanced MRI
Basic Principle and Histologic Background
The theoretical background of DCE MRI is strongly related with tumor angiogenesis. Angiogenesis is an inevitable requirement for growth beyond a 2 mm diameter, invasion to other organs, and distant metastasis in malignant neoplasms (4). As a result of angiogenesis, the number of vessels and permeability through the vascular wall increases significantly. Furthermore, since cancer tissue has larger interstitial space than normal tissue, it correspondingly shows a greater difference in the concentration of intravenous (IV) contrast material between intravascular and extravascular spaces. In turn; this marked difference in concentration accelerates the contrast transfer through the vascular wall. This characteristic environment results in a unique enhancement pattern for cancer on DCE MRI (e.g., early strong enhancement and rapid de-enhancement) (1, 29, 30) (Fig. 8).
Vascular endothelial growth factor plays a key role in tumor angiogenesis and is also the case for prostate cancer (29, 31). Jackson et al. (32) detected vascular endothelial growth factor in tumor cells and peritumoral stromal cells of prostate cancer specimens. Therefore, prostate cancer is an appropriate disease for evaluating the tumor angiogenesis on DCE MRI.
Time Intensity Curve and Tracer Kinetic Models
Several perfusion-related parameters can be extracted from a time-intensity curve and tracer kinetic models of DCE MRI data (30, 33-39); although, software for analyzing a time-intensity curve is widely available whereas, tracer kinetic models are not commercially released and only applicable on a research basis.
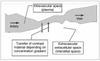
The analysis of a time-intensity curve is only applicable for simple datasets when determining the shape of the curve, whereas tracer kinetic models allow for more highly sophisticated parameters with respect to tumor perfusion, such as permeability (flux of contrast material between intravascular and interstitial spaces), area of intravascular space, and area of interstitial space. Although various trace kinetic models have been introduced, they share the same theoretical background (37): a) IV contrast material, when administered, exists in two compartments, i.e. intravascular space and extravascular (interstitial) space (Fig. 9), b) IV contrast material transfer between these two compartments is dependent on a concentration gradient, c) time variation (e.g., the parameters describing the compartment) is constant during the time that data are obtained, and d) relaxivity (1/T1) after IV contrast material injection is proportional to the concentration of IV contrast material according to the following equation:
1/T1 = 1/T10 + R1 · Ct
whereas Ct is the tissue concentration of the tracer, R1 is the relaxivity of the tracer, and T10 is the native T1 (i.e., the value of T1 before injection of tracer).
The most widely used tracer kinetic model for evaluating angiogenesis on DCE MRI is the Tofts model. This model extracts the concentration of contrast material in the plasma (Cp), which is derived from arterial input function, fractional volumes of the extravascular extracellular space (Ve) and plasma (Vp), as well as the permeability through the blood vessels (Ktrans).
Similarly, the Brix model has been also used for DCE MRI. The premise of this model assumes that a linear correlation exists between SI and the concentration of IV contrast material. Originally, SI does not follow this suggestion, but this assumption is allowed when the concentration of IV contrast material is very low. The Brix model also extracts the flux from the extravascular extracellular space (Kep), elimination rate of contrast material from the plasma (Kel), and amplitude constant (AH).
In the Tofts model, Kep is similar to Ktrans/Ve and AH corresponds to the volume of the extravascular extracellular space. The most unique characteristic of the Tofts model is that there is no need to measure arterial input function, which determines the Cp. Moreover, the arterial input function may be unreliable according to measurement and thereby may change the value of parameters.
Imaging Techniques
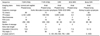
Although there has been no consensus regarding the imaging acquisition protocol for DCE MRI of the prostate, there is a general recommendation that has been recently published by the National Cancer Institute and can be accessed online (40) (Table 4). According to this recommendation, a gradient-echo sequence would be adequate for image acquisition since it is fast and can cover the entire prostate within 5 seconds. It is, unless contraindicated, recommended to suppress the peristalsis of the bowels by administrating a anti-peristaltic agent, such as butylscopolamine, for preventing the movement of the prostate during imaging acquisition. The author's protocol involving a 3T scanner is as follows: 3D acquisition of gradient sequence; repetition time/echo time, 3.3/1.6 msec; flip angle of 10°; slice thickness, 4 mm; no interslice gap; field of view, 180 mm; matrix size, 64 × 64; and the number of slices, 20. With this protocol, the time resolution of each dynamic set is 3 seconds and 150 sequences are obtained in each patient.
Clinical Significance: Advantages and Challenges
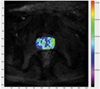
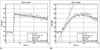
Advantages - Investigators have found that many parameters from DCE MRI are different between prostate cancer and non-cancerous tissue, including the Ktrans, Ve, initial upslope, Kep, area under a time-intensity curve, peak enhancement, and wash-out rate (30, 33, 35, 36, 41) (Fig. 10). Although it seems to be difficult to coordinate the various results of previous studies, they can be translated as the comparison between prostate cancer and non-cancerous tissue showing that cancer tissue has a high permeability and wide extravascular space, which leads to early strong enhancement and rapid de-enhancement. With unique perfusion evident in prostate cancer, studies have also shown that DCE MRI is helpful for the detection and localization of prostate cancer (11, 13, 25, 30, 41, 42) (Table 5). Moreover, based on an improved capacity for cancer detection, DCE MRI has been shown to provide a high accuracy for determining the extracapsular extension of prostate cancer (34, 43) (Fig. 11). According to Bloch et al. (34), the sensitivity, specificity, positive predictive value, and negative predictive value for the assessment of extracapsular extension for DCE MRI and T2WI was 86%, 95%, 90%, and 93%, respectively. Moreover, the sensitivity for the determination of the extracapsular extension with T2WI could be improved by more than 25% after combining it with DCE MRI. Recently, in addition to cancer detection and staging, researchers have postulated that DCE MRI is feasible and useful for monitoring the efficacy of both surgical and non-surgical treatments. According to Casciani et al. (44), DCE MRI showed a higher sensitivity (88%) and specificity (100%) for detecting local recurrence after a radical prostatectomy compared to performing an endorectal MRI alone (sensitivity, 48%; specificity, 52%). Whereas, all tumor recurrence showed signal enhancement on DCE MRI and 91% of recurring tumors showed rapid and early signal enhancement. Haider et al. (45) reported that an irregular margin of tumor on DCE MRI suggests the effect of the vascular targeted treatment, and Kim et al. (46) reported that the combination of DCE MRI and DWI showed a greater accuracy for diagnosing tumor recurrence after radiotherapy upon the discovery of a significantly greater AUC for combined DCE MRI and DWI (AUC, 0.863) compared to T2WI, DCE MRI, and DWI alone.
Challenges - Despite promising results by previous investigators with regard to using various perfusion parameters from DCE MRI for cancer detection and localization, it should be noted that those parameters also showed considerable overlap between prostate cancer and non-cancerous tissue (30, 36, 47). This limitation is prominent for differentiating prostate cancer from non-cancerous transitional zone tissue. This overlap also decreases specificity for cancer detection, as noted in previous studies (specificity of 51%) (30) (Fig. 12). This limitation is caused by increased BPH angiogenesis, which was indicated by a significant overlap of the microvessel density between BPH and prostate cancer (48).
Another challenge with DCE MRI is that there are too many parameters for observers to interpret. Indeed, it is difficult to make a single decision by comprehensively evaluating all parameters. Recently, investigators have attempted to formulate a single predictor for detecting prostate cancer on the basis of a comprehensive analysis of the various perfusion parameters. Ocak et al. (49) developed a predictor by using a generalized-estimating-equations/logistic regression model, which comprehensively analyzed Ktrans, Kep, Ve, area of time-intensity curve, and the interpretation of T2WI. The sensitivity and specificity of the computer-aided diagnosis (CAD) system was 80% and 75%, respectively. Vos et al. (50) developed a CAD system using a support vector machine and included T1, Kep, Ktrans, Ve, and late wash-out. The AUC for differentiating prostate cancer from non-cancerous tissue in the peripheral zone was 0.83, which was substantial.
Lastly, the enhancement pattern on DCE MRI may be variable since it depends on various factors including patient age, cardiovascular status, temporal resolution of MR imaging, and tissue perfusion. Therefore, since the threshold of each perfusion parameter for differentiating cancer from non-cancerous tissue may also vary, it becomes difficult to designate a threshold for cancer detection.
MR Spectroscopy
Imaging Technique
The most widely accepted technique for prostate MRS is chemical shift imaging with point resolved spectroscopy (PRESS) voxel excitation and band selective inversion with gradient dephasing for water and lipid suppression (1, 33, 51). This technique produces a cubic voxel by acquisition of three orthogonal slice selective pulses, the volume of which can be less than 0.24 mL. MRS and T2WI are usually obtained simultaneously, thereby providing the metabolic map overlaid on an anatomical display.
Histologic Background
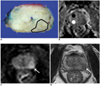
Prostate cancer detection and localization on MRS are based on the different metabolic rates of cancer and non-cancerous tissue. The abundant citrate-producing metabolism of a normal gland is replaced by a citrate-oxidating metabolism in prostate cancer (1, 2). The level of choline in cancer simultaneously increases because of a high turnover of phospholipid in cell membranes in the proliferating tissue. This metabolic shift in prostate cancer leads to the elevation of the choline/citrate ratio (2) (Fig. 13). Because of the proximity of the choline and creatine peaks observed by MRS, which was performed with a clinical MR scanner, the ratio of choline and creatine to citrate, which also is increased in prostate cancer, is the parameter of choice.
Clinical Significance: Advantages and Challenges
Advantages - Many previous studies have demonstrated that MRS improves the detection and localization of prostate cancer. According to Kurhanewicz et al. (52), choline and creatine to citrate ratio was at least 2 standard deviations greater for the cancer region in the peripheral zone, compared with the normal peripheral zone. Males et al. (53) showed that voxels with a ratio of choline and creatine to citrate greater than 3 standard deviations above the average ratio were very suggestive of cancer. According to Scheidler et al. (54), although the sensitivity and specificity for cancer detection were 77% and 61% (reader 1) and 81% and 46% (reader 2) for T2WI alone, as well as 63% and 75% for MRS alone, the specificity for the combination of MRS and MR imaging was 95%. A high level of sensitivity (up to 95%) was obtained when either test alone indicated a positive result (Fig. 14).
The combined use of MR imaging and MRS may be useful in evaluating low-risk prostate cancer. According to Shukla-Dave et al. (55), the combined use of T2WI and MRS was better at predicting the probability of insignificant prostate cancer (pathologically defined as organ confined tumor 0.5 cm3 or less in volume with no element of Gleason grade 4 or 5 cancer), compared to clinical models using preoperative clinical variables (clinical stage, serum PSA level) and/or biopsy data. These results may help to prevent some patients with clinically insignificant cancer to be over-treated.
Like DWI and DCE MRI, a prostate biopsy guided by MRS may raise the cancer detection rate in patients with elevated PSA levels and a previous negative biopsy result (56). Moreover, MRS can be used to predict the aggressiveness of the prostate cancer. Investigators observed that the ratio of choline and creatine to citrate and tumor volume correlated with the pathologic Gleason score (57).
Challenges - The major limitations of MRS are long acquisition time, inter-observer variable interpretation by postprocessing or shimming, and no direct visualization of the periprostatic anatomy (Fig. 15).
In addition, a previous biopsy leading to hemorrhage may cause field inhomogeneity, which causes spectral degradation and renders the interpretation of the metabolite ratios inaccurate. According to Qayyum et al. (58), the mean percentage of degraded peripheral-zone voxels was 19% for a MRS performed within eight weeks of a biopsy, compared to 7% for a MRS performed greater than eight weeks after a biopsy.
In recent years, the authors suggested that MRS is more sensitive than conventional MR imaging for detecting transitional zone cancer (59). Nevertheless, the cancer metabolite ratio in the transitional zone ranges so widely that the metabolite ratios overlap significantly for cancerous and non-cancerous tissues in the transitional zone.
Clinical Application
Imaging Acquisition Protocol - To date no standardized protocol for imaging acquisition has been established, particularly for the time resolution of DCE MRI, b-values for DWI, application of endorectal coil, and the external magnetization of the MR unit (1.5T or 3T). Our MRI examination is performed using a pelvic phased-array coil at a 3T unit, including T2WI, T1WI, DCE MRI, and DWI for the prostate and body (Table 6). With this protocol, the actual scanning time is approximately 40 minutes and one session for the entire examination requires approximately 50 minutes. The ADC map from the DWI and permeability map (Kep) as well as the time to peak map from DCE MRI is generated by in-house software, which are displayed on a workstation. DWI for the body is displayed in a reverse mode, which is used for detecting metastatic lymph nodes or bone metastasis. At our institution, due to the limited scanning time allowed for each patient, the MRS is only obtained in patients who have specific indications, such as clinical research or discordant findings between DCE MRI and DWI. For MRS, additional 10 to 15 minutes are required. To obtain the optimal image protocol, rectal peristalsis and the amount of rectal gas should be reduced. Rectal peristalsis may affect the interpretation of DCE MRI because the location of prostate changes by peristalsis and a large amount of rectal gas causes local field inhomogeneity, thereby leading to image distortion on DWI and spectral degradation on MRS. Therefore, at our institution, patients are requested to evacuate, and then intravenous hyoscine butyl bromide (20 mg) is injected prior to MR examination.
Finally, a comprehensive interpretation of the spin-echo images and functional MR images is a difficult task for radiologists and therefore, we recommend the same slice thickness and inter-slice gap for all images in order to reduce the burden for anatomical correlation between the various images.
Interpretation - A biopsy-related hemorrhage causes field inhomogeneity, leading to image distortion on DWI and spectral degradation on MRS. Hemorrhage may also affect the measurement of perfusion parameters when using the Tofts model because the T1 value, which is mandatory for calculating perfusion parameters, may be influenced by hemorrhage. Unfortunately, there is no method to reduce the effect of hemorrhage, its effect, which is shown to be a high SI on T1WI, should be considered when interpreting functional MR images.
Although prostate cancer detection and localization are definitely improved using functional MR images, because the spatial resolution or SNR are limited in functional images, T2WI is necessary for determining the local staging, particularly for the diagnosis of extracapsular extension. Most previous studies also showed the best diagnostic performance when combining the functional images and T2WI.
Despite markedly improving cancer detection and localization by functional MR images, limitations still exist to accurately differentiate between cancer and non-cancerous tissue in the transitional zone. Therefore, when interpreting the preoperative MR images for prostate cancer, the number and location of positive specimens from ultrasonography-guided biopsy, Gleason score, and serum PSA level should be also considered as these parameters are related with the tumor volume.
Although recent studies have shown the value of functional MRI for guiding a targeted biopsy in patients with previously negative biopsy results and elevated serum PSA levels, a systemic randomized biopsy cannot be replaced with a targeted biopsy because of mis-registration between the MRI and ultrasonographic images, which is a potential limitation of MRI for the detection of small prostate cancer, and a lack of an open magnet MR machine for MR-guided biopsy.
Future Directions - Since various functional MR techniques were introduced in clinical practice, prostate cancer detection and localization has markedly improved. Based on various biological parameters, functional MR techniques are anticipated to help monitor the non-surgical treatment responses of prostate cancer as well as guiding the intensity of local treatment. To extend the role of functional MR techniques in evaluating prostate cancer, the reliability of measuring parameters for each technique and the standardization of image acquisition protocol should be established.
Summary
Diffusion-weighted imaging, DCE MRI and MRS are currently available functional MR techniques and have been proven to be valuable for improving the diagnostic performance of MRI as a tool for evaluating the incidence of prostate cancer. To establish an accurate interpretation, it is essential that one understands the advantages and limitations of each technique.

 XML Download