

 PDF
PDF ePub
ePub Citation
 Print
Print


New technologies have been proposed to improve diagnostic performance as compared to the use of conventional breast ultrasonography (US), such as elastography and three-dimensional (3D) US (1, 2). 3D imaging that can display images in the multiplanar mode offers the aspect of a coronal plane and the technique has shown advantages for computer-aided diagnosis (CAD) (2). 3D power Doppler breast US can be used to assess the vascularity of the whole tumor as compared to the use of limited transverse and longitudinal planes with two-dimensional Doppler US. Although increased vascularity does not necessary correlate with the presence of a malignancy, an increasing vascular index such as the 'vascular index' or 'flow index' may correlate with malignant potential (3). Tissue harmonic imaging (THI) is an US technique that can eliminate many imaging artifacts such as reverberations, clutter and side-lobe. Many investigators (4-6) have demonstrated that THI improves the image quality of breast lesions by enhancement of the delineation of tumor margins and by improvement of the conspicuity of low contrast lesions.
Logistic regression analysis (LRA) is widely used in epidemiological studies for its ability to perform probability estimation using a logistic formula. In a recent study, 3D power Doppler US was able to distinguish malignant tumors from benign lesions by the use of LRA (7). The artificial neural network (NN) method is extensively used in classification for its ability to model a complex non-linear system by the use of hidden units in a compact range. An NN has been proposed to improve the diagnostic findings of breast nodules for breast US (8-15). A Support Vector Machine (SVM) is a statistical method that operates by finding a hyperplane leaving the largest possible fraction of points of the same class on the same side, while maximizing the distance of either class from the hyperplane. The SVM has been widely used in classification and regression for its high generalization performance using pattern recognition and data mining. Several breast US CAD systems using an SVM algorithm have been proposed and the use of these systems have demonstrated that the SVM has potential effectiveness (16-18).
This study aimed to compare the diagnostic performance by the use of the three statistical models (LRA, SVM and NN) as determined by the use of receiver operating characteristic (ROC) curve analysis for the classification of malignant and benign breast lesions.
MATERIALS AND METHODS
Patients
The Institutional Review Board and ethics committee of our hospital approved this study. From a consecutive series of images of suspicious masses in 183 patients (age range, 17-80 years; mean age, 44 years), 97 benign and 86 malignant cases were identified. The masses had undergone fine needle aspiration cytology, a core biopsy or/and an excisional biopsy and patients were subjected to an US examination with the use of both non-harmonic and THI. Informed consent was obtained from all patients. The largest tumor was selected in the study if more than one lesion was detected in one patient and a tumor size larger than 3.1 cm was excluded because of probe limitations. Malignant masses included infiltrating ductal carcinoma (n = 75), apocrine carcinoma (n = 3), ductal carcinoma in situ (n = 5), papillary carcinoma (n = 1), mucinous carcinoma (n = 1) and intracystic carcinoma (n = 1). Benign lesions included fibroadenoma (n = 81), papilloma (n = 1), phylloid (n = 1), sclerosing adenosis (n = 2) and other benign tumors (n = 12).
3D Power Doppler US Examinations
Non-harmonic and THI scans were obtained using a Voluson 730 scanner (GE Healthcare, Zipf, Austria) with a linear-array broadband 6-12 MHz transducer. The transducer had a relative stopping power (RSP) index of 6-12. A fixed installed 3D power Doppler setting for all US examinations was used as follows: a sweep angle of 5° to 29°, 'low 1' wall motion filter, 0.9 kHz pulse repetition frequency, -0.6 gain and mid frequency. Patients were examined in the supine position and were asked to hold their breath while the scanner generated the 3D volume. Movement of the probe was also avoided. The duration of the 3D volume acquisition was approximately 20 seconds.
All of the acquired 3D power Doppler non-harmonic and THI scans were stored on a disc and no compression of the data was used at any time. Acquired 3D volumes were transferred to a personal computer using a digital imaging and communications in medicine (DICOM) connection for later offline imaging analysis.
Imaging Analysis
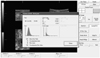
The virtual organ computer-aided analysis (VOCAL)-imaging program (version 2.1) was used to analyze the stored volume with a personal computer (M5, ASUS, Taipei, Taiwan). Detailed measurements and the application of the VOCAL-imaging program have been reported previously (19-21). In brief, the program can be used to calculate the histogram indices of the vascularity and blood flow obtained from quantitative 3D power Doppler US scanning. Both gray-scale and color scale voxels are graded from the lowest value (intensity, 0) and the highest value (intensity, 100). The stored US volume is defined by the smallest unit of volume, also a voxel. Three histogram indices, the vascularization index (VI), flow index (FI) and vascularization flow index (VFI) were calculated using these values. In a previous study, Jarvela et al. (19) have described these indices and detailed formulas. In brief, VI represents the vessels in tissue and VI is expressed as a percentage; FI represents the average intensity of flow (i.e., the mean color value of the color voxels); VFI represents both vascularization and flow (i.e., the mean color value of all of the voxels in the obtained volume). Mean grayness (MG) is a representation of the average grayness in the gray voxels of a sphere.
During measurement for all non-harmonic and harmonic 3D power Doppler image analyses, we used the VOCAL-program with the manual model with a rotation step of 30° to perform contour defining. We defined the contour around the tumor. The volume was obtained, since contours in the six image planes were determined; the histogram indices MG, VI, FI and VFI were determined once the contour was accepted (Fig. 1).
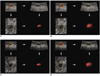
We prepared schemes for two signals to assess the vascularity of each tumor. One signal was the shell-off contour (i.e., the contour around the tumor margin) and the other signal was the outside shell with a thickness of 3 mm. Figure 2 shows the two power Doppler signals. We labeled the histogram indices VI, FI and VFI for the intra-tumor (inVI, inFI and inVFI) and for shells with a thickness of 3 mm surrounding the breast lesion (out3mmVI, out3mmFI and out3mmVFI). In addition, two vascular signals were obtained for the THI scans, the histogram indices of VI, FI and VFI for the intra-tumor (HinVI, HinFI and HinVFI) and for shells with a thickness of 3 mm surrounding the breast lesion (Hout3mmVI, Hout3mmFI and Hout3mmVFI) (Fig. 2). Briefly, histogram indices representing the MG and vascularity characteristics (VI, FI and VFI) of a mass were measured quantitatively from sonograms for both 3D power Doppler non-harmonic and THI.
Vascularity indices were recorded as 0 in scans with no vascularization as determined with the use of 3D power Doppler US. One of the investigators performed all of the clinical examinations of breast US. Imaging analysis was performed by one physician using the virtual organ computer-aided analysis (VOCAL TM) imaging program (version 2.1, GE Medical Systems) who was blinded to the histology results. Repeat measurements were performed for reproducibility.
Statistical Analysis
Logistic regression analysis, SVM and NN were employed in a comparative analysis for the characterization of benign and malignant solid breast masses using 3D power Doppler imaging with the use of both non-harmonic US and THI. The performance of each statistical method included the overall parameters of inVI, inFI, inVFI, out3mmVI, out3mmFI and out3mmVFI. The performance measurements, including diagnostic accuracy, sensitivity, specificity, positive predictive value (PPV), negative predictive value (NPV) and the area (Az) under the ROC curve were calculated to estimate the performance of the diagnostic system. All p values < 0.05 were considered to be statistically significant.
Logistic Regression Analysis
For a pool of N samples, N-1 was fitted to an LRA model defined by Log (p) = α+ β1X1 + β2X2 + … + βkXk, where p is the probability of a malignancy, α is a constant, β1, β2, …, βk are logistic regression coefficients and X1, X2, …, Xk are parameters; α and β determine the shape of the logistic curve. We employed the Statistical Package for the Social Sciences (SPSS 15.0 statistical software, SPSS, Chicago, IL) to calculate the multivariate LRA of patient age, tumor volume and the vascularization indices of the benign and malignant breast tumors.
Support Vector Machine
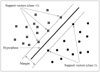
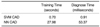
An SVM is a machine learning system developed using statistical learning theories to classify data points into two classes. Notably, SVM models have been applied extensively for classification, image recognition and bioinformatics. The SVM has been shown to be an effective tool in sonography for the diagnosis of breast cancer (16, 17, 22). The SVM algorithm reveals the feasibility and superiority to extract higher-order statistics. The maximal margin classifier aims to find a hyperplane to separate the training data. Of the possible hyperplanes, only one hyperplane maximizes the margin (distance between the hyperplane) and the nearest data point of each class. Figure 3 shows an optimal separating hyperplane with the largest margin. The support vectors denote the points lying on the margin border. The value produced by the output node is used to decide whether a tumor is benign or malignant. For an output value ≥ 0, the SVM system will classify the tumor as malignant; conversely, for an output value < 0, the tumor will be diagnosed as benign. The time consumed using the SVM method is shown in Table 3.
Neural Network
Neural networks have been successfully applied for aided diagnoses of solid breast nodules in US examinations. Chen et al. (9) have described in detail the application of CAD to US of solid breast nodules by the use of NNs. An NN model consists of hidden layers. The function of neurons in the hidden layer is to arbitrate between the input and output of the NN. The input vector is first supplied to the source nodes in the input layer. The neurons of the input layer constitute the signals applied to the neurons of the hidden layer. The output results of the hidden layer are employed as inputs to the next hidden layer. The output layer eventually generates the results and terminates the NN computing procedure. Among the learning algorithms used to train an NN, the back-propagation algorithm is the most widely used. The learning method iteratively executes the back-propagation algorithm for the training set and then produces the final synaptic weight vectors. The NN model has been used as a classifier by applying the final synaptic weight vectors to identify the tumor as benign or malignant. The input signals of the NN classifier contain a feature vector that comprises the vascularity indices of each breast tumor. The tumor is classified as benign if the output value is close to 0; the tumor is classified as malignant if the output value is near to 1.
RESULTS
A total of 183 solid breast image pairs (as measured with non-harmonic and harmonic 3D power Doppler imaging) were analyzed. The sizes of the lesions ranged from 6.00-31.00 mm (mean size, 18.97 mm) for malignant tumors and 5.00-30.20 mm (mean size, 14.73 mm) for benign lesions. Histogram indices for the use of 3D power Doppler non-harmonic US scans were calculated. Twenty-three benign and two malignant cases were detected without intra-tumor vascularity; 14 benign cases and one malignant case were detected without vascular signals in shells with a thickness of 3 mm surrounding the breast lesions as determined by use of the VOCAL program. These histogram indices were labeled 0.
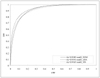
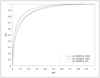
Table 1 summarizes the accuracy, sensitivity, specificity, PPV and NPV for the use of 3D power Doppler US non-harmonic and THI for the differentiation of benign from malignant breast tumors by the use of the different statistical methods. Table 2 shows the Az value of ROC curve analysis for the diagnostic performance of LRA, SVM and NN for 3D power Doppler non-harmonic and THI of solid breast tumors. The statistical significance of the difference comparing two ROC curves (LRA versus SVM, LRA versus NN and SVM versus NN, respectively) is also presented in Table 2. The difference was not statistically significant (p values > 0.05). The computation time of the CADs using the SVM and NN classifiers is displayed in Table 3. The training time was evaluated by the use of the US image database containing 183 images. The diagnosis time was the average computation time for one case. Analysis of Az by LRA, SVM and NN for non-harmonic and harmonic imaging using 3D power Doppler US is shown in Figures 4 and 5.
DISCUSSION
In our study, satisfactory results were shown by the use of both harmonic and non-harmonic 3D power Doppler sonographic imaging to classify benign and malignant breast tumors by vascularization, and LRA, an SVM or NN were applied to assess diagnostic performance. An NN and SVM have been shown to be acceptable diagnostic models for CAD systems. Vascularity scoring with 3D power Doppler US can predict the malignant potential of breast tumors, as has been recently demonstrated (7). Our study demonstrated that the areas under the six ROC curves of LRA, the SVM and NN for nonharmonic or harmonic 3D power Doppler imaging were similar. We conclude that there was no difference in diagnostic ability among these three statistical models by applying the models to both non-harmonic and harmonic 3D power Doppler images.
In a study by Song et al. (23) that compared LRA with an NN for 24 malignant and 30 benign masses, no difference in performance for the masses as measured by the area under the ROC curve was demonstrated; however, the NN had better specificity than LRA for a fixed sensitivity. However, it is difficult to assess whether the advantage of an NN as compared to LRA in a local region of an ROC curve is statistically significant. In several previous studies (11, 14, 15), a diagnostic model based on an NN showed promise for breast tumor diagnosis. In our study, the LRA approach for non-harmonic imaging had the highest Az value (0.9341) and the NN method for non-harmonic imaging had the highest level of accuracy (88%). In a study by Huang and Chen (17) that compared multilayer perception neural networks (MLPs) with an SVM for 140 US images of solid breast nodules, the investigators demonstrated that the training and diagnosis procedures for the proposed SVM model were 700-fold and 2380-fold faster as compared to the MLPs, respectively. Furthermore, the results from the use of the SVM model revealed better classification performance by the use of texture analysis. The time consumed for training and diagnosis procedures for the NN classifier were 39.97-fold and 58.75-fold that of the use of the SVM CAD in our study. The diagnostic performances as determined by the Az values for the use of LRA, the SVM and NN were nearly identical, and the shapes of the six curves were similar (Figs. 4, 5). These results differ from a previous study (23). Song et al. (23) reported that the use of an NN had a higher specificity as compared with LRA at a fixed 95% sensitivity. According to our results, the left portion of the ROC curve of 'non-harmonic'_LRA was extended more to the left side as compared with 'non-harmonic'_ SVM or 'non-harmonic'_NN (Fig. 4). This finding implies that LRA for non-harmonic 3D power Doppler imaging has better specificity as compared to the SVM or NN for a fixed sensitivity. For harmonic imaging, 'harmonic'_LRA is extended more to the left side as compared with 'harmonic' SVM or 'harmonic'_NN (Fig. 5). It is difficult to appraise whether the advantage of the use of LRA as compared to the other models for the local region of an ROC curve reaches statistical significance. Furthermore, it is difficult to compare differences among investigations, as the application of different parameters (such as texture analysis or vascular indices) to the same model does not necessarily indicate identical diagnostic performance.
In summary, sensitivity for the LRA approach for harmonic imaging had a value of 93%. Moreover, LRA for both non-harmonic and harmonic 3D power Doppler imaging had better specificity as compared to the SVM or NN for a fixed sensitivity.


 XML Download