

 PDF
PDF ePub
ePub Citation
 Print
Print


Abbreviations
CM
contrast material
CTA
computed tomography angiography
CX
circumflex coronary artery
DSCT
dual source computed tomography
EF
ejection fraction
HU
Hounsfield unit
LAD
left anterior descending artery
LM
left main coronary artery
RCA
right coronary artery
ROI
region of interest
TME
time to maximum enhancement
Computed tomography angiography (CTA) is a minimally invasive tool utilized for the demonstration of vascular anatomy and related disorders of several body regions (1). CTA enables fast scanning during the arterial phase of contrast administration that provides maximum contrast between the artery itself and its surroundings, particularly the venous structures (2). Contrast timing and adequate enhancement is crucial for optimum image analysis and for a high quality post-processing procedure, which necessitates sufficient arterial enhancement for multidimensional (two-dimensional and three-dimensional) evaluation (2). In order to obtain maximum efficacy from multidetector computed tomography (MDCT) angiography, accurate timing of contrast bolus injection is vital. Cademartiri et al. (2) based this issue on bolus geometry that is defined as the pattern of enhancement in a region of interest (ROI) drawn on a time/attenuation diagram. Several studies have focused on accurate timing of contrast bolus enhancement and geometry, and have focused on factors that affect accurate timing of contrast bolus enhancement and geometry (3-7). In this study, we have investigated the effect of administration of warmed contrast material (CM) on bolus geometry and enhancement.
MATERIALS AND METHODS
Patient Population
Between January 2007 and February 2007, 64 consecutive patients (42 men, 22 women; mean age, 56 years; age range, 37-75 years) were enrolled in this study. All patients were referred to our department for CTA evaluation for possible coronary artery disease. Informed consent was obtained from each patient. Inclusion criteria were as follows: a minimum age of 18 years, absence of any contraindication to intravenous CM and no history of coronary artery stent and/or by-pass graft. Exclusion criteria were a history of chronic renal failure and adverse reactions to CM, pregnancy, a history of myocardial infarction and chronic heart failure.
Study Design
Local ethics committee approval was obtained before the beginning of the study, and the study was designed in a prospective randomized manner. A total of 64 patients were randomly divided into two separate groups. In the first group (group 1), warmed CM and saline was administered while in the second group (group 2), normal CM and saline were used. Group 1 consisted of 32 patients (23 men, 9 women; mean age, 59.9 ± 9.3 years; mean weight, 80.5 ± 13.6 kg; mean height, 169.8 ± 8.7 cm) while group 2 consisted of 32 patients (19 men, 13 women; mean age, 52 ± 10.4 years; mean weight, 79.4 ± 14.1 kg; mean height, 170 ± 10.4 cm). Warmed CM and saline were kept in a research-dedicated incubator at a continuously monitored constant temperature of 37℃ for at least 12 hours. For group 2, CM and saline solutions were kept at constant room temperature of 24℃ for at least 10 hours before injection. The room temperature was kept constant by the use of an air conditioning system. The staff technologists of the CT unit continuously monitored the room temperature.
Image Acquisition
Cardiac CT scans were performed with a dual source CT (DSCT) scanner (Somatom Definition; Siemens, Erlangen, Germany). No beta-blocker was used in any of the enrollees for regulation of the heart rate. After the acquisition of an initial scout image (120 kV, 36 mAs), the area between the carina to the apex of the heart was scanned.
A test bolus technique was used before image acquisition in each patient. Thirty non-incremental images of CT sections were obtained at the level of the main pulmonary artery with the following parameters: 120 kV, 45 mA, 0.75 sec scan time, 10 mm slice thickness. For test bolus scans, 20 ml of iodinated contrast agent (Omnipaque [Iohexol] 350 mg I/mL; Nycomed, Princeton, NJ) was administered by an automated injector (Ulrich; Ulrich Medical, Ulm, Germany) at a rate of 5 ml/sec via an 18-gauge needle placed into the right antecubital vein. Following CM administration, 20 ml of saline was administered at a flow rate of 5 ml/sec through the same venous access. An ROI was plotted inside the ascending aorta and a bolus geometry curve was acquired. Curve diagrams were analyzed immediately after acquisition, and the time to maximum enhancement (TME) scan delay was measured by adding up to 4 additional seconds to the TME value.
Image acquisition was performed when the patient underwent a breath-hold. Iodinated contrast agent (80 ml) was injected into the right antecubital vein via an 18-gauge catheter with an injection rate of 5 ml/sec by the use of an automated injector (Ulrich; Ulrich Medical) and 40 ml of saline was infused following CM administration at the same flow rate.
Dual source CT image acquisition parameters were as follows: 0.75 mm slice thickness, tube voltage of 100 kV for both tubes, 560 mA current with modulation and full current between 30% and 80% of the cardiac cycle, gantry rotation time of 0.330 sec and pitch 0.2-0.43 adapted to the heart rate. Using a medium soft convolution kernel and a mono-segment reconstruction algorithm that uses the data from a quarter-rotation of both detectors, 1 mm axial images were reconstructed for the entire cardiac cycle, with reconstruction intervals in 10% steps. Computed tomography images were transferred to a workstation (Leonardo; Siemens, Germany) for post-processing and final evaluation.
After image acquisition, each patient completed a survey consisting of four questions. Every patient was questioned regarding the severity of several subjective sensations of a feeling of shivering, warmth and cold, as well as a feeling of urgent void on a 5-point scale (1 = none, 2 = small, 3 = tolerable, 4 = extensive, 5 = very extensive).
Image Analysis
For each group, test bolus image series and DSCT angiography images were evaluated using the same workstation. For analysis of the test bolus image series, ROI curves of 3 cm2 were placed on the center of the ascending aorta, main pulmonary artery and descending aorta, respectively. Enhancement values of each slice (overall, 30 values) were noted separately in Hounsfield units (HU). Using enhancement values, time/enhancement diagrams were created for each of these three vessels in every patient. On these diagrams, basal HU values representing the initially acquired unenhanced HU value were subtracted from the sequentially obtained HU values, and finally, 100 HU was accepted as the cut-off (threshold) value for the beginning of enhancement. After this procedure, time to peak (the time required to reach the maximum enhancement value from zero HU), time required to reach 100 HU enhancement (threshold of enhancement), maximum enhancement value (HU) and duration of enhancement above 100 HU (plateau time) were noted.
Reconstruction interval series (40%, 50%, 60% and 70%) of the DSCT coronary angiography studies were evaluated. The most optimum interval for analysis by the use of plotted ROI circle enhancement values of each segment (proximal, middle, distal) of the right coronary artery (RCA), left anterior descending artery (LAD), circumflex coronary artery (CX) and left main coronary artery (LM) were noted. Since the diameters of coronary arteries varied because of dominancy, areas of the ROI curves used for coronary arteries could not be kept constant; however, in each artery, the entire luminal area was covered. Using the evaluation software of the workstation (In space, Leonardo; Siemens), the ejection fraction (EF) of each patient was calculated to exclude patients with an EF < 60%.
Statistical Analysis
Statistical analysis was carried out with the use of the SPSS software package (SPSS, Chicago, IL). Data are presented as means ± standard deviation. For the comparison of the following parameters mean time to peak, time required to reach peak enhancement, duration of enhancement above 100 HU (plateau time) the Mann Whitney U test was used.
For a comparison between the two groups regarding demographic properties, EF, mean coronary artery enhancement and maximum enhancement during test bolus studies, the t-test was used. A p value of 0.05 was considered as a threshold for a significant difference.
RESULTS
No significant differences were seen for demographic factors such as sex, age, height and weight between the two study groups. Mean heart rates during scans were 71 and 67 beats per minute for group 1 and group 2, respectively, and there was no significant difference between the two groups.
The mean EF values were 65 ± 4% and 66 ± 3.5% for group 1 and group 2, respectively. No significant difference was noted between the two groups.
Coronary CT angiography was performed successfully in 64 patients and no major complications occurred. There was no significant difference in the results of the survey including the feeling of shivering, warmth and cold as well as the feeling of the need for urgent void on a 5-point scale between the two groups (Table 1).
In the ascending aorta, the mean maximum enhancement values during test bolus analysis were 210 ± 25 HU and 178 ± 21 HU, for group 1 and group 2, respectively. In the descending aorta, the mean maximum enhancement values during test bolus analysis were 205 ± 22 HU and 174 ± 19 HU for group 1 and group 2, respectively. In the main pulmonary artery, the mean maximum enhancement values during test bolus analysis were 318 ± 30 HU and 283 ± 27 HU for group 1 and group 2, respectively. A statistically significant difference between the two groups for maximum enhancement values in the ascending aorta and descending aorta and main pulmonary artery (p = 0.005) was detected.
In the ascending aorta, the mean duration of enhancement above 100 HU (plateau time) during test bolus analysis was 6.6 ± 1.51 sec and 5.9 ± 2.2 sec for group 1 and group 2, respectively. There was no significant difference between the two groups for the duration of enhancement above 100 HU (plateau time) in the ascending aorta (p = 0.187). In the descending aorta, the mean duration of enhancement above 100 HU (plateau time) during test bolus analysis was 6.7 ± 1.48 sec and 5.8 ± 2.11 sec for group 1 and group 2, respectively. There was no statistically significant difference between the two groups for the duration of enhancement above 100 HU (plateau time) in the descending aorta (p = 0.063). In the main pulmonary artery, the mean duration of enhancement above 100 HU (plateau time) during test bolus analysis was 6.0 ± 1.25 sec and 5.3 ± 1.21 sec for group 1 and group 2, respectively. No significant difference between the two groups was detected for the duration of enhancement above 100 HU (plateau time) in the main pulmonary artery (p = 0.187).
The time to peak values during test bolus analysis was found as 4.26 sec and 4.28 sec in the ascending aorta, 4.03 sec and 4.12 sec in the descending aorta and 5.16 sec and 5.20 sec in the main pulmonary artery for group 1 and group 2, respectively. There was no statistically significant difference between the two groups for the time to peak values in the major vessels.
In the ascending aorta, the median time required to reach the 100 HU enhancement value (threshold for enhancement) during the test bolus analysis was 1.50 sec and 2.25 sec for group 1 and group 2, respectively. A statistically significant difference was detected between the two groups for time required to reach the threshold enhancement value in the ascending aorta (p = 0.034). In the descending aorta, the median time required to reach the threshold enhancement value during test bolus analysis was 1.50 sec and 1.87 sec for group 1 and group 2, respectively. There was no statistically significant difference between the two groups for the time required to reach the threshold enhancement value in the descending aorta (p = 0.305). In the main pulmonary artery, the median time required to reach the threshold enhancement value during test bolus analysis was 2.62 sec and 2.50 sec for group 1 and group 2, respectively. There was no significant difference between the two groups for the time required to reach the threshold enhancement value in the main pulmonary artery (Table 2).
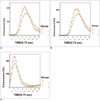
Time/enhancement curves were constructed for the ascending aorta and descending aorta and the main pulmonary artery in both groups. In the ascending aorta and descending aorta and the main pulmonary artery for group 1, the bolus geometry curve shifted to the left and upwards as compared with the bolus geometry curve for group 2 (Fig. 1). There was no significant difference between group 1 and group 2 for the mean enhancement values of the coronary artery segments (Table 3).
DISCUSSION
Cademartiri et al. (2) defined optimal bolus geometry of CT angiography as an immediate increase in enhancement of the artery of interest to a maximum enhancement value just before the initiation of a scan and reaching a steady state interval in which enhancement does not change during image acquisition. However, actual bolus geometry differs from optimal geometry as following a steady increase of enhancement, a steady decrease occurs in actual bolus geometry and CT angiography images are acquired during this up-slope and down-slope period (2). Accurate timing of CM injection and an optimum start of image acquisition is important to obtain images with diagnostic quality (8). For this purpose, uniform and prolonged enhancement of the artery of interest is important for image post-processing and final image analysis, since those factors are highly dependent on the contrast difference between vessels of interest and background tissue (9).
Several studies had focused on various factors such as patient demographics, cardiac functions, several diseases, injection volume, injection rate, iodine concentration of the CM, use of bolus chaser and prandial status and injection site that affect actual bolus geometry (3, 4, 8, 10-16). None of the studies has compared the effects of warmed CM on bolus geometry. A study by Vergara and Seguel (17) investigated the effects of warmed non-iodinated CM on the prevalence of adverse reactions to CM. The investigators determined that warming the CM to the level of body temperature (35℃) before administration increased patient compliance and tolerance. Cademartiri et al. (18) used warmed CM in their study for the determination of the effect of iodine concentration on vascular attenuation. However, neither of these studies focused on the effect of warming the CM on vascular enhancement and bolus geometry.
Our results showed that warming CM to 37℃ led to an increase of the peak enhancement value and shortening of the time to reach the enhancement level of 100 HU in the ascending aorta and descending aorta, respectively. A shift of the bolus geometry curve towards the left in both the ascending aorta and descending aorta was noted. Although the plateau duration in the bolus geometry curve was not found as statistically significant in the descending aorta, p values of this analysis might represent a significance tendency. The mean enhancement of all segments of the coronary arteries (except for the middle segment of the LAD) was found to be increased in the patient group that had received warmed CM, but the difference between the two groups was statistically insignificant probably due to the relatively small patient population.
Knollmann et al. (19) concluded that the use of highly concentrated iodinated contrast agent injected at high rates does not increase iodine delivery to the vessel of interest due to high viscosity. Halsell (20) proposed that heating the CM is the most efficient method for the administration of the high-viscosity CM through small-bore catheters. When CM is warmed from 20℃ to 37℃, the viscosity decreases nearly 50% (14.5/7.5) (18). Our results related to bolus geometry parameters can be explained by the lowered viscosity of the warmed CM.
We determined that the use of warmed CM provides more enhancement and shortening of the time required to reach the threshold enhancement value (100 HU), which resulted in better visualization of the vessel of interest. The lower viscosity of the warmed CM can explain these results. This advantage may be exploited for various CT angiography applications, but for coronary CT angiography; since our results did not reveal a statistically significant difference, the utility of the use of warmed CM remains questionable, but further research with a larger study group is required.
One limitation of this study is that results were obtained from the test bolus analysis. However, test bolus analysis results may not always reflect diagnostic CT angiography examination results. In addition, bolus geometry curves could not be obtained from diagnostic CT angiography images. Another limitation is the automated injector (Ulrich; Ulrich Medical, Ulm, Germany) that was used for CM injection. The unit was a roller injector, unlike commonly used barrel injectors in CT applications; therefore, the results cannot be interpolated for the use of other power injectors. Finally, we did not make a pressure assessment of the power injector system, and possible effects for changes in pressure were not included.
In conclusion, the use of warmed CM yielded better enhancement and a shorter time required to reach the threshold enhancement value that resulted in a shift of the bolus geometry curve to the left. Although the use of warmed CM may provide better image quality, further large-scaled studies are still required in clinical applications for the final analysis of CTA studies.


 XML Download