

 PDF
PDF ePub
ePub Citation
 Print
Print


The development of higher performance gradients, which can acquire three-dimensional images within 40 seconds, has led to improvements in contrast-enhanced MR angiography procedures, and the technique has become acceptable as a feasible diagnostic modality (1-7). To maximize arterial signal intensity, bolus injection of contrast media using a power injector was introduced and the subsequent adoption of this injection technique represents a useful procedural improvement (8, 9). The bolus enhancement thus obtained resulted, however, in a narrow temporal window for data acquisition and high levels of venous and soft tissue enhancement. To overcome these problems, large amounts of contrast medium and precise acquisition timing have been emphasized (1, 8, 10-13).
For proper acquisition timing, data acquisition was usually delayed after bolus injection of the contrast media until peak enhancement of the target vessel. Several methods for calculating scan delay time have been suggested (1, 6, 8, 10), and among these, the method suggested by Prince (1) (scan delay time = peak enhancement time + infusion time/2 acquisition time/2), has been commonly used. Time-intensity curves for the test-bolus injection of contrast media are plotted, and the peak enhancement time of the target vessel is thus predicted. Filling the center of K-space during peak enhancement of the main contrast bolus is thought to be the best method of increasing precision (1, 8). To compensate for the discrepancy in peak enhancement times between the test and main bolus, constants or variables were therefore added to the peak enhancement time of the test bolus. The variable used was invariably half of the infusion time . This compensation was based on the premise that the length of the main contrast bolus would be equal to the infusion time of the main bolus.
We found, however, that enhancement duration and infusion time during routine MR angiography were different. A previous study also demonstrated that a 0.5-sec test injection of 1 mL gadolinium chelate led to 6-8 secs of arterial enhancement (8). This inequality between infusion time and enhancement duration results in calculation of a shorter scan delay time and earlier data acquisition. This latter includes a large portion of the unenhanced phase, especially in the case of MR angiography using a low-dose contrast medium coupled with rapid injection.
In this study, we aimed to establish the most reliable parameters for determining scan delay time in MR angiography, and to this end compared the time-intensity curves obtained from test and main bolus injections.
MATERIALS AND METHODS
Subjects
Eleven volunteers were involved in this experiment and for the evaluation of musculoskeletal pathology, all underwent MR imaging procedures. The sex ratio was 7:4 (male: female) and their ages ranged from 15 to 68 (mean, 40.4) years. All experiments were carried out with institutional review board approval and the subjects informed consent. During musculoskeletal MR examination, the step involving contrast-enhancement was replaced by this experiment. Just before the acquisition of contrast-enhanced musculoskeletal MR images, test-bolus and main bolus studies were performed consecutively. Because no arterial enhancement phase was needed during this imaging procedure, our experiment did not lead to the deterioration of musculoskeletal MR images.
Examination protocol
For the test-bolus study, 2 mL of contrast media (Omniscan, Nycomed Imaging AS, Oslo, Norway) was injected into the right antecubital vein of the upper extremity through a 20-21 gauge needle at a rate of 3 ml / sec, using a power injector (Medrad, Indianola, PA). In order to propel the previously injected contrast bolus, 20 ml of normal saline was subsequently injected behind the contrast medium at the same rate. Repeated acquisition of image data coincided with the start of contrast injection, and images were acquired for a period of 120 seconds. A 1.5 T MRI scanner (Magnetom Vision Plus; Siemens Medical systems, Erlangen, Germany) was used with the pulse sequence set at two-dimensional turbo fast low angle shot (turbo-FLASH). Repetition time (TR), echo time (TE), and flip angle (FA) were 8.5 msec, 4.0 msec, and 10 degrees, respectively. The inversion time of this sequence was 100 ms and sinc interpolation was performed. Slice thickness, field of view (FOV), numbers of phase encoding (Ny) and frequency encoding (Nz) were 8 mm, 263×350 mm, 96 and 256, respectively. The receiver bandwidth was 355 Hz/pixel and data oversampling was set along the read-out gradient. A saturation band was not added. Temporal resolution was one second and acquisition continued for 120 seconds by means of two sequential 60-second scans, without intermission. This repeated acquisition was performed in a single slice at the level of the infrarenal abdominal aorta.
The main-bolus study involved the use of the same pulse sequence at the same location. The dose of injected contrast material was 0.1 mmol / kg and the injection rate was the same as that of the test-bolus. Acquisition continued for 180 seconds in three consecutive phases, during which time the subjects breathed normally.
Data analysis
After the reconstruction of raw data, time-intensity curves for each phase of each part of the study were drawn corresponding to the aorta and the inferior vena cava. In order to cover the whole cross sectional area of the aorta and the inferior vena cava, regions of interest (ROI's) were drawn as large as possible. To reduce inter-observer error between the test-bolus and main bolus studies, all ROI's were drawn by a single researcher. Automatic scaling was selected for each time-intensity curve obtained during the first phase. For the time-intensity curves of the second and third phases, maximum signal intensity was manually equalized to that of the first phase curve in order to provide a normalized series of curves across the three phases.
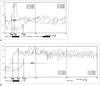
The parameters measured from the time-intensity curves were arterial and venous enhancement time (Tae and Tve), arteriovenous circulation time (Tav), arterial peak-enhancement time (Tp), enhancement duration (ED) and enhancement expansion ratio (EER) (Fig. 1). Enhancement time was defined as the time interval between the starting point of data acquisition and the point at which half-maximum height in the upstroke portion of the time-intensity curve was seen, and from it, the arrival time of the contrast bolus at the target vessel could be inferred. The formula for the arteriovenous circulation time (Tav) was as follows: -
where Tav is the period of pure arterial enhancement before subsequent venous enhancement. Tp is the time taken to reach the peak of the arterial time-intensity curve and represents the time for peak enhancement. This parameter was the only one used in traditional scan delay time calculations. ED was defined as the time interval between the rising point of the arterial time-intensity curve and the end point of the downstroke of the curve as it approached the baseline of residual enhancement. In traditional timing methods, this parameter is regarded as equal to infusion time; thus, instead of ED, infusion time was used as a variable to fit the center of the main bolus to the center of data acquisition time. Since ED was presumed to be longer than infusion time, EER was also measured, and was calculated according to the following formula: -
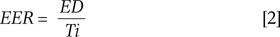
where Ti = infusion time of contrast media (sec)
Test-bolus and main bolus studies were performed with as short an intermission as possible. Test bolus and main bolus in a single volunteer were thus compared on the assumption that both studies were performed while physiological status was the same. Using Pearson's correlation, parameters were analyzed and compared.
RESULTS
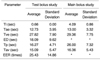
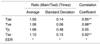
Average Tae's in the test-bolus and main bolus studies were 12.73 and 13.00 seconds, respectively. When the main bolus time-intensity curve was compared with that of the test-bolus, Tae ratios ranged from 0.89 to 1.43 with an average of 1.05, implying a slightly delayed Tae for the main bolus. This latter showed a higher maximal signal intensity at Tp than did the test bolus. Average Tav's of the test-bolus and main bolus studies were 15.09 and 16.36 seconds, respectively. The average ratio of Tav ratio 1.10, indicative of a slightly longer Tav for the main bolus. For these two comparisons, the correlation coefficients of 0.95 (p < 0.01) and 0.92 (p < 0.01), respectively, were statistically significant. The correlation coefficient of Tve's between test and main boluses was 0.98 (p < 0.01) (Tables 1 and 2).
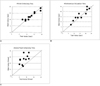
The ED's of both main and test bolus were increased more than did infusion times. Since no acute translation point was detected in the down-slope of the time-intensity curve, the ED of the main bolus was hard to define accurately. The EER of the test-bolus study showed a wide range, from 16.00 to 67.16 (average, 25.43) depending on the subject. The Tp of the main bolus was 1.7 times longer than that of the test bolus. The comparisons of ED, EER and Tp showed no statistically significant correlations with high standard deviations (Tables 1 and 2, Fig. 2), though it was clear that Tp in the test-bolus study matched the initial portion of the main bolus. The matched portion ranged from 0 to 13.33 (average, 5.4) percentile of the main bolus (Fig. 2).
DISCUSSION
The most accepted traditional method for calculation of the scan delay time (1) fits the center of data acquisition to a point consisting of the arterial peak enhancement time of the test-bolus and half of the injection duration, with the purpose of matching the centers of K-space and the main bolus. As seen in the results of this study, however, the arterial peak enhancement time acquired from the test-bolus study matched the initial portion (less than the 13th percentile) of the main bolus rather than its center. In addition, the mismatch between arterial peak enhancement time and the center of the main bolus was not compensated for by adding one half of the injection duration, since the bolus tends to elongate more than the duration of injection. In fact, the traditional method places the center of data acquisition at the initial portion of the main bolus, making the initial portion of K-space acquire the unenhanced and less enhanced arterial signal. Infusion time and arterial enhancement time, the parameters for determining scan delay time by the traditional method, therefore showed poor statistical correlation between test and main boluses.
On the basis of the results of this study, we are able to suggest the most reliable parameters for determining the scan delay time in MR angiography. From the time-intensity curves obtained from the test and main bolus injections, we found that arterial and venous enhancement times and arteriovenous circulation time obtained from the test bolus showed statistically significant correlation between the test and main boluses. That is, these three parameters predicted the shape of main bolus.
In this study, standardization of the parameters was achieved by selecting approximate median values of adjacent plots on the time-intensity curve, which was affected by pulsating arterial flow (Fig. 2). Arterial and venous enhancement times were defined as the times showing half-maximum intensities. Arteriovenous circulation time was subsequently defined as the gap between arterial and venous enhancement times, and might represent pure arterial enhancement without venous contamination. It was also noted that the circulation time of the main bolus showed a slight delay (a factor of 1.10 on average) compared to the test-bolus. In the main bolus, due to increased venous peak signal intensity, the time of half-maximum intensity (venous enhancement time) was delayed, leading to increased arteriovenous circulation time (Fig. 2). Arterial enhancement time of the main bolus was also slightly delayed (a factor of 1.05, on average) compared with that of the test bolus. Although the causes of slight delays in arteriovenous circulation time and arterial enhancement time are not clearly understood these parameters showed close statistical correlation between test and main boluses. To elucidate the causes and the implications of these delays, a more comprehensive study is required.
With regard to enhancement duration, which might play a role in determining scan delay time, the test-bolus time-intensity curve showed a definite rising point and a point at which it reached a post-enhancement plateau, so there was no difficulty in measuring bolus length. For the test bolus, the duration of enhancement was definitely greater than the infusion time of the contrast medium. On the main bolus time-intensity curve, the point at which the post-enhancement plateau was reached could not be clearly defined; this was because the elevated curve did not show a sharp deviation towards the plateau. Measurement of the duration of enhancement thus had an associated high level of uncertainty. It was clear, however, that for the main bolus, arterial enhancement time was much longer than infusion time. To investigate the correlation between enhancement duration and infusion time we calculated the enhancement expansion ratio defining this as enhancement duration divided by infusion time. There was, however, no significant correlation between this ratio and infusion time of the test bolus. Since, in the case of the main bolus, accurate measurement was not available, a comparison of the enhancement expansion ratio between the test and main bolus was not possible. These findings suggest that the enhancement expansion ratio can not be used as a parameter for predicting the characteristics of the main bolus.
Other considerations in this study were the effect of saline flush and the amount and injection rate of the test bolus. During the injection of contrast media, saline flushing was routinely added in CE-MRA, though the effect of this was not clearly confirmed. Our experience suggests that if a contrast bolus is followed by a saline bolus, the former will be pushed, and a higher flow rate than that of normal venous blood thus achieved. The contrast bolus is thus able to reach the right atrium with less dilution by unenhanced blood from conjoining venous branches. In the test-bolus study, 2 ml of contrast media was injected at a rate of 3 mL/sec. Although some reports have suggested that 1 ml of contrast bolus should be sufficient for a time-intensity curve (6, 8, 14), a 2 mL test bolus was used in order to achieve improved definition of the venous time-intensity curve. As for the injection rate, no published report, as far as we know, has suggested an optimal injection rate for the three-dimensional turbo-FLASH sequence. It has, however, been reported that an adequate injection rate for evaluating the abdominal aorta in a three-dimensional FISP sequence is 2 mL/sec (15). In this study, because venous enhancement was known to be related to injection rate (6, 9, 14), the injection rate of contrast media for the augmentation of venous enhancement was set to a relatively high value, namely 3 mL/sec.
Finally, the effect of respiratory motion and pulsating blood flow on the time-intensity curves requires comment. At the level of image acquisition, the aorta and inferior vena cava were located at the center of a radially redundant respiratory motion. The ROIs were not shifted over the boundaries of target vessels in all serially acquired images, and free breathing was therefore allowed during acquisition. Periodic signal changes occurred in the aorta due to pulsating blood flow, however, and the resultant fluctuations were noted in the time-intensity curves. According to recent reports (6, 14), the addition of presaturation slabs at the superior and inferior aspects of the acquisition area is an effective way of reducing such flow-related signal changes in arteries and veins.
As a result of this study, we can confirm two facts. Firstly, the contrast bolus in the systemic artery was extensively and variably elongated, compared with infusion time. This latter, which is commonly used for scan-timing calculations, thus appears to be an inappropriate variable to substitute for the length of the main bolus. Secondly, among the parameters examined, the arterial and venous enhancement times and the arteriovenous circulation time of the test bolus were consistent with the characteristics of the main bolus. Other parameters such as peak enhancement time, enhancement duration and enhancement expansion ratio showed no statistical consistency between test and main boluses. In conclusion, the application of reliable parameters to the determination of scan delay time by means of MR angiography is likely to provide higher quality images.
 XML Download