

 PDF
PDF ePub
ePub Citation
 Print
Print


Hippocampal sclerosis is the most common pathologic substrate in patients with medically intractable temporal lobe epilepsy (1, 2). Even though the pathophysiology of hippocampal sclerosis is not completely understood, surgical resection of the hippocampus and anterior temporal lobe can cure epilepsy in as many as 90% of these patients (3-5). To achieve good surgical outcomes, the accurate preoperative localization of the epileptogenic focus is therefore essential (6). Various imaging methods, varying in accuracy, can aid in lateralizing or localizing hippocampal sclerosis. These include MR imaging, MR spectroscopy (MRS), single photon emission computed tomography (SPECT), and positron emission tomography (PET). In most patients with hippocampal sclerosis, MR imaging demonstrates atrophy and/or a high T2 signal in the affected hippocampus though in some it reveals no abnormalities. It has been suggested that in the lateralization of epileptogenic foci in patients with temporal lobe epilepsy, (H-1) MRS is useful, but the procedure is still at an early stage of clinical application. Several reports have described the changes occurring in H-1 MR spectra in hippocampal sclerosis (7-9), but the results and their interpretation vary greatly. Furthermore, existing data relating to H-1 MR spectra of normal hippocampus, essential in evaluating abnormal hippocampus, are insufficient.
The purpose of our study was to obtain H-1 MRS data for normal hippocampus, and to determine the ability of MRS to lateralize abnormal hippocampus in patients with hippocampal sclerosis.
MATERIALS AND METHODS
Subjects
In this study, 20 healthy volunteers with no history of seizures, significant head trauma or other neurologic abnormalities, formed the normal control group. Fifteen were male and five were female, and their ages ranged from 24 to 38 (mean, 29) years. Twenty-five patients with intractable temporal lobe epilepsy, whose MR imaging diagnosis was unilateral hippocampal sclerosis, comprised the patient group. Thirteen were male and 12 were female, and they were aged between 19 and 55 (mean, 30) years. An MR imaging diagnosis of hippocampal sclerosis was based on the presence of either unilateral atrophy or high T2 signal intensity of the hippocampus, or both, by visual assessment. Patients with bilateral hippocampal abnormalities or any other abnormalities in addition to hippocampal lesion were excluded. All patients underwent presurgical evaluation using interictal and video-ictal EEG. Ictal SPECT and PET were performed in 15 and 20 patients, respectively. Nine underwent surgery and histopathologic examination revealed hippocampal sclerosis.
MRI and MRS techniques
For all MR imaging procedures, a clinical 1.5-T system (Signa Advantage; General Electric Medical Systems, Milwaukee, WI) was used. For control subjects, the procedure involved conventional spin-echo T1-weighted sagittal and fast spin-echo T2-weighted axial and oblique coronal sequences. For patients, a T2-weighted fast spin-echo sequence with 3-mm-thick sections, and a T1-weighted 3-D spoiled gradient-echo (SPGR) sequence with 1.5-mm-thick sections were obtained in the oblique coronal plane for evaluation of the temporal lobe. The angle of oblique coronal imaging was perpendicular to the long axis of the hippocampus. In-plane spatial resolution was approximately 1.0×1.0 mm (matrix, 256×256; FOV, 25 cm).
Single-voxel H-1 MRS was carried out immediately after acquisition of routine MR imaging, using the same 1.5-T unit. In each control subject, four spectra were obtained from two different sizes of the volume of interest (VOI) (6.0 cm3 = 2.0×2.0×1.5 cm, and 2.25 cm3 = 1.5×1.5×1.0 cm). Two VOIs were placed bilaterally in the mesial temporal area, including the hippocampus. The VOI included most of the hippocampal head and parts of its body, the amygdala, the parahippocampal gyrus and CSF in the temporal horn. In addition, spectra with VOI of 1.0cm3 (1.0×1.0×1.0 cm) mostly confined to the hippocampal head were obtained in five of the 20 control subjects. In 25 patients, spectra were obtained with a VOI of either 6.0 cm3 (n = 14) or 2.25 cm3 (n = 11) from the same area as that of control subjects. Because the signal-to-noise ratio was low, spectra with a VOI of 1.0 cm3 were not obtained in the patient group. To avoid potential magnetic susceptibility artifacts from the skull base and sphenoid sinus, and contamination by fat in the skull base, VOIs were carefully placed.
In all subjects, spectra were obtained using a point-resolved spin-echo spectroscopy (PRESS) sequence with an echo time of 136 msec, repetition time of 1500 msec, and 128 scans. Before spectroscopic measurements, field homogeneity was optimized over the selected VOI by observing the H-1 MR signal of tissue water with a spatially selective PRESS sequence. In most examinations, typical full widths at half maximum (FWHM) of 4-8Hz were achieved. The water signal was suppressed by a frequency-selective saturation pulse at the water resonance. A sweep width of 1000 Hz was used with data size of 1024 points, and only the second half of the echo was acquired. Following the zero-filling of 4096 points in all free induction decay (FID) data, exponential line broadening (center: 0 msec, half time: 150 msec) was performed before Fourier transformation. Zero-order phase correction was applied to all spectra.
Data evaluation
The metabolite peaks seen on MRS were assigned for N-acetyl aspartate (NAA) at 2.0 ppm, for the creatine complex (Cr) at 3.0 ppm, and for choline compound (Cho) at 3.2 ppm. The metabolite ratios of NAA/Cho and NAA/Cr were calculated from the relative peak height measurements obtained on the workstation, and in both control subjects and patients, mean and standard deviation (SD) were calculated for those ratios. In control subjects, mean NAA/Cho and NAA/Cr ratios were compared between two different sizes of VOI, and between the right and left sides. Ninety-five percent confidence levels (2 SDs) of NAA/Cho and NAA/Cr ratios in control subjects were used as threshold (cut-off) values to determine abnormal NAA/Cho and NAA/Cr ratios in patients; either an NAA/Cho or NAA/Cr ratio below the threshold values was interpreted as abnormal. The ability of MRS to lateralize an epileptogenic lesion and to detect bilateral abnormalities was assessed using the visual MR imaging diagnosis as a standard of reference. When the abnormal side seen on MRS was concordant with that seen on MR imaging, lateralization was considered correct. When MRS showed bilateral abnormalities, this was also considered indicative of correct lateralization, regardless of which side was shown by MRS to be more affected. Statistical significance was assessed using the Student t test.
RESULTS
Control subjects
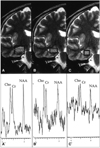
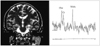
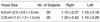
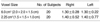
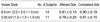
In 20 control subjects, MR imaging revealed symmetry in the size and signal intensity of both hippocampi. Representative spectra with three different sizes of VOI from the hippocampus of control subjects are shown in Fig. 1. As seen in Fig. 1, signal-to-noise ratios of metabolites decreased as the VOI was reduced. In control subjects, the NAA peak was usually slightly higher than the Cho and Cr peaks. With a VOI of 6.0 cm3, the NAA/Cho ratio was 1.10±0.27 (mean±SD) and 1.10±0.18 on the right and left sides, respectively, whereas with a VOI of 2.25 cm3, this ratio was 1.20±0.42 and 1.10±0.29, respectively (Table 1). With a VOI of 6.0 cm3, the NAA/Cr ratio was 1.30±0.28 and 1.30±0.22 on the right and left sides, respectively, whereas with a VOI of 2.25 cm3, the ratio was 1.40±0.52 and 1.40±0.77, respectively (Table 2). There were no statistically significant differences in either NAA/Cho or NAA/Cr ratios between sides, and between different sizes of VOI. In five control subjects who underwent MRS with a VOI of 1.0 cm3, signal-to-noise ratios of the metabolites were lower than those of the larger VOI, making it difficult to calculate the metabolite ratios.
Regardless of VOI size (i.e., 6.0 cm3 or 2.25 cm3), the NAA/Cho ratio in control subjects was greater than 0.8 and the NAA/Cr ratio was greater than 1.0, with a 95% confidence level.
Epilepsy patients
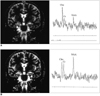
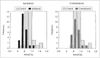
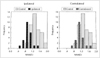
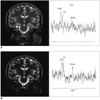
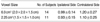
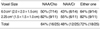
Representative spectra from the affected hippocamus and contralateral normal-appearing hippocampus are illustrated in Fig. 2. With a VOI of 6.0 cm3, the NAA/Cho ratio was 0.81±0.13 (mean±SD) on the affected side and 0.90±0.19 (mean±SD) on the contralateral side. With a VOI of 2.25 cm3, this ratio was 0.78±0.22 (mean±SD) on the affected side and 0.80±0.15 (mean±SD) on the contralateral side. With a VOI of 6.0 cm3, the NAA/Cr ratio was 0.99±0.14 (mean±SD) on the affected side and 1.20±0.27 (mean±SD) on the contralateral side and with a VOI of 2.25 cm3, the ratio was 0.93±0.15 (mean±SD) on the affected side and 1.10±0.25 (mean±SD) on the contralateral side. NAA/Cho and NAA/Cr ratios on the affected side were significantly lower than those on the contralateral side in patients, and than those of control subjects (p < .05) (Tables 3, 4). On the contralateral side, these ratios were lower in patients than in control subjects, but the differences were not statistically significant. The distributions of NAA/Cho and NAA/Cr ratios on the affected and contralateral sides in both patients and control subjects are shown in Figs. 3 and 4.
MRS correctly lateralized the lesion in 72% of cases (18/25). The correct lateralization rate of MRS was significantly higher when the NAA/Cho ratio was used as a cut-off value than when the NAA/Cr ratio was used (64% versus 48%, p < .05). The correct lateralization rate of MRS was lower with a VOI of 6.0 cm3 than with one of 2.25 cm3 (64% versus 82%, p < .05). MRS was interpreted as bilaterally normal (i.e., false negative) in 28% of cases (7/25) (Fig. 5) (Table 5). Bilateral abnormalities were seen on MRS in 24% of cases(6/25) (Fig. 6); 24% (6/25) on the basis of an abnormal NAA/Cho ratio, and 20% (5/25) on the basis of an abnormal NAA/Cr ratio.
DISCUSSION
In control subjects, NAA concentration and NAA/Cho and NAA/Cr ratios in the temporal lobe were significantly lower than in other regions of the brain such as the frontal lobe, parietal lobe or thalamus (10, 11). Because of this regional variation in metabolite concentrations in normal brain, it is important for lateralization of the epileptogenic foci, that MRS findings should be compared between anatomically similar regions. Compared with other regions of the brain, water line width of the temporal lobe was occasionally greater, a fact presumably attributable to the magnetic susceptibility effect arising from the air-tissue interface of the petrous air cells. This increased line width may give rise to significantly poor resolution, insufficient water suppression and low signal-to-noise ratios, and may be one of the factors which limits the applicability of H-1 MRS to temporal lobe epilepsy. Signal-to-noise ratios can be improved by use of the PRESS sequence, which is more sensitive than STEAM (12), and this is the reason why we used this sequence rather than STEAM. In our study, mean NAA/Cho and NAA/Cr ratios of control subjects were 1.10-1.20 and 1.30-1.40, respectively with no difference between sides. There were no significant differences in either NAA/Cho or NAA/Cr ratios between VOI sizes of 2.25 cm3 and 6.0 cm3, and on the basis of our results, we used an NAA/Cho ratio lower than 0.8, and NAA/Cr lower than 1.0, as cut-off values.
Recent preliminary reports of single-voxel MRS have described promising but variable results in the evaluation of mesial temporal lobe epilepsy. Most MRS studies in patients with this condition have shown a decreased in NAA, NAA/Cr, and/or NAA/Cho+Cr values (13-16). Some studies showed decreased NAA only, without changes in Cr or Cho (17, 18), whereas others reported increase in both Cr and Cho (7, 13). Common to all studies is lower NAA values found in affected temporal lobes of patients than in control subjects. In that NAA/Cho or NAA/Cr ratios were lower in the affected hippocampus of patients with hippocampal sclerosis than in normal control subjects, the results of our study are consistent with those of others (13-16). A reduction in NAA/Cho or NAA/Cr can be interpreted as either decreased NAA, reflecting neuronal loss, or increased Cho or Cr, presumably reflecting gliosis (7, 19), or both. In our study, mean NAA/Cho and NAA/Cr ratios in affected hippocampus were significantly lower than those in control subjects, and on the contralateral side, MRS correctly lateralized the lesion in only 72% of cases (18/25). In 28% (7/25), MRS appeared normal (i.e., false positive). This low concordance rate of 72% between MRI and MRS might be mainly due to the partial volume averaging effect resulting from the fact that a relatively large VOI contained a small part of the atrophied hippocampus and a large portion of adjacent tissue. The correct lateralization rate was lower with a VOI of 6.0 cm3 than with one of 2.25 cm3 (64% versus 82%), a finding which appears to support the explanation provided by the partial volume averaging effect. This effect may be reduced by using two-dimensional chemical shift imaging, which allows sampling of a smaller VOI. In our study, the signal-to-noise ratio of MR spectra obtained with a VOI of 1 cm3 in five volunteers was too low to be analyzed, showing that two-dimensional chemical shift imaging was necessary. In some patients with hippocampal sclerosis in whom a VOI of either 6.0 cm3 or 2.25 cm3 encompassed not only the hippocampus but also adjacent temporal lobe structures, MRS demonstrated markedly decreased NAA/Cho or NAA/Cr ratios, or both. This can hardly be explained by loss or damage of hippocampal neurons only, and likely reflects the widespread damage found in the temporal lobe of these patients. This finding is supported by pathologic studies which showed that neuronal loss and reactive gliosis often extended beyond the hippocampus (1).
In our study, findings relating to the contralateral hippocampus in patients with hippocampal sclerosis differ from those described in other reports (7, 20). A previous study stated that the contralateral hippocampus of patients with temporal lobe epilepsy showed MRS features similar to those in control subjects (20). Connelly et al. (7), however, reported that NAA and Cho levels, and NAA/Cho+Cr ratios were significantly lower in the contralateral hippocampus of patients with temporal lobe epilepsy than in control subjects. They also found bilateral abnormalities in 40% of cases (10/25), as seen on MRS. This finding is consistent with the result of a previous study in which bilateral pathology was present in up to 50% of patients with temporal lobe epilepsy (21). Even though the significance of bilateral abnormalities is not fully understood, the demonstration of their existence is important if the neurobiology and pathology of epilepsy are to be understood and the patients clinically evaluated. It is not clear how the presence of contralateral abnormalities may affect the outcome of temporal lobe surgery. In our study, bilateral abnormalities were seen on MRS in 24% of cases (6/25), and although the differences were not statistically significant, mean NAA/Cho and NAA/Cr ratios of the contralateral hippocampus in the patients with hippocampal sclerosis were lower than those of control subjects. These varied results might be due to selection bias and the small sample sizes of the studies. We think that a limitation of our study is the matter of patient selection; in only nine was hippocampal sclerosis pathologically proven, and the MRI diagnosis of unilateral hippocampal sclerosis was based on visual evaluation only.
Most previous in vivo MRS studies reported the ratios of metabolite intensities, often using the Cr value as an internal reference. In our control subject data, however, Cr and Cho intensities varied, the former showing great variation. Furthermore, the correct lateralization rate of hippocampal sclerosis, and the detection rate of bilateral abnormalities were higher when based on NAA/Cho ratio than on the NAA/Cr ratio (64% versus 48%). This might be because Cho was higher than Cr, secondary to gliosis, although the exact cause is not certain.
In conclusion, single-voxel H-1 MRS is an useful and promising diagnostic tool in the evaluation of temporal lobe epilepsy, particularly for the detection of bilateral abnormalities. However, current MRS with semiquantitation using metabolite ratios is of limited value for accurate lateralization of the epileptogenic focus in hippocampal sclerosis. To improve the diagnostic accuracy of H-1 MRS, data acquisition with smaller voxel size but with a higher signal-to-noise ratio, and measurement of the absolute amount of metabolites, are needed.
 XML Download